Comparative transcriptome analysis of PBMCs in cats diagnosed with and recovered from FIPV
Ju Young Lee, Hyeong Ryeol Cho, Hong-Geun Oh, Jeong Ho Hwang

TL;DR
This study compares gene activity in cat blood cells to understand immune changes in feline infectious peritonitis and recovery.
Contribution
The study provides the first comparative transcriptome analysis of PBMCs in FIP-diagnosed and recovered cats.
Findings
677 and 431 differentially expressed genes were identified between FIPD/Normal and FIPR/FIPD cats.
Neutrophil degranulation and IL-8 signaling pathways showed contrasting patterns in FIPD and FIPR cats.
KLF6 and NF-κB were identified as upstream regulators of IL-8, promoting neutrophil activation.
Abstract
Feline infectious peritonitis is a viral disease caused by feline coronavirus an enveloped virus with a single-stranded RNA genome that is approximately 30 kb long. Although FCoV generally causes mild symptoms, approximately 5% of cases progress to death in cats worldwide. FCoV shares certain virological features with severe acute respiratory syndrome coronavirus 2 that causes COVID-19, indicating that common therapeutic strategies may be applicable. GS-441524 the parent drug of remdesivir and a competitive inhibitor of nucleoside triphosphates in viral RNA synthesis is a well-known treatment for FIP. However, comparative transcriptome and gene ontology analyses of normal (Normal), FIP-diseased (FIPD), and FIP-recovered (FIPR) cats have not yet been conducted. In this study, we compared the mRNA expression profiles of peripheral blood mononuclear cells from Normal, FIPD, and FIPR cats…
Genes, proteins, chemicals, diseases, species, mutations and cell lines named across the full text — each resolved to its canonical identifier and authoritative record.
Click any figure to enlarge with its caption.
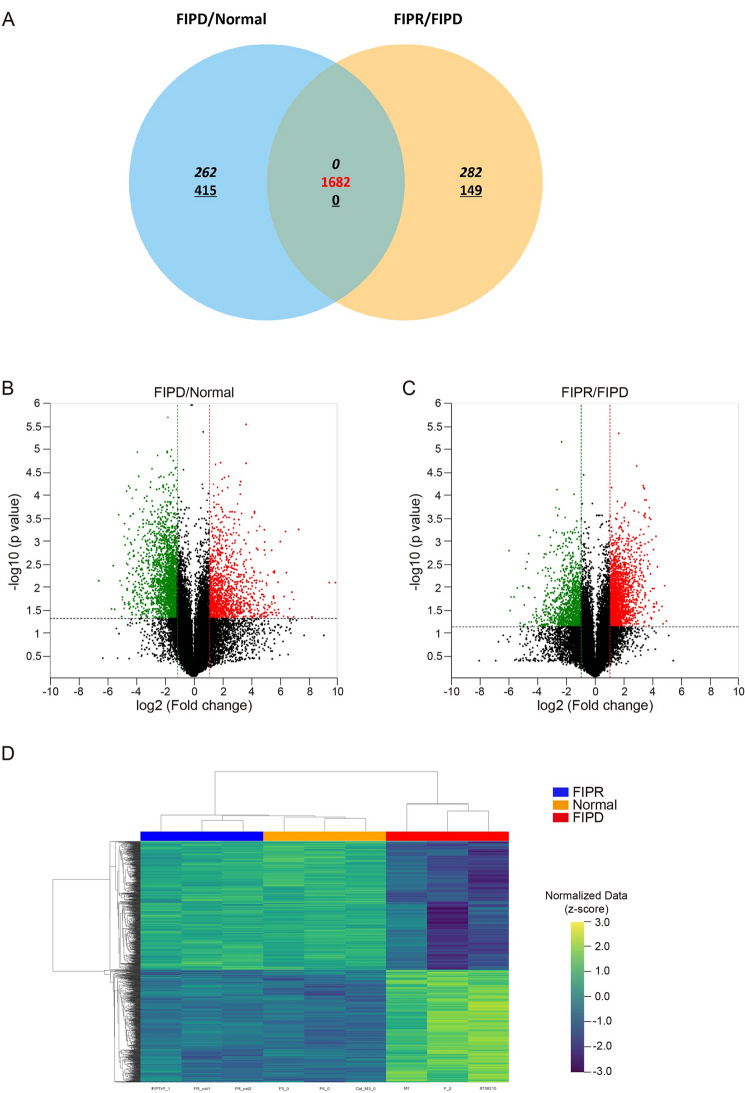 Figure 1
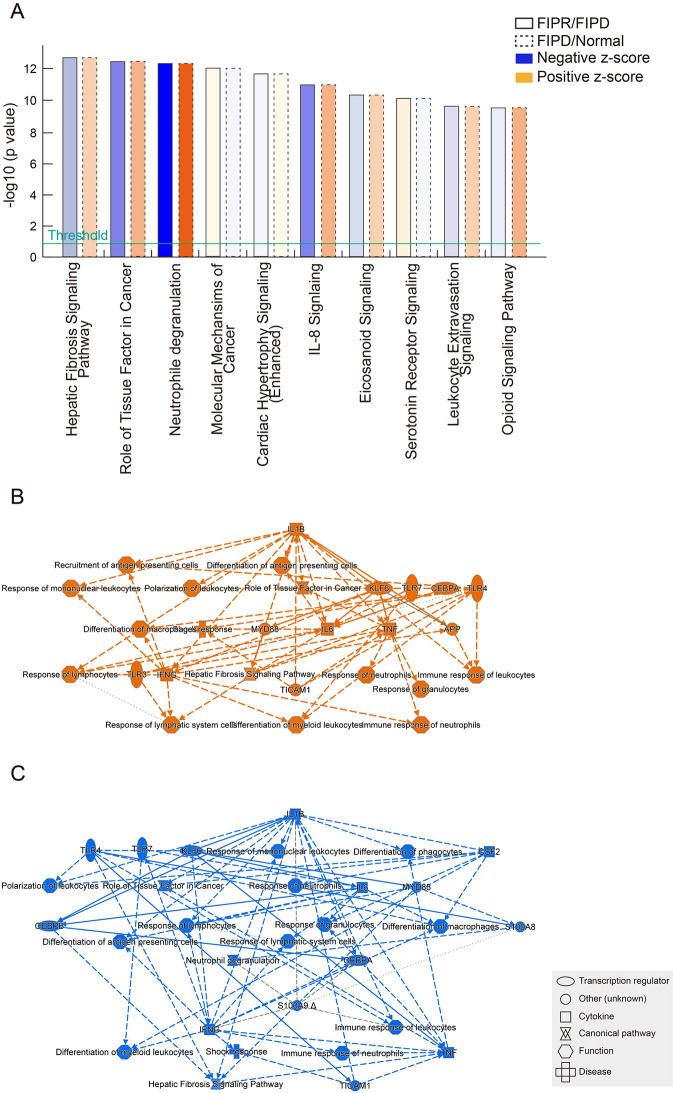 Figure 2
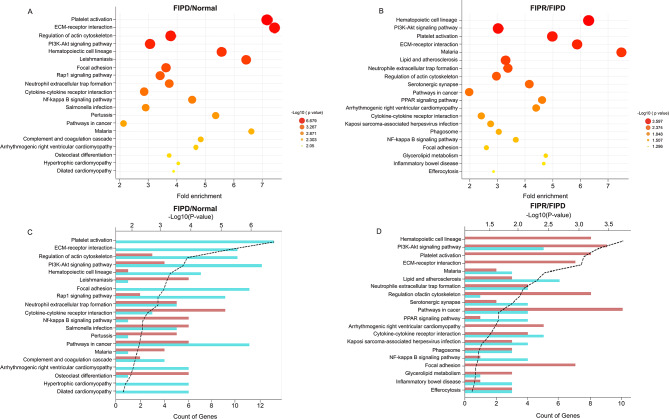 Figure 3
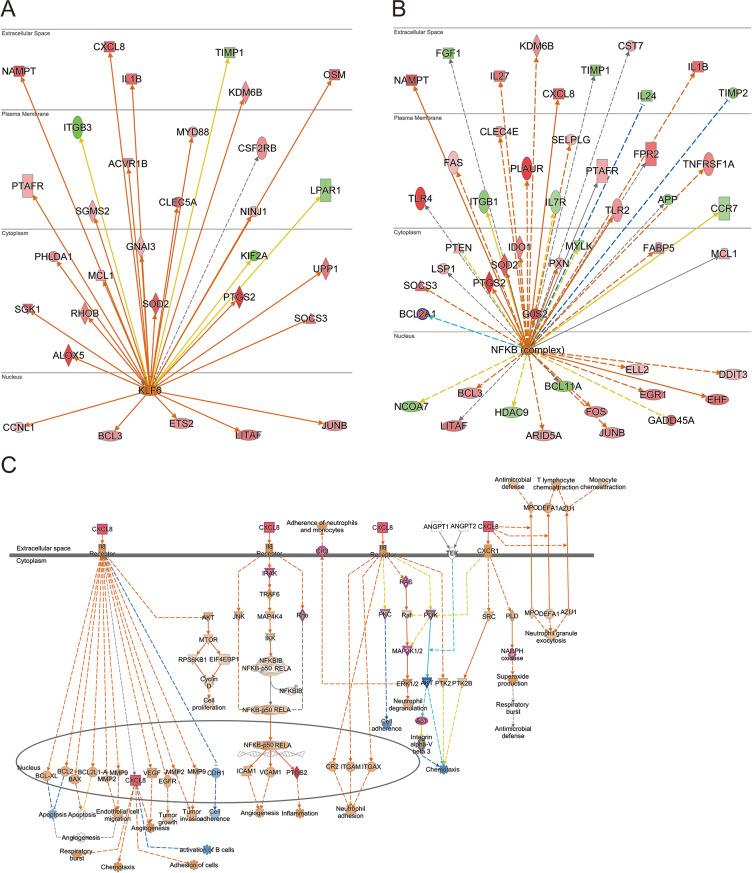 Figure 4
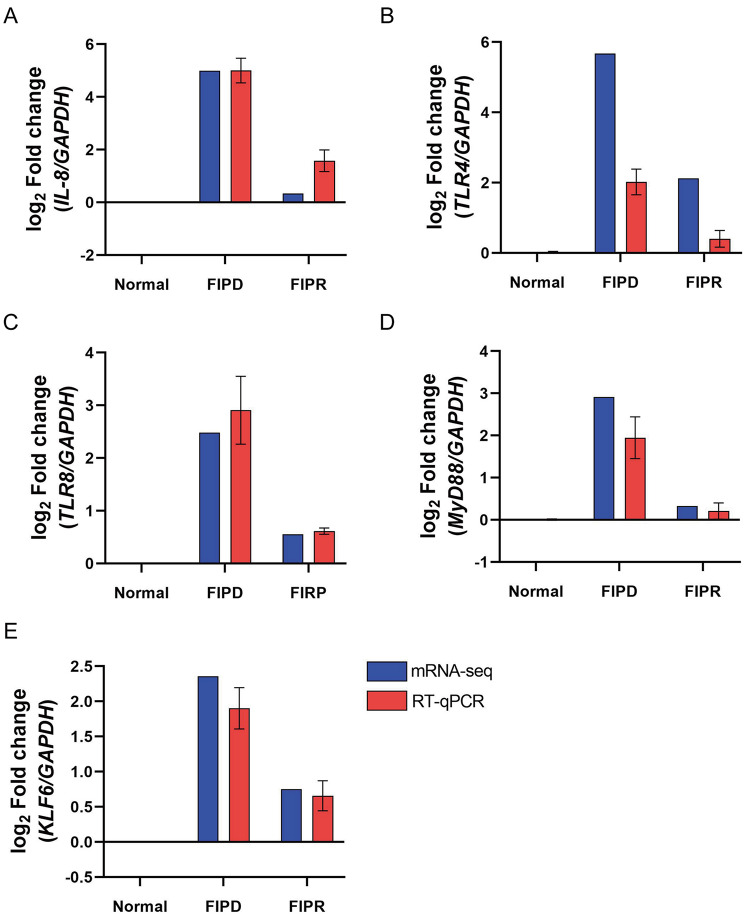 Figure 5
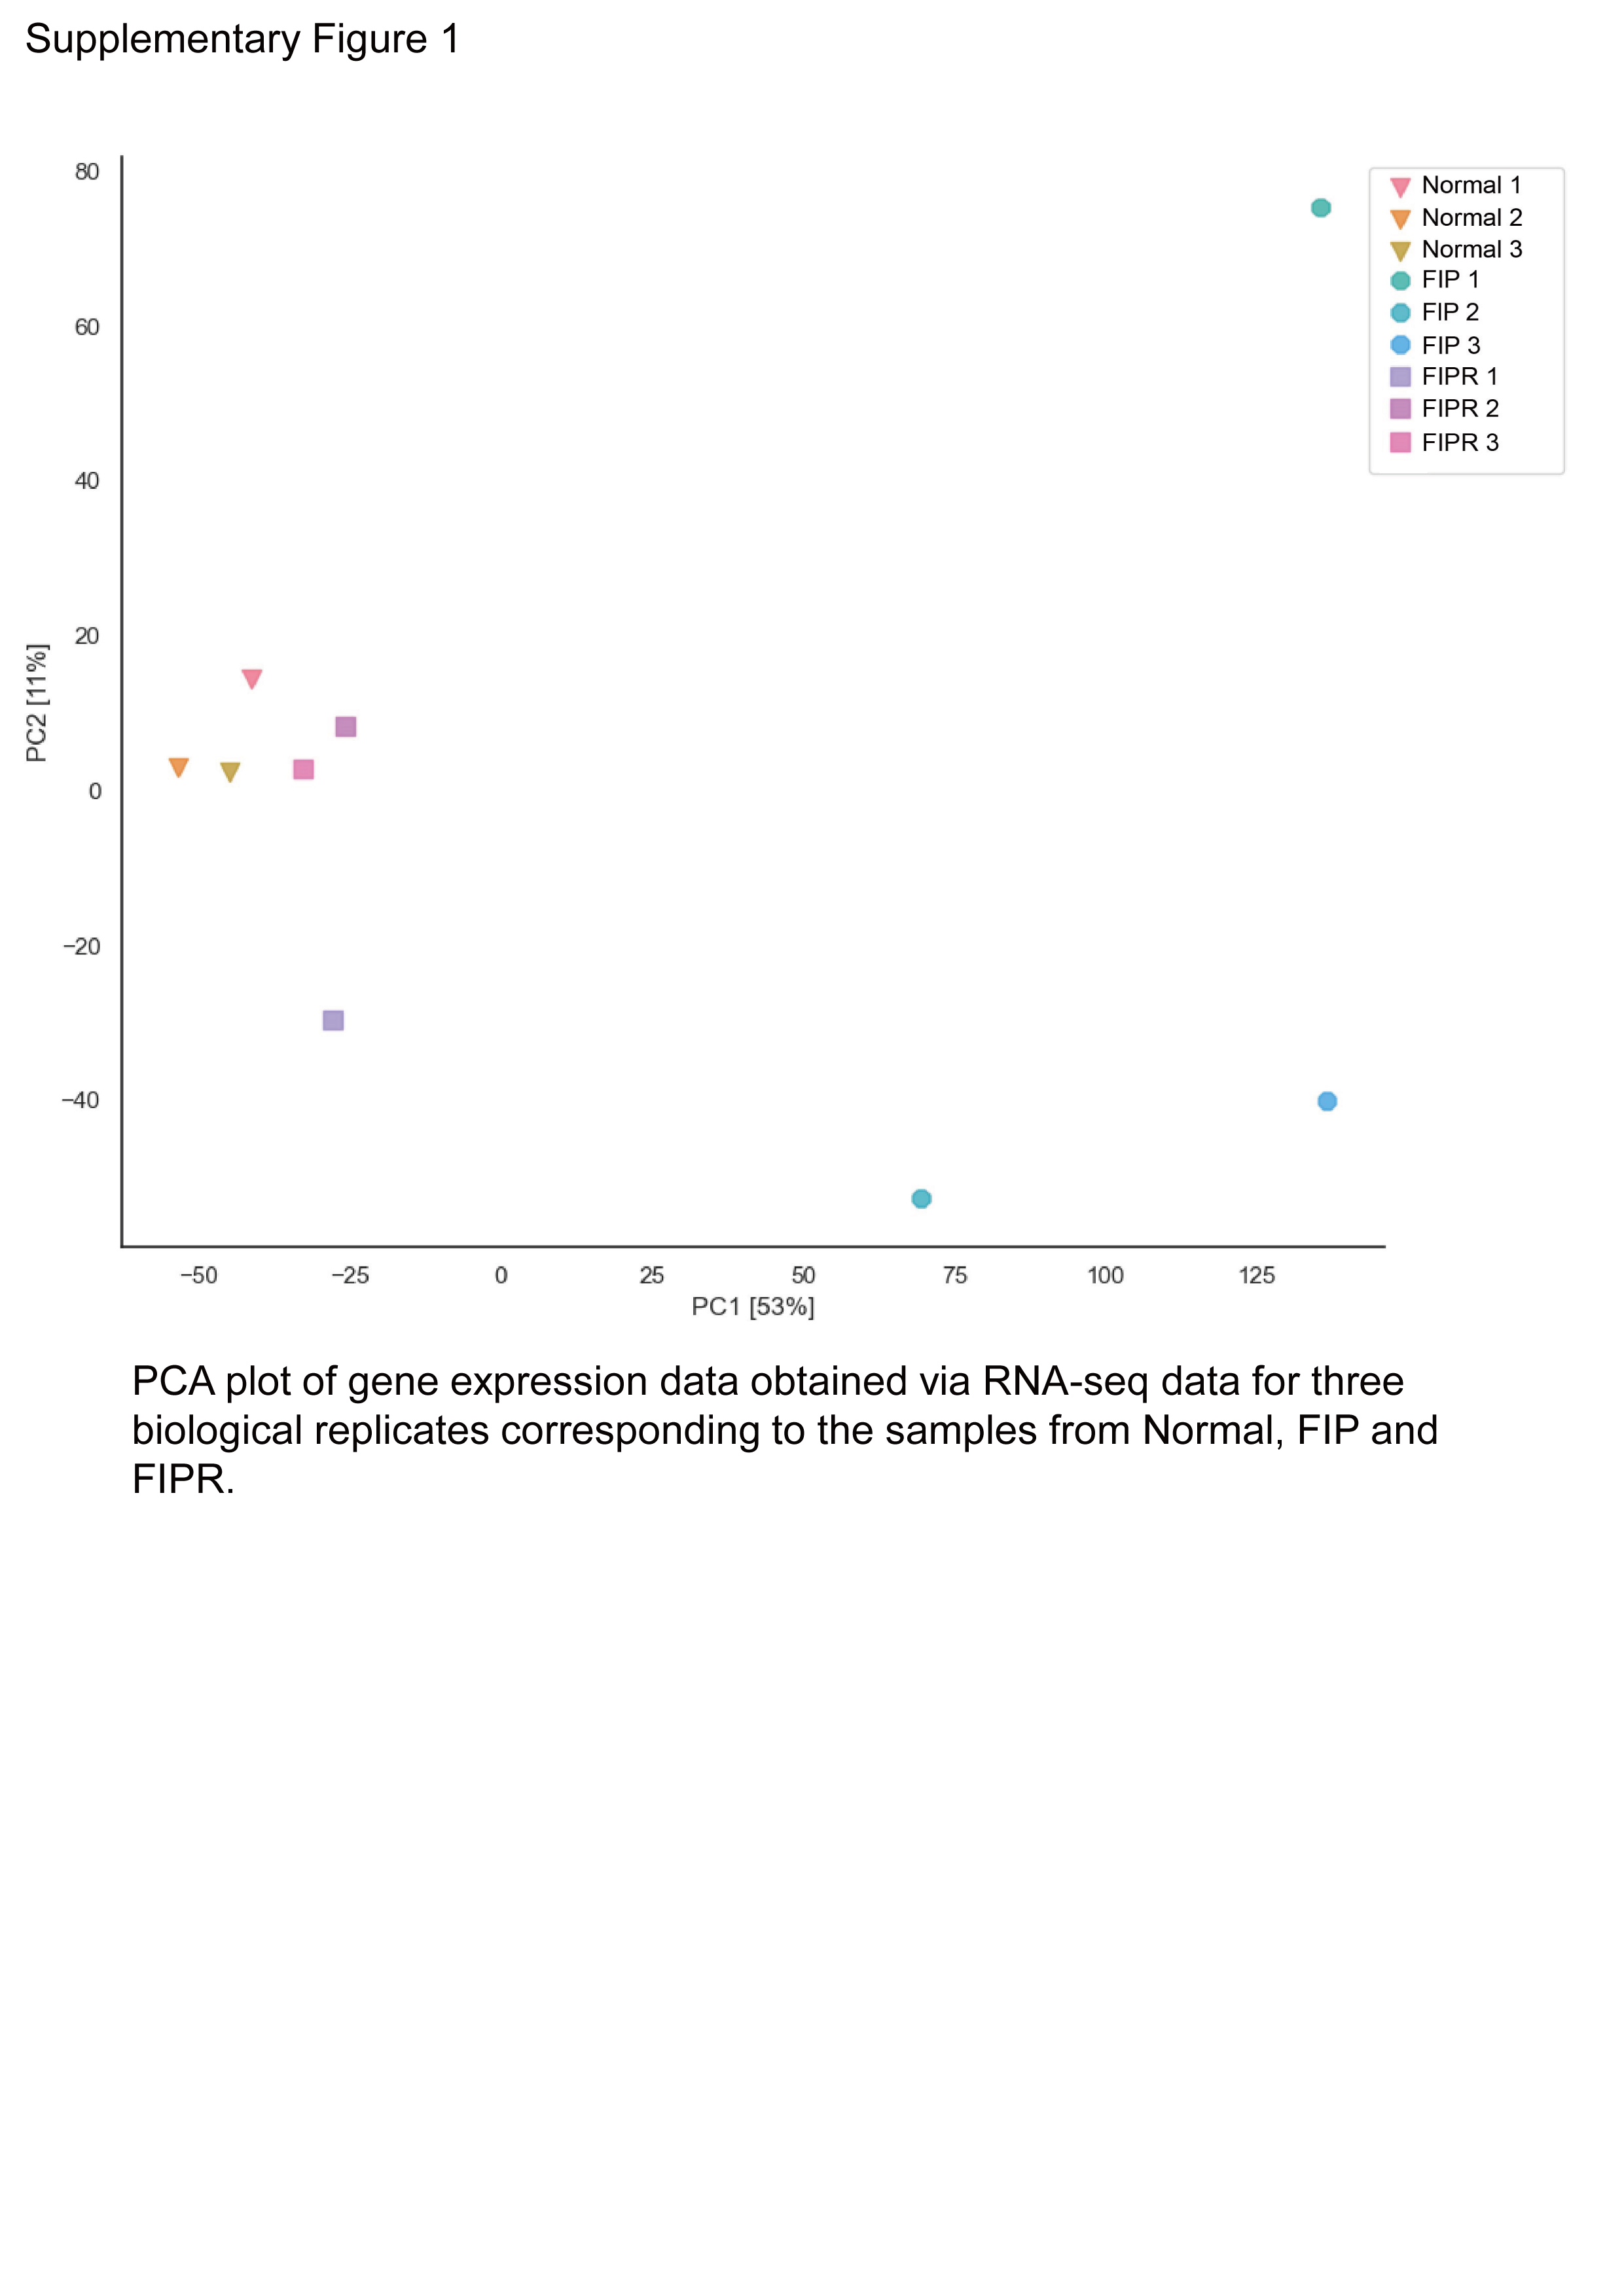 Figure 6
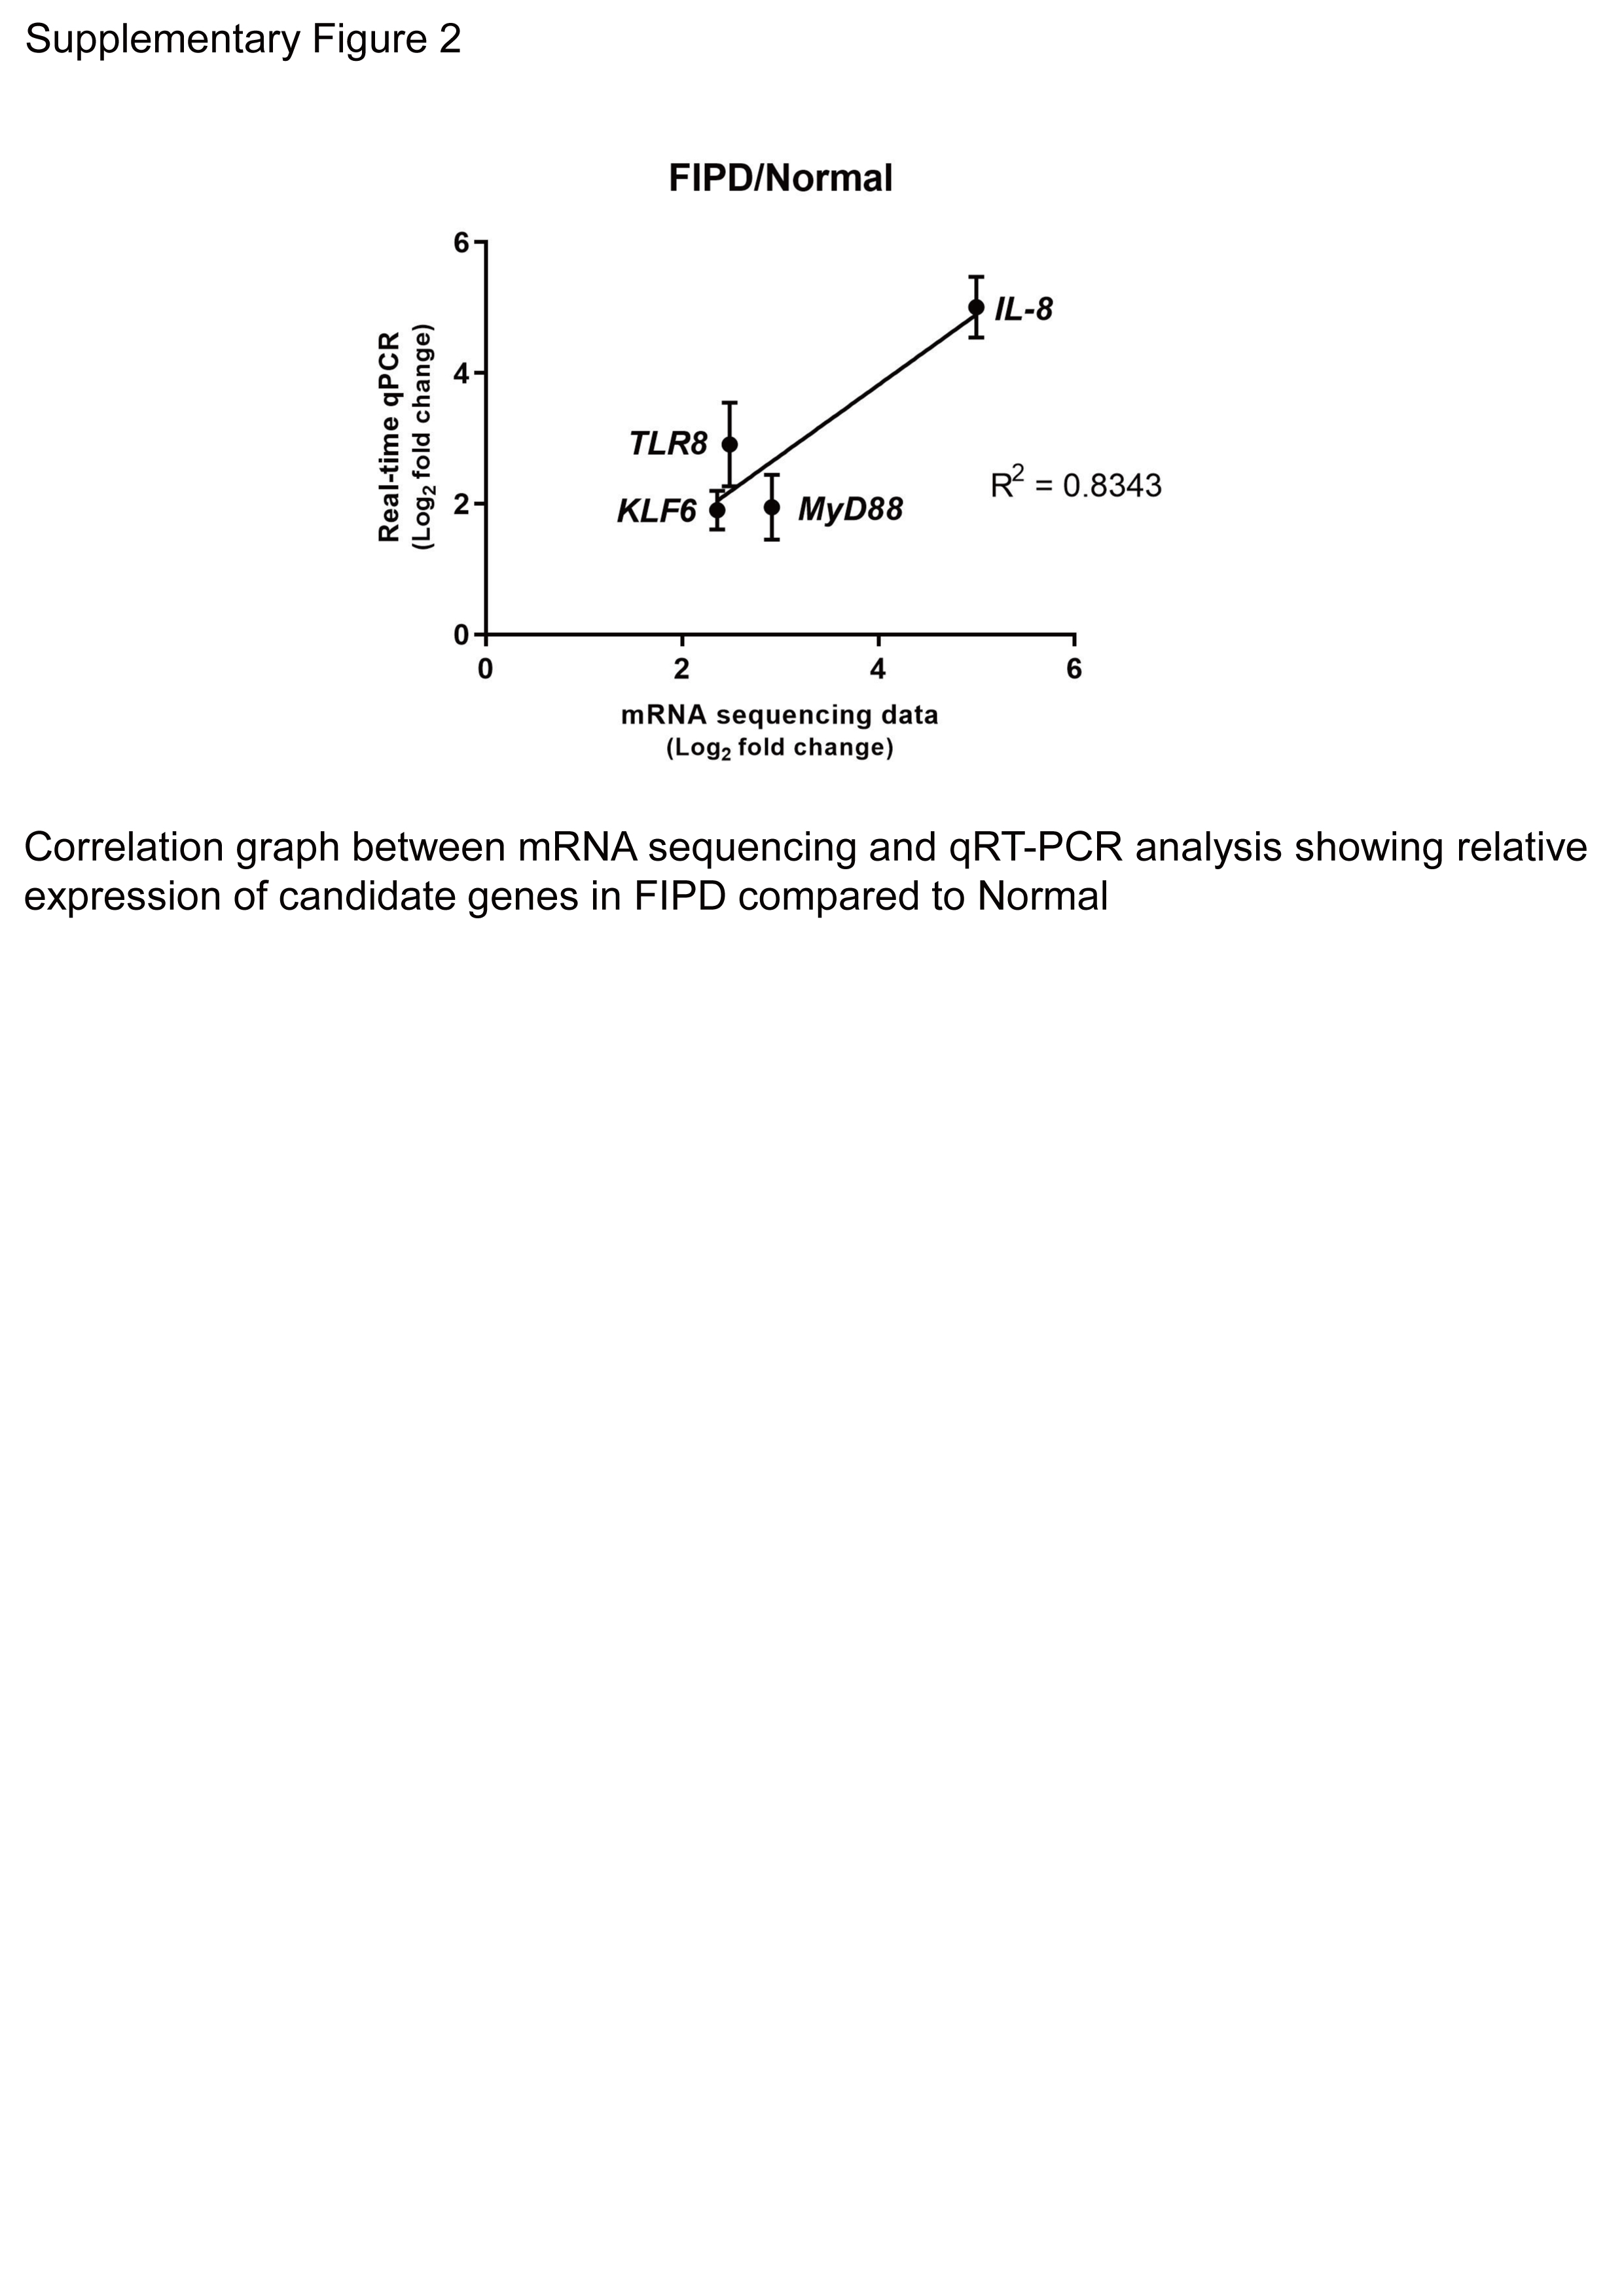 Figure 7
- —National Research Council of Science & Technology (KR))
- —http://dx.doi.org/10.13039/501100014188Ministry of Science and ICT, South Korea
Peer Reviews
No public reviews on file for this paper yet. If you reviewed it on a platform where reviews are public (OpenReview, ICLR, NeurIPS, ICML), you can paste yours below so the community can read it here.
Videos
No videos yet. Explain this paper in a talk, walkthrough, or lecture? Add one.
Taxonomy
TopicsNeutrophil, Myeloperoxidase and Oxidative Mechanisms · Streptococcal Infections and Treatments · Neonatal Respiratory Health Research
Background
Feline coronavirus (FCoV) is a single-stranded RNA (ss-RNA) virus from the Coronaviridae family that is commonly present in cats worldwide [1]. Feline infectious peritonitis (FIP) is a viral disease caused by the feline infectious peritonitis virus (FIPV), which originates from a mutated form of the non-pathogenic subtype of FCoV, feline enteric coronavirus (FECV). FECV infects intestinal epithelial cells, causing mild symptoms, such as diarrhea, vomiting, and upper respiratory symptoms [2]. By contrast, FIPV targets monocytes and macrophages. These cells trigger the release of pro-inflammatory cytokines, such as tumor necrosis factor-alpha (TNF-α), interleukin-1 beta (IL-1β), adhesion molecules, and vascular endothelial growth factor, resulting in systemic inflammation [3].
GS-441524, an adenosine nucleoside analog, is considered a treatment for FIP, effectively treating FIP and significantly enhancing survival rates in FIP-infected cats [4, 5]. Intracellularly, it undergoes phosphorylation to form monophosphate, which is subsequently phosphorylated to its active triphosphate form, GS-443902 [6]. This active form inhibits viral replication by mimicking endogenous adenine and undergoing integration into the viral RNA [7]. However, the immune-related molecular and biological pathways altered during FIP progression and recovery induced by GS-441524 remain poorly understood.
To overcome these limitations, we performed transcriptomic analysis of PBMCs derived from Normal, FIPD, and FIPR cats, along with FIPD/Normal and FIPR/FIPD comparative analyses. These comparisons were further analyzed using bioinformatics tools, such as ingenuity pathway analysis (IPA) and Kyoto Encyclopedia of Genes and Genomes (KEGG) analysis to identify biological pathways involved in FIP progression and recovery. These results were confirmed at the mRNA level by reverse transcription quantitative PCR (RT-qPCR).
Methods
Animals
Three cats from each group were included in this study. Veterinarians diagnosed the FIP-infected cats and treated them with GS-441,524 for recovery. During the hospital visit, blood samples were collected from the cephalic vein, following the experimental protocol. All procedures involving animal subjects were approved by the Huvet Institutional Animal Care and Use Committee (IACUC; approval number; HV2022-004). All efforts were taken to reduce the cats used and to alleviate any potential pain or distress during the experiments.
FIP diagnostic methods
The diagnosis of FIP was determined based on the following diagnostic criteria [8]: (1) evaluation of anorexia, (2) evaluation of pyrexia, (3) confirmation of exudative ascites through radiographic examination, (4) detection of a positive reaction in the Rivalta’s test using ascitic fluid sample, and (5) measurement of the Albumin/Globulin (A/G) ratio (< 0.4 considered as positive) in serum. These clinical and experimental criteria were integrated to diagnose effusive FIP.
RNA isolation
PBMCs were isolated from 1 mL samples of whole blood collected in ethylenediaminetetraacetic acid tubes, based on the density gradient separation method with Ficoll (Histopaque reagent-1077; Sigma-Aldrich, USA). RNA (1 µg) was extracted from 3 × 10^6^ PBMCs obtained from normal and obese cats using the phenol/chloroform extraction method, with the integrity of the isolated RNA being assessed using an Agilent 2100 Bioanalyzer (Agilent, CA, USA).
Library Preparation and sequencing
For control and test RNAs, we constructed the respective libraries using a QuantSeq 3’- mRNA-Seq Library Prep Kit FWD (Lexogen) according to the manufacturer’s instructions. Briefly, the respective total RNAs were prepared and oligo-dT primers containing an Illumina-compatible sequence at the 5’- ends were hybridized to the RNA, which was subsequently reverse transcribed. Following degradation of the RNA template, second-strand synthesis was initiated using a random primer containing an Illumina-compatible linker sequence at the 5’- end. The double-stranded libraries were purified using magnetic beads to remove all reaction components, and were subsequently amplified to attach the complete adapter sequences required for cluster generation, and thereafter were purified to remove the PCR components. High-throughput sequencing was performed as single-end 75-bp sequencing using a NextSeq 500 / 550 system (Illumina Inc.)
Data processing
Reads were filtered using BBDuk to quality-trim both ends to Q20 and aligned to the Felis_catus_9.0 genome assembly sequence using Bowtie 2 [9]. The alignment file was used for assembling transcripts and estimating their abundance. Differentially expressed genes (DEGs) were determined based on counts from unique and multiple alignments using coverage in Bedtools [10]. Analysis of DEGs between groups, along with the generation of hierarchical heat maps and volcano plots, was performed using Excel-based differentially expressed gene analysis software (ExDEGA; ebiogen, Inc., Seoul, Korea). The read count data were processed based on the TMM + CPM normalization method using EdgeR within R [11] using Bioconductor [12].
Functional annotation and gene ontology analyses
To assess the function of DEGs among the FIPD, Normal, and FIPR groups, we performed KEGG pathway analysis using the Database for Annotation, Visualization, and Integrated Discovery (DAVID) Bioinformatics Resources 6.8 [13, 14]. Additionally, upstream regulators, including transcription factors, canonical pathways, and causal networks were analyzed using IPA (Qiagen, CA, USA).
RT-qPCR
RT-qPCR was conducted in a 20 µl reaction mixture including SYBR Green Chemistry (Bio-Rad, CA, USA), 0.5 µM of each primer, and template cDNA. Amplifications were carried out using the Quantstudio 5 Real-time PCR System (Applied Biosystems, CA, USA). The amplification conditions consisted of an initial denaturation step at 95°C for 3 min, followed by 40 cycles of denaturation at 95°C for 20 s, and annealing and elongation at 60°C for 1 min. A final elongation step was not included. Glyceraldehyde 3-phosphate dehydrogenase (GAPDH) was used as the endogenous control to normalize the RNA samples. Primer sequences are detailed in Table 1. Relative gene expression levels were calculated using the 2^−ΔΔCt^ method and presented as log_2_ fold change (log_2_ FC).
Table 1. Primer used for quantitative real-time PCRGene symbolPrime sequences (from 5’ to 3’)Length (bp)Accession no. IL-8 F: GACCCCAAGCAAAAGTGGGT172NM_001009281.1R: ACTGCATGAAGTGCTGAAGTG TLR8 F: CGCCATTTCCCTGTACACCT74XM_045050678.1R: CGTCAGCGTTTGGAAAGCAA TLR4 F: GCTGGCAATTCTTTCCAGGACAAC208NM_001009223.1R: TCTGGAGGGAGTGAAGAGGTTCAT MyD88 F: TGTCCACGTGCTGGGTTATC117XM_003992253.5R: GGAGAGACCGAGGCCTAAGA KLF6 F: GTCTGGCTGGCCTGGTATTT196XM_003988067.6R: ATCAAGCGCCTGGATTTGGA GAPDH F: TGTGAACGGATTTGGCCGTA174NM_001009307.1R: CCGTTCTCAGCCTTGACTGTIL-8 = Interleukin-8, TLR8 = Toll-Like Receptor 8, TLR4 = Toll-Like Receptor 4, MyD88 = Myeloid Diff erentiation Primary Response 88, KLF6 = Kruppel-Like Factor 6, GAPDH = Glyceraldehyde 3-phosphate dehydrogenase
Statistical analysis
To confirm statistical significance, the p-value and z-score were computed using the computational algorithms of the Student’s t-test and Fisher’s exact test. Statistical analyses for RT-qPCR data were performed using Prism 8 software(GraphPad Software, San Diego, CA, USA). Data were represented as mean ± Standard Deviation (SD), and all experiments were conducted in three independent replicates, with each performed in triplicate.
Results
Differential mRNA expression in the PBMCs between normal, FIPD, and FIPR groups
To examine unbiased gene expression in the PBMCs of Normal, FIPD, and FIPR cats, mRNA sequencing was conducted. A total of 16,733 genes were detected from the 31,503 genes in the feline reference genome. In the FIPD/Normal comparison, a total of 677 DEGs (262 upregulated and 415 downregulated) were identified with statistical significance (p < 0.05,|log_2_ FC| ≥ 1). In the FIPR/FIPD comparison, 431 DEGs (282 upregulated and 149 downregulated) were identified with statistical significance. Comparing these two comparisons, 1,682 DEGs were contrast-regulated (Fig. 1A). The volcano plot (Fig. 1B and C) depicted the distribution of DEGs in the FIPD/Normal and FIPR/FIPD comparisons, with statistical significance. A hierarchical clustering heatmap (Fig. 1D) revealed transcriptomic differences among the groups, and the individual sample variation in each group was assessed based on a principal component analysis (PCA) plot (Supplementary Fig. 1). Whereas Normal and FIPR groups were found to be characterized by similar gene expression profiles. We observed significantly different clusters for the FIPD Group. To elucidate changes in the biological function of PBMCs, we focused on the top 10% and bottom 10% DEGs between FIPD and Normal (Tables 2 and 3). Most of the DEGs in the Top 10% were related to immune-related pathways.
Fig. 1. Summarized Transcriptome profiling of PBMCs between FIPD/Normal and FIPD/FIPR comparisons (A) Venn diagram shows the common up- (Italic), down- (Dashed), and contrast-regulated (Red) genes between FIPR/FIPD and FIP/Normal comparisons. Volcano plots representing DEGs pattern between (B) FIPD/Normal and (C) FIPR/FIPD. X-axis indicates log_2_ FC, and Y-axis indicates -log (p-value). Up (red) and down (green) regulated genes were filtered based on statistical significance (p < 0.05,|log_2_ fold| ≥ 1). (D) Clustering heatmap showing the gene expression profiles of individuals in FIPR, Normal, and FIPD groups
Table 2. Gene list of top 10% upregulated genes (FIPD/Normal)Gene symbolLog_2_ Fold changeAccession numberGene descriptionG0S28.879XM_011290970G0 /G1 switch 2PTGS26.583NM_001110449prostaglandin-endoperoxide synthase 2PPP1R3B6.164XM_006930598protein phosphatase 1 regulatory subunit 3B, transcript variant X1PLAUR6.009XM_006941179plasminogen activator, urokinase receptor, transcript variant X2S100A95.903XM_003999783S100 calcium binding protein A9, transcript variant X2PGLYRP15.756XM_003997668peptidoglycan recognition protein 1TLR45.671NM_001009223toll like receptor 4ALOX55.621XM_003994181arachidonate 5-lipoxygenase, transcript variant X1NAMPT5.432XM_011280328nicotinamide phosphoribosyltransferaseAATK5.350XM_023244281apoptosis associated tyrosine kinase, transcript variant X3WLS5.316XM_003990178wntless Wnt ligand secretion mediator, transcript variant X1AQP95.281XM_003987104aquaporin 9PADI45.207XM_003989527peptidyl arginine deiminase 4, transcript variant X1MARCKS5.171XM_023254273myristoylated alanine rich protein kinase C substrateACSL35.105XM_023259728acyl-CoA synthetase long chain family member 3, transcript variant X2BMX5.083XM_019823577BMX non-receptor tyrosine kinase, transcript variant X4LTF5.074XM_011291127lactotransferrinBCL2A15.019XM_003986739BCL2 related protein A1, transcript variant X3CXCL84.997NM_001009281C-X-C motif chemokine ligand 8ADGRG34.942XM_019819797adhesion G protein-coupled receptor G3, transcript variant X1PROK24.918XM_023249960prokineticin 2, transcript variant X1SOD24.905XM_023254547superoxide dismutase 2GADD45A4.877XM_023257813growth arrest and DNA damage inducible alpha, transcript variant X1FGD44.819XM_023256914FYVE, RhoGEF and PH domain containing 4, transcript variant X3CD300E4.740XM_023244065CD300e moleculeB9D14.676XM_003996329B9 domain containing 1IL18RAP4.652XM_019826970interleukin 18 receptor accessory protein, transcript variant X2LRRC75B4.650XM_023241543leucine rich repeat containing 75BOSM4.579XM_023241580oncostatin M, transcript variant X2RUBCNL4.576XM_023251553RUN and cysteine rich domain containing beclin 1 interacting protein like, transcript variant X9MSRB14.575XM_003999032methionine sulfoxide reductase B1CLEC5A4.487XM_019825931C-type lectin domain containing 5 A, transcript variant X2CLEC12A4.482XM_003988405C-type lectin domain family 12 member A, transcript variant X1NLRP124.479XM_023245577NLR family pyrin domain containing 12MARCH34.479XM_003980726membrane associated ring-CH-type finger 3SGK14.465XM_019831272serum /glucocorticoid regulated kinase 1, transcript variant X1EHF4.457XM_019812258ETS homologous factor, transcript variant X1HCK4.456XM_006929858HCK proto-oncogene, Src family tyrosine kinaseIL1B4.448NM_001077414interleukin 1 betaDMRTC24.442XM_019819463DMRT like family C2, transcript variant X7SOCS34.431XM_023244150suppressor of cytokine signaling 3SLCO4C14.410XM_019837491solute carrier organic anion transporter family member 4C1, transcript variant X3SDR16C54.401XM_003999843short chain dehydrogenase /reductase family 16 C member 5TRPM24.370XM_019839301transient receptor potential cation channel subfamily M member 2, transcript variant X2PADI24.365XM_003989524peptidyl arginine deiminase 2KCNJ24.360XM_023243720potassium voltage-gated channel subfamily J member 2, transcript variant X3APOBR4.306XM_023247080apolipoprotein B receptorMREG4.282XM_023259667melanoregulinIL274.247XM_003998744interleukin 27, transcript variant X2ADGRE14.237XM_023240916adhesion G protein-coupled receptor E1TRIB14.196XM_004000118tribbles pseudokinase 1LITAF4.192XM_023246210lipopolysaccharide induced TNF factorPANK14.181XM_023240710pantothenate kinase 1, transcript variant X3MMP274.151XM_006936578matrix metallopeptidase 27ARHGEF374.150XM_006927999Rho guanine nucleotide exchange factor 37GPAT34.149XM_006930997glycerol-3-phosphate acyltransferase 3, transcript variant X3RAB3IL14.128XM_006937396RAB3A interacting protein like 1, transcript variant X2PLEKHG34.078XM_011283267pleckstrin homology and RhoGEF domain containing G3, transcript variant X4FPR24.063XM_023245239formyl peptide receptor 2, transcript variant X1EGR14.062XM_003980809early growth response 1UPP14.023XM_019825232uridine phosphorylase 1, transcript variant X3PHACTR14.014XM_019830229phosphatase and actin regulator 1, transcript variant X3ACVR1B4.011XM_023257090activin A receptor type 1B, transcript variant X1SRGN3.968XM_003993998serglycinGRAMD43.957XM_023257634GRAM domain containing 4NFIL33.945XM_023243253nuclear factor, interleukin 3 regulated, transcript variant X2ERG3.881XM_023238738ERG, ETS transcription factor, transcript variant X3IRAK33.866XM_023257205interleukin 1 receptor associated kinase 3, transcript variant X2FLOT23.857XM_011288993flotillin 2, transcript variant X2LTB4R3.840XM_019832870leukotriene B4 receptor, transcript variant X3HS3ST63.827XM_019821200heparan sulfate-glucosamine 3-sulfotransferase 6, transcript variant X3FOS3.827NM_001009341Fos proto-oncogene, AP-1 transcription factor subunitSTAC3.822XM_011286319SH3 and cysteine rich domain, transcript variant X2RAB323.804XM_003986627RAB32, member RAS oncogene familyNAPSA3.799XM_003997470napsin A aspartic peptidaseNCF43.791XM_003989234neutrophil cytosolic factor 4PLIN23.789XM_023242345perilipin 2, transcript variant X1WDFY33.785XM_023252965WD repeat and FYVE domain containing 3, transcript variant X3IL1RAP3.768XM_023260308interleukin 1 receptor accessory proteinICAM33.746XM_023245246intercellular adhesion molecule 3KLHL253.729XM_023254940kelch like family member 25, transcript variant X3PEAK33.723XM_023243395PEAK family member 3, transcript variant X3IDO13.708XM_003984814indoleamine 2,3-dioxygenase 1RHOB3.681XM_003984470ras homolog family member BPLD13.677XM_023260401phospholipase D1, transcript variant X4SLC15A33.667XM_023239889solute carrier family 15 member 3, transcript variant X1IL36G3.659XM_019827573interleukin 36 gamma, transcript variant X2KCND23.654XM_011280521potassium voltage-gated channel subfamily D member 2TMEM132A3.652XM_023239887transmembrane protein 132 A, transcript variant X1AGTRAP3.635XM_006934279angiotensin II receptor associated protein, transcript variant X1METRNL3.620XM_023244384meteorin like, glial cell differentiation regulatorRPS6KA23.614XM_023254569ribosomal protein S6 kinase A2, transcript variant X2GNG103.600XM_023242567G protein subunit gamma 10LIMK23.598XM_003994812LIM domain kinase 2, transcript variant X1PFKFB43.589XM_0039821636-phosphofructo-2-kinase /fructose-2,6-biphosphatase 4, transcript variant X2SPI13.577XM_019812399Spi-1 proto-oncogene, transcript variant X2TNFRSF1A3.574NM_001009361TNF receptor superfamily member 1 AULK13.537XM_023241256unc-51 like autophagy activating kinase 1ITGB23.530XM_011285804integrin subunit beta 2FGR3.528XM_011284511FGR proto-oncogene, Src family tyrosine kinase, transcript variant X4MRAS3.514XM_023260531muscle RAS oncogene homolog, transcript variant X1PHLDA13.502XM_004001594pleckstrin homology like domain family A member 1^1^Selection criteria for DEG is more than 2 fold change of gene expression and statistical significance threshold *p < 0.05
Table 3. Gene list of top 10% downregulated genes (FIP/Normal)Gene symbolLog_2_ Fold changeAccession numberGene descriptionALDOC-5.914XM_003996488aldolase, fructose-bisphosphate CLGALSL-5.111XM_023251713galectin likeMPL-5.009XM_019836840MPL proto-oncogene, thrombopoietin receptor, transcript variant X4AVIL-4.917XM_011284080advillin, transcript variant X2TMEM47-4.671XM_011291679transmembrane protein 47MPIG6B-4.572XM_019830370megakaryocyte and platelet inhibitory receptor G6b, transcript variant X4GP9-4.467XM_019825143glycoprotein IX platelet, transcript variant X3TSFM-4.436XM_023257173Ts translation elongation factor, mitochondrial, transcript variant X3MYL9-4.423XM_003983556myosin light chain 9, transcript variant X2DNASE1-4.331XM_019821040deoxyribonuclease 1DUSP26-4.330XM_003984789dual specificity phosphatase 26, transcript variant X1ITGA2B-4.300XM_003996987integrin subunit alpha 2bMTURN-4.294XM_023250465maturin, neural progenitor differentiation regulator homologGAS2L1-4.289XM_023241601growth arrest specific 2 like 1KIF2A-4.260XM_023256931kinesin family member 2 A, transcript variant X1CAPN5-4.177XM_023239405calpain 5, transcript variant X1PLEK2-4.163XM_003987746pleckstrin 2PDLIM1-4.144XM_023240760PDZ and LIM domain 1ADGRG1-4.140XM_019819790adhesion G protein-coupled receptor G1, transcript variant X2DIMT1-4.137XM_019834834DIM1 dimethyladenosine transferase 1 homolog, transcript variant X3CLIC5-4.101XM_011282370chloride intracellular channel 5MUC13-4.099XM_019839884mucin 13, cell surface associatedRBPMS2-4.085XM_023255207RNA binding protein with multiple splicing 2, transcript variant X2EHD3-4.068XM_003984350EH domain containing 3MPC1-4.062XM_023254568mitochondrial pyruvate carrier 1, transcript variant X2TRAP1-4.045XM_023246827TNF receptor associated protein 1, transcript variant X2ITGB3-4.032XM_003997035integrin subunit beta 3, transcript variant X2MUSTN1-4.032XM_006928855musculoskeletal, embryonic nuclear protein 1LY6G6F-4.031XM_006931567lymphocyte antigen 6 family member G6F, transcript variant X1VWF-4.020NM_001246279von Willebrand factorNRGN-3.988XM_003992528neurograninFAM210B-3.978XM_023251081family with sequence similarity 210 member B, transcript variant X1TREML1-3.968XM_006931693triggering receptor expressed on myeloid cells like 1, transcript variant X1CAVIN2-3.965XM_003990983caveolae associated protein 2ENDOD1-3.964XM_023239323endonuclease domain containing 1FBLN2-3.950XM_011280224fibulin 2, transcript variant X2FAM213A-3.932XM_023240612family with sequence similarity 213 member A, transcript variant X2GPX1-3.927XM_004001361glutathione peroxidase 1CC1H2orf88-3.913XM_019838376chromosome C1 C2orf88 homolog, transcript variant X3SPRN-3.848XM_023241171shadow of prion protein, transcript variant X1SEC14L5-3.833XM_003998895Section 14 like lipid binding 5NEXN-3.816XM_023258841nexilin F-actin binding protein, transcript variant X2MXRA7-3.804XM_023244060matrix remodeling associated 7, transcript variant X1MARCH2-3.792XM_023244497membrane associated ring-CH-type finger 2, transcript variant X1SMOX-3.781XM_023251425spermine oxidase, transcript variant X5TMEM40-3.766XM_019825103transmembrane protein 40, transcript variant X6EGFL7-3.741XM_019816758EGF like domain multiple 7, transcript variant X2MFAP3L-3.741XM_019828718microfibril associated protein 3 like, transcript variant X3ITGA2-3.733XM_023260785integrin subunit alpha 2IGFBP7-3.721XM_003985355insulin like growth factor binding protein 7REEP2-3.717XM_023255612receptor accessory protein 2, transcript variant X1CLEC1B-3.715XM_003988398C-type lectin domain family 1 member BYBX3-3.705XM_023256777Y-box binding protein 3, transcript variant X1EBF1-3.698XM_023260105early B-cell factor 1GP1BA-3.665XM_023243425glycoprotein Ib platelet alpha subunitGNG11-3.659XM_003982762G protein subunit gamma 11TSPAN9-3.641XM_023256682tetraspanin 9, transcript variant X3YPEL2-3.615XM_023244589yippee like 2, transcript variant X1DSTN-3.610XM_003983801destrin, actin depolymerizing factorSLC6A4-3.606XM_019817397solute carrier family 6 member 4, transcript variant X2XK-3.604XM_023249534X-linked Kx blood groupANGPTL1-3.584XM_003999231angiopoietin like 1CD79B-3.574XM_003997062CD79b molecule, transcript variant X1GUCY1A1-3.567XM_011281606guanylate cyclase 1 soluble subunit alpha 1, transcript variant X2RGS17-3.540XM_003986661regulator of G protein signaling 17, transcript variant X1SELENON-3.532XM_023258321selenoprotein NSSX2IP-3.493XM_023258862SSX family member 2 interacting protein, transcript variant X4RALGPS2-3.490XM_023247646Ral GEF with PH domain and SH3 binding motif 2, transcript variant X2WNK4-3.477XM_006940374WNK lysine deficient protein kinase 4, transcript variant X3PLEKHO1-3.472XM_023259107pleckstrin homology domain containing O1, transcript variant X4GJA4-3.471XM_003989842gap junction protein alpha 4IGSF3-3.446XM_023259039immunoglobulin superfamily member 3, transcript variant X5CD2H1orf198-3.432XM_023240426chromosome D2 C1orf198 homologIDS-3.415XM_006944057iduronate 2-sulfatase, transcript variant X3PAX5-3.413XM_011288547paired box 5, transcript variant X3RGS10-3.410XM_023240996regulator of G protein signaling 10, transcript variant X1QRSL1-3.386XM_003986421glutaminyl-tRNA synthase (glutamine-hydrolyzing)-like 1, transcript variant X1BCR-3.376XM_003994832BCR, RhoGEF and GTPase activating protein, transcript variant X1PDGFD-3.375XM_023239055platelet derived growth factor D, transcript variant X2ITGA6-3.365XM_023259459integrin subunit alpha 6PDE5A-3.340XM_019828142phosphodiesterase 5 A, transcript variant X3DOK2-3.311XM_003984731docking protein 2, transcript variant X1PPP1R14A-3.305XM_023245504protein phosphatase 1 regulatory inhibitor subunit 14 AESAM-3.305XM_003992530endothelial cell adhesion moleculeATP5F1E-3.296XM_023251059ATP synthase F1 subunit epsilon, transcript variant X2EXOC3L4-3.282XM_023256087exocyst complex component 3 like 4, transcript variant X3PAM-3.276XM_023258826peptidylglycine alpha-amidating monooxygenase, transcript variant X13EDAR-3.275XM_019826940ectodysplasin A receptor, transcript variant X3GP1BB-3.271XM_023242162glycoprotein Ib platelet beta subunitCMAH-3.270XM_011282051cytidine monophospho-N-acetylneuraminic acid hydroxylase, transcript variant X3TMEM189-3.267XM_023251114transmembrane protein 189, transcript variant X3CRYL1-3.241XM_003980288crystallin lambda 1PARVB-3.234XM_023257578parvin beta, transcript variant X1BACH2-3.226XM_019830960BTB domain and CNC homolog 2, transcript variant X2LHFPL2-3.225XM_023257794LHFPL tetraspan subfamily member 2, transcript variant X3DGKH-3.215XM_023251911diacylglycerol kinase eta, transcript variant X4FXYD4-3.213XM_023240696FXYD domain containing ion transport regulator 4, transcript variant X2GP5-3.211XM_023260294glycoprotein V platelet, transcript variant X2FAM98B-3.210XM_003987287family with sequence similarity 98 member BBCL11A-3.204XM_019827251B-cell CLL /lymphoma 11 A, transcript variant X2RASA3-3.198XM_023239448RAS p21 protein activator 3PARD6G-3.194XM_023242146par-6 family cell polarity regulator gammaKDR-3.190XM_011281879kinase insert domain receptorPOLR2B-3.185XM_006931102RNA polymerase II subunit B, transcript variant X2XG-3.174XM_023249228Xg blood group, transcript variant X9CST3-3.163NM_001184972cystatin CADGRA3-3.149XM_023253254adhesion G protein-coupled receptor A3SERPINB10-3.146XM_003995247serpin family B member 10TPD52-3.141XM_011291336tumor protein D52, transcript variant X5TUBB1-3.135XM_023250905tubulin beta 1 class VI, transcript variant X1LEF1-3.134XM_011281704lymphoid enhancer binding factor 1, transcript variant X4ABI2-3.133XM_019838510abl interactor 2, transcript variant X12FHL1-3.127XM_023249463four and a half LIM domains 1, transcript variant X2NBEA-3.124XM_023250717neurobeachin, transcript variant X1ARHGAP18-3.117XM_019831191Rho GTPase activating protein 18, transcript variant X2GUCY1B1-3.113XM_023252746guanylate cyclase 1 soluble subunit beta 1GPR174-3.096XM_019824022G protein-coupled receptor 174NCOA7-3.092XM_023254324nuclear receptor coactivator 7TIMP1-3.090XM_023249291TIMP metallopeptidase inhibitor 1STARD13-3.084XM_006927222StAR related lipid transfer domain containing 13, transcript variant X4SYN1-3.082XM_019823364synapsin I, transcript variant X1NRP2-3.082XM_006935486neuropilin 2, transcript variant X1PIK3C2B-3.058XM_023248052phosphatidylinositol-4-phosphate 3-kinase catalytic subunit type 2 beta, transcript variant X2STYK1-3.057XM_019834514serine /threonine /tyrosine kinase 1, transcript variant X2TIMP2-3.017XM_003997248TIMP metallopeptidase inhibitor 2SDK2-3.013XM_011289338sidekick cell adhesion molecule 2FGF1-2.994XM_011282709fibroblast growth factor 1, transcript variant X7TSPAN5-2.993XM_011281794tetraspanin 5, transcript variant X1GIN1-2.978XM_019837573gypsy retrotransposon integrase 1, transcript variant X2SELP-2.976XM_023247403selectin P, transcript variant X9TACC1-2.967XM_019828544transforming acidic coiled-coil containing protein 1, transcript variant X1KCNMA1-2.960XM_019813336potassium calcium-activated channel subfamily M alpha 1, transcript variant X2RASGRP1-2.951XM_023255509RAS guanyl releasing protein 1, transcript variant X2PDZK1IP1-2.935XM_019836948PDZK1 interacting protein 1, transcript variant X2BANK1-2.934XM_023252909B-cell scaffold protein with ankyrin repeats 1IL24-2.930XM_003999450interleukin 24KCNA3-2.925XM_019839096potassium voltage-gated channel subfamily A member 3FAM212B-2.923XM_023258981family with sequence similarity 212 member B, transcript variant X2TPM1-2.919XM_023255267tropomyosin 1, transcript variant X10TFPI-2.914XM_019838357tissue factor pathway inhibitor, transcript variant X2SMYD2-2.909XM_023248067SET and MYND domain containing 2EHD2-2.893XM_003997613EH domain containing 2AGPAT3-2.890XM_0232386591-acylglycerol-3-phosphate O-acyltransferase 3, transcript variant X3TOM1L2-2.890XM_006939908target of myb1 like 2 membrane trafficking protein, transcript variant X1ADARB1-2.889XM_023238631adenosine deaminase, RNA specific B1, transcript variant X8NREP-2.888XM_011284960neuronal regeneration related proteinSTARD4-2.884XM_006927876StAR related lipid transfer domain containing 4, transcript variant X1F2R-2.871XM_003981083coagulation factor II thrombin receptorNAP1L1-2.867XM_006933900nucleosome assembly protein 1 like 1, transcript variant X5SPP1-2.864XM_006930977secreted phosphoprotein 1, transcript variant X2ITGB1-2.860XM_023256252integrin subunit beta 1, transcript variant X3GRPR-2.853XM_019823588gastrin releasing peptide receptor, transcript variant X2AHNAK2-2.853XM_023256202AHNAK nucleoprotein 2FAM169B-2.847XM_023254965family with sequence similarity 169 member B, transcript variant X2SRD5A1-2.842XM_023239691steroid 5 alpha-reductase 1RND2-2.838XM_023243773Rho family GTPase 2F2RL3-2.826XM_023246905F2R like thrombin or trypsin receptor 3, transcript variant X1^1^Selection criteria for DEG is more than 2 fold change of gene expression and statistical significance threshold *p < 0.05
Activated inflammatory signal in PBMCs of FIP cats
Immune-related genes from PBMCs of the Normal, FIPD, and FIPR groups were analyzed using IPA and KEGG to identify the associated biological pathways. to identify the associated biological pathways, the top 10 biological pathways were filtered based on their high z-scores (Fig. 2A). Therefore, IPA was significantly enriched in various biological pathways. Among these, the neutrophil degranulation and IL-8 signaling pathways were identified as relevant and highly significant in the dataset. The neutrophil degranulation pathway demonstrated the highest -log (p-value) and z-scores, indicating statistical significance. A graphical summary of the IPA results highlighted the representation of inflammatory cytokines and their biological pathways (Fig. 2B and C). Additionally, the IL-8 signaling pathway involved in neutrophil recruitment and degranulation was significantly enriched. The KEGG enrichment analysis indicated the top 20 enriched pathways for FIPD/Normal and FIPR/FIPD comparisons. Similar to the IPA analysis results, KEGG analysis indicated the enrichment of DEGs in the neutrophil-associated pathway, specifically in the neutrophil extracellular trap (NET) formation pathway (Fig. 3A and B). These enrichments were observed in both FIPD/Normal and FIPR/FIPD comparisons. However, the analysis of DEGs revealed no difference in the number of upregulated and downregulated genes (Fig. 3C and D).
Fig. 2GO analysis from IPA software in PBMCs between FIPR/FIPD and FIPD/Normal comparisons (A) Top 10 canonical pathways ranked by -log (p-value). A negative z-score indicates an inhibitory signal in each pathway based on the DEGs. The significance threshold indicates -log (p-value) ≥ 1.3. Summarized molecular and pathway network of upregulated immune-related genes in PBMCs between (B) FIPD/Normal and (C) FIPR/FIPD. The color of the arrow and symbol indicates predicted activation (Orange), and inhibition (Blue)
Fig. 3. Top 20 of KEGG pathway enrichment analysis of DEGs ‘Fold enrichment’ and ‘Count of gene’ analysis in FIPD/Normal (A, C) and FIPR/FIPD (B, D) respectively. Functional annotation in the Y-axis is descending in order of -log (p-value) and the X-axis indicates fold enrichment and the count of up- and down-regulated genes associated with each pathway
Activation of IL-8 by KLF6 and NF-κB signaling pathways
Analysis of the upstream regulators and effectors of IL-8 revealed activation FIPD/Normal comparison. Specifically, KLF6 and NF-κB signaling pathways were identified as key upstream molecules of IL-8 activation (Fig. 4A and B). In the FIPD/Normal comparison, there was significant activation of the KLF6 and NF-κB signaling pathways (Fig. 4A and B), thereby upregulating IL-8 expression. Additionally, this activation was accompanied by upregulation of IL-8 and its associated downstream molecules (Fig. 4C). To confirm the mRNA sequencing data, RT-qPCR was conducted to assess the expression levels of IL-8,* Toll-like receptor 8 (TLR8), Toll-like receptor 4 (TLR4), myeloid differentiation primary response 88 (MyD88)*, and KLF6 in Normal, FIPD, and FIPR groups. The expression levels were converted to log_2_ FC for comparison. The patterns of expression levels observed in the RT-qPCR results exhibited consistency with the mRNA sequencing data (Fig. 5).
Fig. 4. Activation of upstream molecules of IL-8 in FIPD/Normal comparison (A, B) Interaction of KLF-6 and NF-κB with downstream molecules in the cellular environment. In both analysis results, IL-8 was commonly detected as an activated molecule. (C) Comprehensive overview of IL-8’s role in FIP condition. The schematic representation demonstrates downstream events mediated by IL-8. The color of the symbol indicates predicted activation (Oragne), predicted inhibition (Blue), activation (Red), and inhibition (Green)
Fig. 5. Validation of mRNA-sequencing data. Differential expression analysis of IL-8, TLR4, TLR8, MyD88, and KLF6 across Normal, FIPD, and FIPR groups. Gene expression levels were quantified as log_2_ FC, comparing mRNA-seq (blue bars) and RT- qPCR (red bars) results. Panels display expression patterns for (A) IL-8, (B) TLR4, (C) TLR8, (D) MyD88, and (E) KLF6
Discussion
FIP is an FCoV-caused disease, characterized by an immune-mediated response and high mortality rate, affecting both domestic and wild cats [15]. GS-441524 demonstrated high efficacy in cats with FIP by inhibiting viral replication and enhancing clinical symptoms [4, 16, 17]. However, there is a limited understanding of immune-related gene alterations during the progression and recovery of FIP. In this study, we conducted comparative transcriptome analyses of PBMCs obtained from Normal, FIPD, and FIPR cats to identify the underlying molecular mechanisms (Fig. 1). The analysis identified DEGs, indicating significant differences in gene expression patterns between Normal, FIPD, and FIPR cats (Fig. 1D). Based on these DEGs, we applied bioinformatics approaches to identify immune-related pathways that were altered during FIP progression and recovery.
The IPA identified the top 10 canonical pathways for both comparisons. Among these pathways, the neutrophil degranulation pathway was significantly activated in the FIPD/Normal comparison and inhibited in the FIPR/FIPD comparison. These findings indicate that neutrophils are activated during FIP progression and inhibited during recovery. Neutrophils are granule-filled white blood cells that play crucial roles during viral infection and inflammation, release granules to eliminate pathogens, and defend infection sites [18]. This process is mediated by various mediators, including cytokines such as IL-8 and TNF-α [19]. The IPA results notably demonstrated that the IL-8 signaling pathway was activated in the FIPD/Normal comparison and inhibited in the FIPR/FIPD comparison. These results are further supported by the mRNA sequencing data, which revealed an upregulation of IL-8 (log_2_ FC: 4.997) expression in the FIPD/Normal comparison, whereas IL-8 expression was downregulated in the FIPR/FIPD comparison. These findings thus confirm that the IL-8 signaling pathway acts as a chemoattractant and induces neutrophil migration, degranulation, and NET formation [20, 21].
The KEGG analysis further demonstrated significant enrichment in the NET formation pathway (Fig. 3). NET formation is a defense mechanism in which neutrophils release structures composed of DNA, histones, and antimicrobial proteins into their surroundings [22, 23]. NET formation can be triggered by various pathogens, including viruses [24–26]. This response neutralizes the invading pathogens, prevents their dissemination, and supports the immune response [27]. The NET formation process usually accompanies a specific form of programmed cell death referred to as NETosis [28]. NETosis induces the release of different pro-inflammatory mediators, including calgranulin proteins such as calgranulin A and B (S100A8 and S100A9), which contribute to the regulation of host inflammatory responses by interacting with pattern recognition receptors, such as the receptor for TLR4 [29, 30]. The mRNA sequencing data revealed a significant upregulation of S100A8 (log_2_ FC: 5.781), S100A9 (log_2_ FC: 5.903), and TLR4 (log_2_ FC: 5.671) in the FIPD/Normal comparison, thereby providing evidence for their roles in inducing inflammation and neutrophil activation.
To further dissect the regulartory mechanisms underlying IL-8 activation, we investigated the molecules upstream of IL-8 based on IPA. The IPA predicted that the upstream regulators KLF6 and NF-κB were activated in the FIPD/Normal comparison and inhibited in the FIPR/FIPD comparison (Fig. 4). Also, the mRNA sequencing data indicated significant upregulation of KLF6 (log_2_ FC: 2.357) expression in the FIPD/Normal comparison. KLF6 activates NF-κB and IL-8, which are induced by TNF-α and IL-1β [31]. Although TNF-α expression was not observed in the mRNA sequencing data, IL-1β (log_2_ FC: 4.448) expression was significantly upregulated. Therefore, we concluded that KLF6 plays a crucial role in regulating NF-κB and IL-8 activation. To confirm NF-κB activation, we analyzed its activation through the TLR-MyD88 signaling pathway, due to the limitations of mRNA sequencing data in assessing NF-κB activation [32]. Given that FIP is an ss-RNA virus, we observed the expression levels of TLR7 and TLR8, which recognize ss-RNA viruses [33]. TLR7 expression maintained a similar level in the FIPD/Normal comparison, whereas TLR8 (log_2_ FC: 2.485) expression was upregulated. After confirming TLR7/8 expression, we observed that MyD88 expression increased (log_2_ FC: 2.909), suggesting the activation of NF-κB.
To validate these findings, we confirmed the gene expression of IL-8 and its upstream regulators KLF6, TLR4, TLR8, and MyD88, which mediates the inflammatory response induced by calgranulin proteins. As a result, we observed that IL-8, KLF6, TLR8, and MyD88 expression levels were significantly higher in the FIPD group than in the Normal group, while these levels returned to normal values in the FIPR group, consistent with the mRNA sequencing results (Fig. 5 and Supplementary Fig. 2).
Our findings in this study provide novel insights into the immunological changes occurring in PBMCs during FIP infection and recovery. We identified distinct activation of IL-8 signaling and neutrophil degranulation pathways regulated by NF-κB and KLF6 in FIP infection condition, providing evidence that neutrophil-mediated inflammation plays a central role in disease progression and resolution. Given that GS-441524 effectively reduces viral load and alleviates clinical symptoms, we speculate that its therapeutic effects may mediated via the regulation of inflammatory pathways, as a consequence of viral suppression [34, 35]. However, in this study, the therapeutic and direct side effects of GS-441524 were not experimentally evaluated, warranting further investigation.
Conclusions
The results of this study demonstrate that during FIP progression, IL-8 signaling plays a crucial role in neutrophil activation and degranulation, while these immune responses are suppressed by the antiviral effects of GS-441524 treatment. Specifically, the upstream regulators of IL-8, KLF6, and NF-κB were inhibited, resulting in reduced IL-8 activation and inhibition of the neutrophil degranulation pathway. These findings provide valuable insights into the molecular mechanisms underlying FIP and support the immunomodulatory effects of GS-441524 in regulating the immune response during FIP infection.
Electronic supplementary material
Below is the link to the electronic supplementary material.
Supplementary Material 1
Supplementary Material 2
Supplementary Material 3