Classification of unsequenced Mycobacterium tuberculosis strains in a high-burden setting using a pairwise logistic regression approach
Isabel Rancu, Benjamin Sobkowiak, Joshua L. Warren, Nelly Ciobanu, Alexandru Codreanu, Valeriu Crudu, Caroline Colijn, Ted Cohen, Melanie H. Chitwood

TL;DR
This study explores using logistic regression to classify unsequenced tuberculosis strains in a high-burden setting, finding limited accuracy in predicting transmission clusters.
Contribution
The study evaluates a pairwise logistic regression method for classifying unsequenced M. tuberculosis strains in a high-transmission setting.
Findings
The model achieved 17.2% accuracy in predicting cluster membership for unsequenced cases in Moldova.
Restrictive or permissive SNP thresholds did not improve prediction performance.
Increasing the minimum cluster size improved prediction accuracy.
Abstract
Over the past three decades, molecular epidemiological studies have provided new opportunities to investigate the transmission dynamics of Mycobacterium tuberculosis. In most studies, a sizable fraction of individuals with notified tuberculosis cannot be included, either because they do not have culture-positive disease (and thus do not have specimens available for molecular typing) or because resources for conducting sequencing are limited. A recent study introduced a regression-based approach for inferring the membership of unsequenced tuberculosis cases in transmission clusters based on host demographic and epidemiological data. This method was able to identify the most likely cluster to which an unsequenced strain belonged with an accuracy of 35%, although this was in a low-burden setting where a large fraction of cases occurred among foreign-born migrants. Here, we apply a similar…
Genes, proteins, chemicals, diseases, species, mutations and cell lines named across the full text — each resolved to its canonical identifier and authoritative record.
Click any figure to enlarge with its caption.
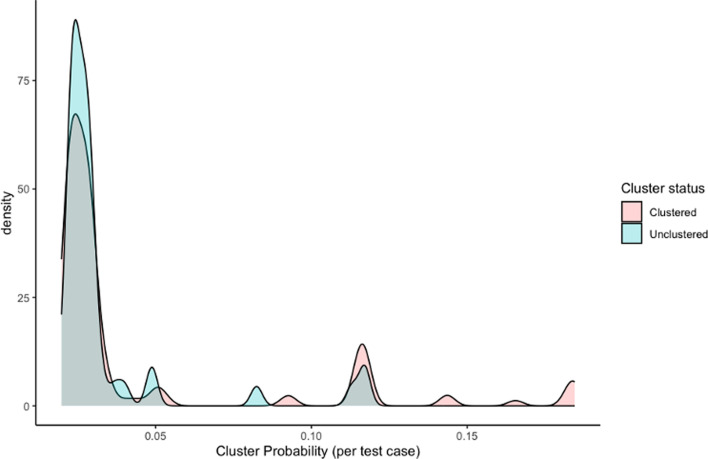 Fig. 1
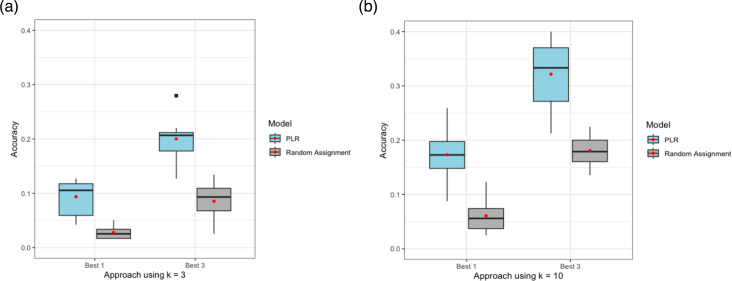 Fig. 2
| All individuals | Clustered individuals | Unclustered individuals | Clustered individuals | Unclusteredindividuals | |||
|---|---|---|---|---|---|---|---|
|
| |||||||
| Female | 365 (23.1%) | 270 (22.8%) | 95 (23.8%) | 195 (24.1%) | 162 (22.2%) | ||
| Male | 1,217 (76.9%) | 913 (77.2 %) | 304 (76.2 %) | 613 (75.9 %) | 567 (77.8 %) | ||
|
| |||||||
| Mean (SD) | 43.6 (13.6) | 42.8 (13.3) | 45.9 (14.3) | 42.2 (13.0) | 45.2 (14.0) | ||
| Median [Min, Max] | 43.0 [0, 86.0] | 42.0 [0, 86.0] | 45.0 [2.0, 86.0] | 41.0 [1.00, 86.0] | 44.0 [0, 86.0] | ||
|
| |||||||
| No | 1,404 (88.7 %) | 1,036 (87.6%) | 368 (92.2%) | 708 (87.6%) | 659 (90.4%) | ||
| Yes | 178 (11.3%) | 147 (12.4%) | 31 (7.8%) | 100 (12.4%) | 70 (9.6%) | ||
|
| |||||||
| No | 1,415 (89.4 %) | 1,054 (89.1 %) | 361 (90.5 %) | 732 (90.6 %) | 644 (88.3 %) | ||
| Yes | 167 (10.6 %) | 129 (10.9 %) | 38(9.5 %) | 76(9.4 %) | 85(11.7 %) | ||
|
| |||||||
| No | 1,396 (88.2 %) | 1,018 (86.1 %) | 378 (94.7 %) | 668 (82.7 %) | 687 (94.2 %) | ||
| Yes | 186 (11.8 %) | 165 (13.9 %) | 21 (5.3 %) | 140 (17.3 %) | 42 (5.8 %) | ||
|
| |||||||
| No | 951 (60.1 %) | 686 (58.0 %) | 265 (66.4 %) | 448 (55.4 %) | 474 (65.0 %) | ||
| Yes | 631 (39.9 %) | 497 (42 %) | 134 (33.6 %) | 360 (44.6 %) | 255 (35.0 %) | ||
| Cluster size cutoff | SNP threshold | PLR, ‘best 1’ Accuracy (%) | PLR, ‘best 3’ Accuracy (%) | Random,‘best 1’Accuracy (%) | Random,‘best 3’Accuracy (%) | No. clusters | No.ind. |
|---|---|---|---|---|---|---|---|
| k≥3 | 20 | 8.97 | 18.8 | 1.49 | 2.98 | 136 | 804 |
| 40 | 9.55 | 21.8 | 3.05 | 8.55 | 107 | 1183 | |
| 80 | 8.22 | 19.2 | 3.50 | 12.1 | 95 | 1266 | |
| k≥10 | 20 | 17.0 | 39.1 | 7.82 | 22.0 | 18 | 282 |
| 40 | 17.2 | 31.2 | 5.81 | 20.2 | 27 | 808 | |
| 80 | 12.6 | 28.8 | 6.61 | 19.6 | 26 | 938 |
- —Federal Government of Canada
- —http://dx.doi.org/10.13039/100000009 Foundation for the National Institutes of Health
- —http://dx.doi.org/10.13039/100000009 Foundation for the National Institutes of Health
Peer Reviews
No public reviews on file for this paper yet. If you reviewed it on a platform where reviews are public (OpenReview, ICLR, NeurIPS, ICML), you can paste yours below so the community can read it here.
Videos
No videos yet. Explain this paper in a talk, walkthrough, or lecture? Add one.
Taxonomy
TopicsTuberculosis Research and Epidemiology · Mycobacterium research and diagnosis
Data Summary
All sequencing data in this study are available in BioProject (https://www.ncbi.nlm.nih.gov/bioproject/PRJNA736718). Individual accession numbers for sequences used in this analysis (n = 1,582) are included in a supplementary file (Table S1, available in the online Supplementary Material). We use the R package ‘lr2cluster’ to produce the results reported in this study. All scripts and data that outline our findings can be found on Github (https://github.com/i-rancu/PLRModel_manuscript).
Introduction
The application of whole-genome sequencing (WGS) has allowed for high-resolution typing and drug-resistant profiling of *Mycobacterium tuberculosis *sequences, transforming our understanding of the transmission [1] and global dispersion of tuberculosis (TB) [23]. An important use of WGS data to infer transmission is by grouping similar sequences into clusters, which may be indicative of recent transmission between hosts [4]. The simplest way to assign individuals with TB to clusters is based on the number of single nucleotide polymorphisms (SNPs) by which two strains differ [15]. Once clusters are defined, demographic and epidemiological data can be leveraged to understand factors associated with belonging to the same cluster [16] and to support public health interventions [7].
One challenge of most molecular epidemiological approaches is the need to isolate mycobacterial DNA from culture prior to sequencing. Globally, only about 60% of pulmonary M. tuberculosis cases are diagnosed based on a positive microbiological test [8]. The high proportion of unsequenced TB infections with microbiological confirmation limits the completeness of WGS datasets, which may compromise inference about transmission in areas where many cases are not culture-positive or for whom sequencing is not performed.
A recent study introduced a pairwise logistic regression (PLR) model for predicting membership in M. tuberculosis transmission clusters using data collected in Valencia, Spain [9], a country with low TB incidence in which a large fraction of cases occur among the foreign-born. Here, we adapted this model and applied it to data collected in a large country-wide study of TB transmission in the Republic of Moldova. The objective of this analysis was to determine whether a PLR approach can accurately predict cluster membership in a setting where the majority of TB transmission occurs locally.
Methods
Data and approach
We used data from a previously reported country-wide molecular epidemiology study conducted in the Republic of Moldova in 2018–2019 [10]. We recruited all notified patients with TB and performed WGS on all culture-positive diagnostic specimens from consenting participants, along with collecting associated host demographic information (Table 1) [10]. We mapped sequencing reads to the H37Rv reference strain (Accession NC_000962.3) using BWA and performed variant calling with GATK to identify SNPs. A final multi-sequence alignment of concatenated SNPs (41,160 sites) was used to construct a maximum-likelihood phylogeny with IQ-Tree after excluding SNPs in repetitive regions, PE/PPE genes, and known resistance-conferring genes [11]. The R package TreeCluster [12] was used to identify putative transmission clusters using three patristic distance thresholds, which represent the maximum phylogenetic distance between cases in the same cluster: 5e-4, 1e-3 and 2e-3 substitutions/sites corresponding to ~20, ~40 and ~80 SNPs, respectively.
In total, 2,220 (79 %) M. tuberculosis strains were successfully sequenced; 386 had evidence of polyclonal infection and were excluded from the analysis and the remaining 1834 were used to infer clusters. A total of 1,548 (84%) of these isolates were in putative transmission clusters using a relatively permissive cluster definition (maximum pairwise distance of 1e-3 substitutions/site or ~40 SNPs), ranging in size from 2 to 105 isolates (Fig. S1). For subsequent analysis, we restricted our dataset to all cases, regardless of cluster membership, that had no missing information for all predictor variables used in our models (n=1,582; Table 1).
Pairwise logistic regression
We investigated whether we could predict which (if any) transmission cluster an M. tuberculosis strain would be assigned based on available epidemiological, demographic and spatial data. We predicted the transmission cluster to which a case was most likely to belong to using a relatively permissive cluster definition (~40 SNPs maximum) and two minimum cluster sizes: 3 and 10 individuals. For each minimum cluster size k, any individual in a cluster size n<k (including individuals with no putative cluster) was labelled ‘unclustered’. We then partitioned the data into 10 unique test sets (each comprising of 10 % of the data) and 10 training sets (each comprising the complementary 90% of the data), ensuring the test set never contained every member of a transmission cluster.
We fit a PLR model to all unique pairs in the training set with the outcome of 1 if that pair of individuals belong to the same cluster and 0 if not. In addition to the predictor variables described in Table 1, we used the distance between the individuals’ reguine (lowest administrative unit) of residence. We used the resulting parameter estimates to predict cluster membership for all cases in the test dataset. We report predictions for both the single most probable cluster (‘best 1’) and the three most probable clusters (‘best 3’) for each case. The model was considered ‘correct’ if the individual’s true cluster is the ‘best 1’ or one of the clusters in the ‘best 3’. We repeated this analysis ten times with each unique test set. Model accuracy was computed as the fraction of new cases whose true cluster was predicted correctly [9], and we expect that individuals labelled ‘unclustered’ will never be correctly assigned to a genomic cluster. We then compared the PLR model accuracy to an approach where we randomly assigned isolates to transmission clusters with probabilities proportional to cluster sizes.
Sensitivity analyses
We repeated the PLR model but only included individuals in clusters of size n≥k (i.e., we excluded any ‘unclustered’ individuals from the training and test sets). In addition, to test the effect of the genomic cluster threshold on model accuracy, we repeated the analysis using more permissive (maximum pairwise distance of 2e-3 substitutions/site or ~80 SNPs) and restrictive (5e-4 substitutions/site or ~20 SNPs) thresholds for clustering.
All analyses were conducted using R software, version 4.3.2.
Results
We implemented the PLR model using training and test sets derived from all individuals, considering clusters with a maximum pairwise distance of ~40 SNPs and a minimum cluster size of k=3. The most influential predictors were if both individuals in the pair were in Transnistria (standardized regression parameters: 1.11), if they were previously incarcerated (0.56) and a smaller spatial distance between individuals (−0.24). We found that the model predicted the true cluster membership of cases in the test set with a mean accuracy of 4.24% for the ‘best 1’ approach and 10.7% for the ‘best 3’ approach. With a k=10 threshold, we found that model performance worsened, yielding a mean accuracy of 3.10% for ‘best 1’ approach and 8.98% for ‘best 3’ approach. Despite low accuracy, the PLR model outperformed random assignment, which is expected to have low accuracy as it assigns individuals to a putative transmission cluster with a probability proportional to cluster size.
In this simple implementation, a truly unclustered individual could never have a ‘correct’ cluster assignment, as they were always assigned to a cluster based on their highest pairwise probability. An alternative approach would be to identify a probability threshold below which an individual would not be assigned to a cluster, which can allow for unclustered individuals to be correctly identified. However, we found that the probabilities associated with the ‘best 1’ cluster for truly unclustered and truly clustered individuals in the test set overlapped substantially, suggesting that clustered individuals were not substantially more likely to be assigned to a cluster than unclustered individuals (Fig. 1).
Example probability distribution associated with ‘best 1’ predicted clusters for all individuals in a sample test set for cluster size definition k=3 and ~40 SNPs threshold. Probabilities are coloured by whether the individual in the test set was labelled as a clustered (belonging to a genomic cluster size n≥3) or unclustered (belonging to a genomic cluster size n≤2 or no cluster at all).
We next ran the model including only individuals in clusters determined by a maximum threshold of ~40 SNPs. For the k=3 threshold (1,183 individuals in 107 clusters), we found that the model predicted the true cluster membership of individuals in the test set with a mean accuracy of 9.55% for the ‘best 1’ approach and 21.8% for the ‘best 3’ approach (Fig. 2a). For the k=10 threshold (808 individuals in 27 clusters), we found that model accuracy almost doubled to 17.2% for ‘best 1’ approach and 31.2% for ‘best 3’ approach (Fig. 2b). Both approaches outperformed random assignment (Fig. 2).
PLR model accuracies for ‘best 1’ and ‘best 3’ approaches using a threshold of ~40 SNPs and cluster size threshold of (a) k=3 and (b) k=10. PLR model performance was compared to random assignment, which assigns a likely genomic cluster with a probability proportional to cluster size. Model accuracies are computed as the average over the 10 unique test sets, with the mean accuracy indicated relative to the median by a red dot.
To determine whether these results were dependent on cluster definition, we refit the model using clusters found using maximum thresholds of ~20 SNPs and ~80 SNPs (Table 2). For the ~20 SNP threshold, we estimated an accuracy of 8.97% for ‘best 1’ approach and 18.8% for ‘best 3’ approach at the k=3 cutoff (Table 2). The model performed similarly for the ~80 SNP threshold, yielding 8.22% for the ‘best 1’ and 19.2% for the ‘best 3’ approach (Table 2). Increasing the minimum cluster size to k=10 increased model accuracy, yielding 17.0% and 12.6% for ‘best 1’ using ~20 and ~80 SNPs, respectively (Table 2). All sensitivity analyses using the PLR model outperformed random assignment (Table 2).
Discussion
We adapted and applied a pairwise regression approach to predict which putative transmission cluster an individual with TB most likely belongs to. When training the PLR model on both unclustered and clustered individuals, the method failed to distinguish the two types of individuals, resulting in very low model accuracy. When restricting analyses to only clustered individuals, model accuracy improved marginally. We found that the accuracy of the PLR approach was not sensitive to the choice of maximum pairwise distance thresholds but it was sensitive to the choice of minimum cluster size. Model accuracy improved when we used a cluster size cutoff of k=10, and we hypothesize that this improvement comes from reducing the total number of clusters (Fig. S1).
Notably, restricting the analysis to large clusters did not increase accuracy to levels described in the previous application of this approach to M. tuberculosis in Valencia [9]. In Valencia, the majority of incident TB occurs in high-risk populations, and including data on nationality, HIV status and diabetes diagnosis improved cluster prediction. While we did not have these data from Moldova, their exclusion likely had a modest impact on model performance in an endemic setting where TB transmission is not limited to high-risk populations. Additionally, the Valencia dataset included participant’s home addresses, while the data from Moldova included home village or city borough, limiting the precision of distance between cluster members as a predictor in our model.
A limitation of this application is the poor classification of individuals who do not belong to any putative transmission cluster. Future analyses may consider a multinomial approach in which pairs are classified into one of three categories: both clustered, both unclustered or mixed pairs. This approach would not enable the identification of the specific cluster to which a case most likely belongs; rather, it would need to be the first in a two-stage approach to classify unsequenced pairs.
Moldova is a TB-endemic setting and transmission is widespread throughout the country [13]. While we found that there were weak associations between specific genomic clusters and factors such as case home location, incarceration history and homelessness, transmission cluster membership was not easily predicted from routinely collected data. Our analyses suggest that while the PLR approach may perform well in lower burden settings where most transmission occurs within distinct subpopulations, we find that this approach does not allow for accurate cluster membership prediction in Moldova, where multiple strain types are co-circulating [13].
Conclusion
In the present study, we demonstrate that a pair-wise logistic regression approach to classify unsequenced strains in a region of endemic TB does not yield high-accuracy cluster assignments. We found that changing the definition of a cluster (i.e. changing the SNP threshold for cluster membership) had a minimal effect on model accuracy, while increasing the minimum cluster size (i.e. restricting the data to larger clusters only) increased model accuracy. These findings highlight the challenges of classifying individuals into clusters in endemic TB regions.
Supplementary material
10.1099/acmi.0.000964.v3Fig. S1.
10.1099/acmi.0.000964.v3Table S1.
The reference list from the paper itself. Each links out to its DOI / PubMed record.
- 1Hatherell H-A Colijn C Stagg HR Jackson C Winter JR et al Interpreting whole genome sequencing for investigating tuberculosis transmission: a systematic review BMC Med 2016142110.1186/s 12916-016-0566-x 27005433 PMC 4804562 · doi ↗ · pubmed ↗
- 2Comas I Coscolla M Luo T Borrell S Holt KE et al Out-of-Africa migration and neolithic coexpansion of Mycobacterium tuberculosis with modern humans Nat Genet 2013451176118210.1038/ng.274423995134 PMC 3800747 · doi ↗ · pubmed ↗
- 3Brynildsrud OB Pepperell CS Suffys P Grandjean L Monteserin J et al Global expansion of Mycobacterium tuberculosis lineage 4 shaped by colonial migration and local adaptation Sci Adv 20184 eaat 586910.1126/sciadv.aat 586930345355 PMC 6192687 · doi ↗ · pubmed ↗
- 4Campbell F Strang C Ferguson N Cori A Jombart T When are pathogen genome sequences informative of transmission events?PLOS Pathog 201814 e 100688510.1371/journal.ppat.100688529420641 PMC 5821398 · doi ↗ · pubmed ↗
- 5Stimson J Gardy J Mathema B Crudu V Cohen T et al Beyond the SNP threshold: identifying outbreak clusters using inferred transmissions Mol Biol Evol 20193658760310.1093/molbev/msy 24230690464 PMC 6389316 · doi ↗ · pubmed ↗
- 6Casali N Broda A Harris SR Parkhill J Brown T et al Whole genome sequence analysis of a large isoniazid-resistant tuberculosis outbreak in London: a retrospective observational study P Lo S Med 201613 e 100213710.1371/journal.pmed.100213727701423 PMC 5049847 · doi ↗ · pubmed ↗
- 7Denholm JT de Vries G Anthony R Robinson E Backx M et al Considering best practice standards for routine whole-genome sequencing for TB care and control IJTLD OPEN 2024143143610.5588/ijtldopen.24.032039398433 PMC 11467850 · doi ↗ · pubmed ↗
- 8World Health Organization Global Tuberculosis Report 2023 https://www.who.int/teams/global-tuberculosis-programme/tb-reports/global-tuberculosis-report-2023 accessed 8-September-2024