Investigating laryngeal squamous cell carcinoma: clinical features and the role of TAS2R16 polymorphisms and its protein levels
Enrika Pileckaite, Alvita Vilkeviciute, Vykintas Liutkevicius, Rasa Liutkeviciene

TL;DR
This study explores how genetic variations in TAS2R16 may influence the risk and progression of laryngeal squamous cell carcinoma, particularly in non-smokers.
Contribution
The study identifies specific TAS2R16 polymorphisms associated with reduced odds of LSCC in non-smokers and higher protein levels in LSCC patients.
Findings
TAS2R16 rs1357949 GG and AG genotypes are linked to lower LSCC risk in non-smokers.
Each rs1357949 G allele reduces the odds of LSCC occurrence in non-smokers.
LSCC patients with rs978739 CT genotype have higher TAS2R16 serum levels.
Abstract
Laryngeal squamous cell carcinoma (LSCC) is the second most common malignancy of the respiratory tract after lung cancer, presents symptoms like hoarseness, sore throat, and dysphagia, and about 150,000 new cases are diagnosed worldwide annually. Risk factors such as tobacco smoking, alcohol consumption, and genetic variations, including TAS2R16 polymorphisms, significantly influence LSCC development. Recent research suggests TAS2R16, a bitter taste receptor, may play a role in inflammation regulation and could be linked to cancer susceptibility, particularly in individuals with alcohol and nicotine dependency. A total of 312 LSCC patients and 320 healthy controls participated in the study. Deoxyribonucleic acid (DNA) was extracted using salting-out technology. Real time polymerase chain reaction was used for genotyping. Using the ELISA technique, serum levels were measured. The…
Genes, proteins, chemicals, diseases, species, mutations and cell lines named across the full text — each resolved to its canonical identifier and authoritative record.
Click any figure to enlarge with its caption.
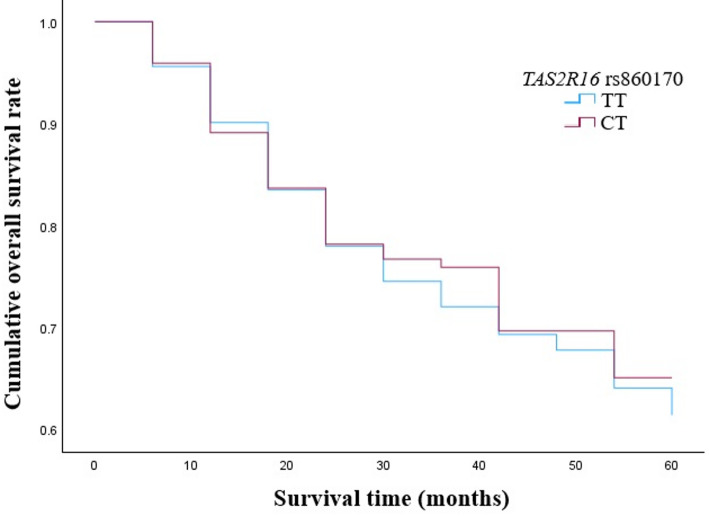 Figure 10
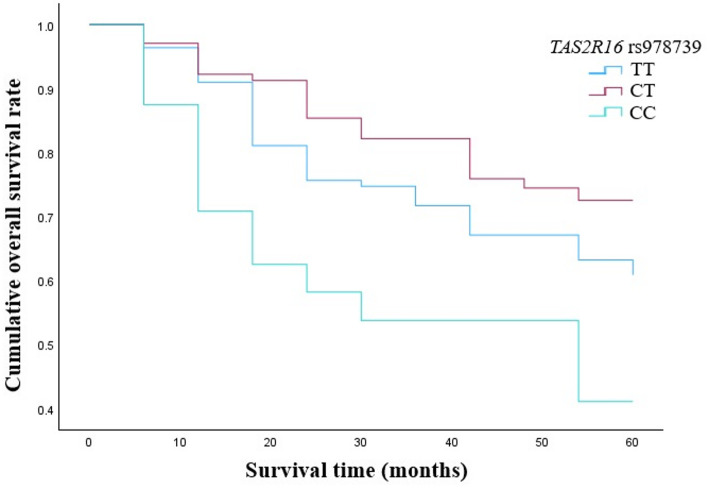 Figure 11
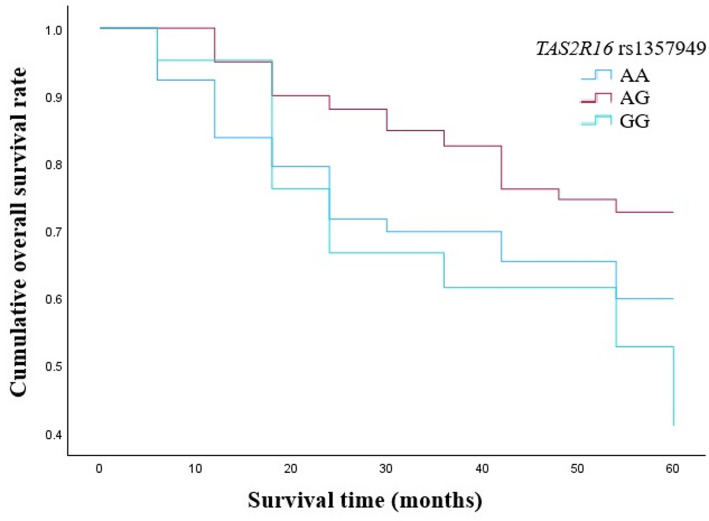 Figure 12
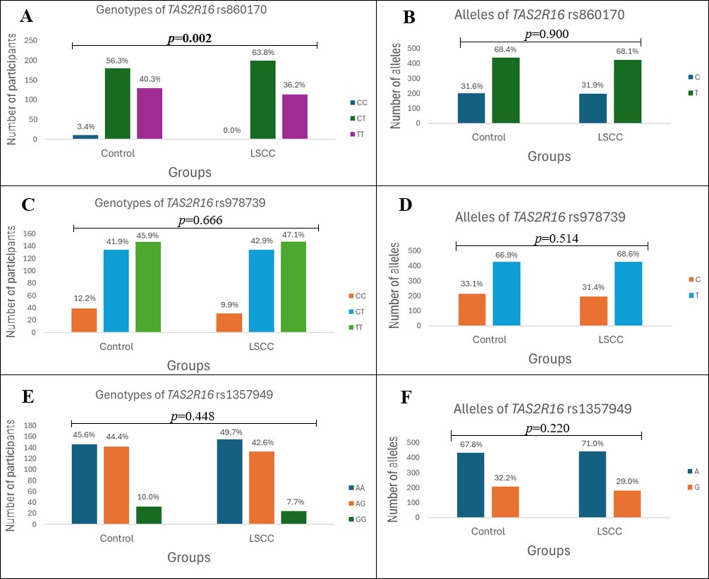 Figure 1
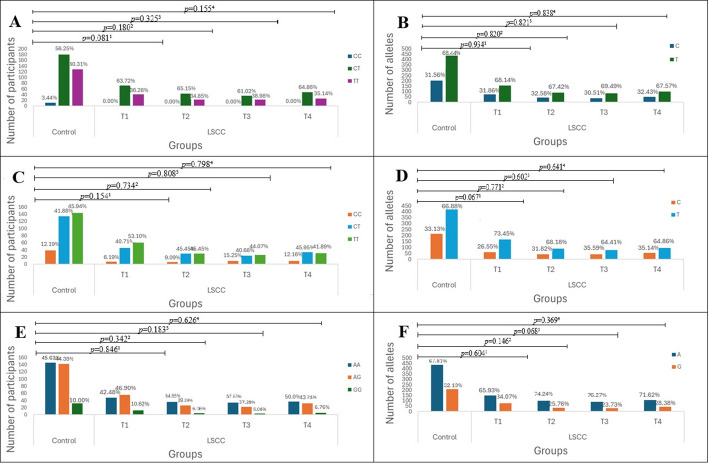 Figure 2
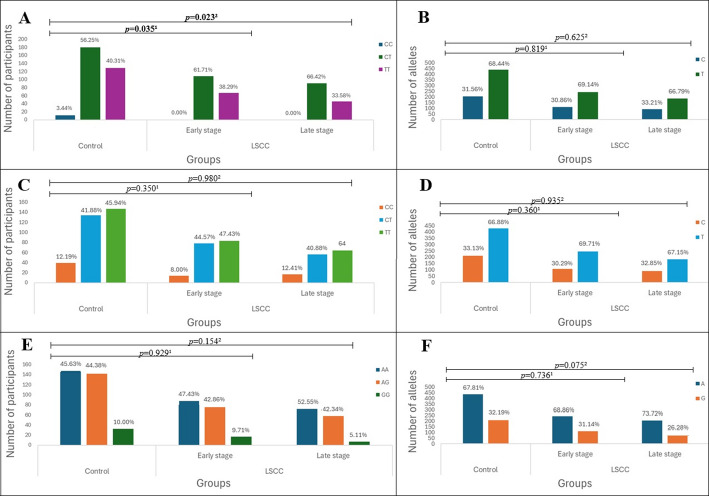 Figure 3
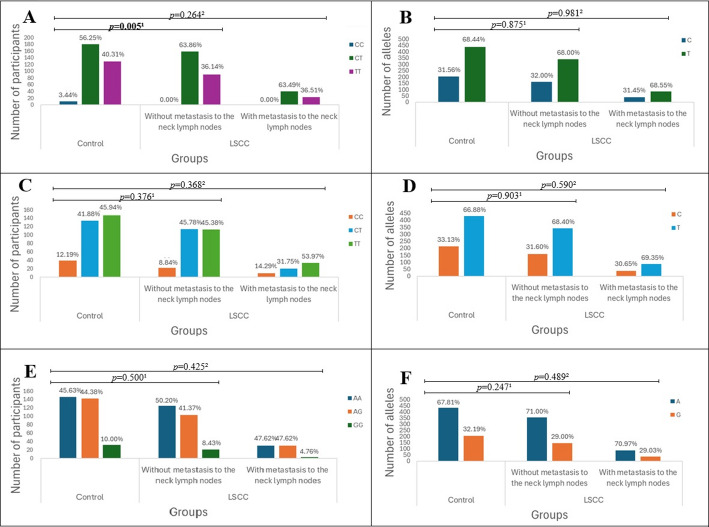 Figure 4
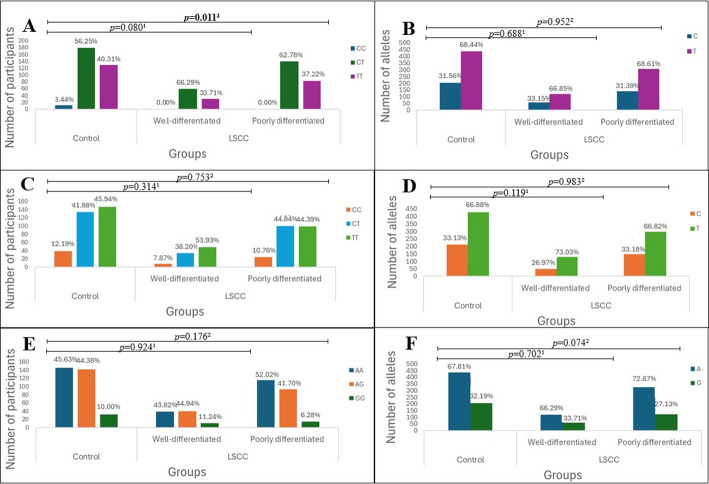 Figure 5
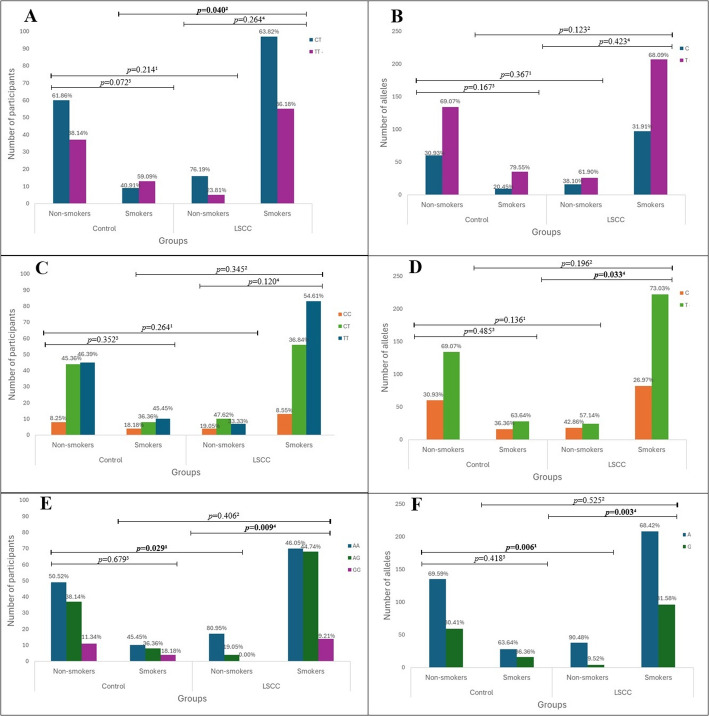 Figure 6
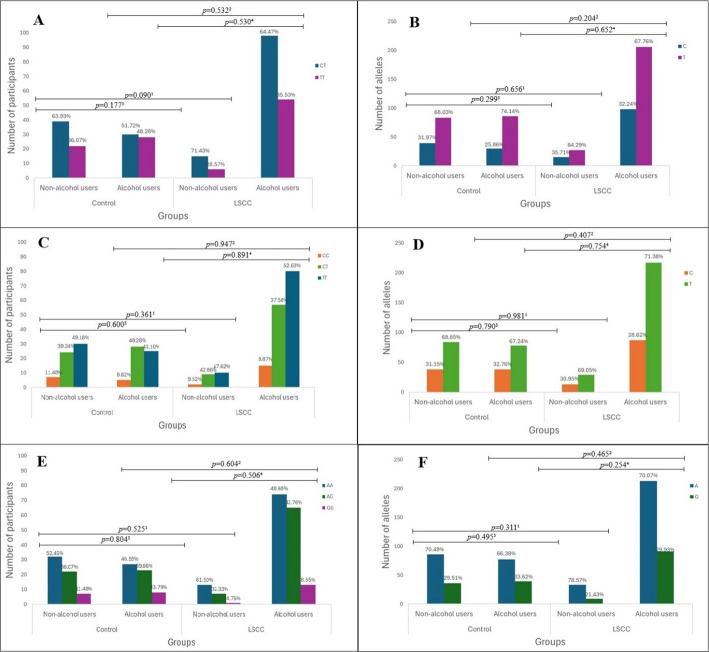 Figure 7
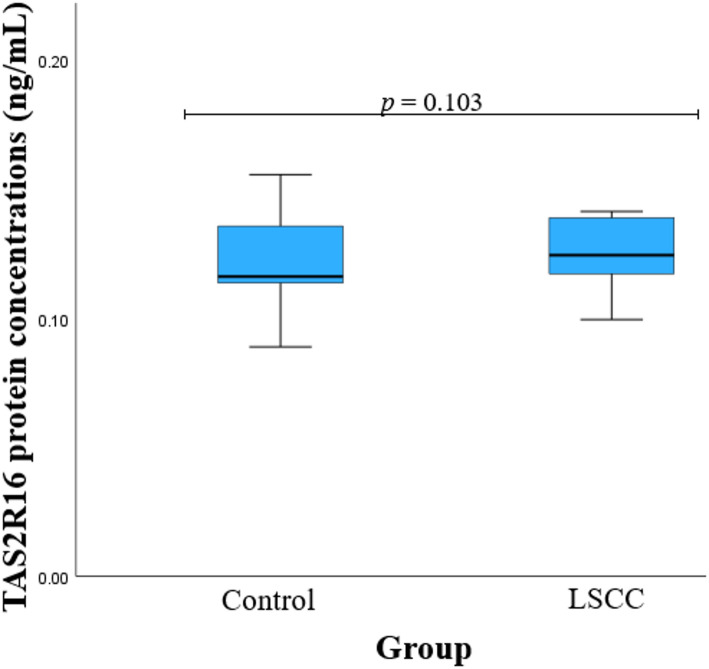 Figure 8
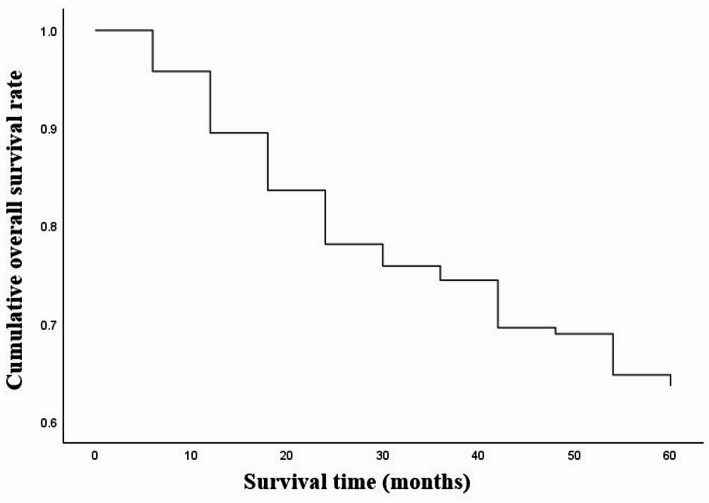 Figure 9
- —https://doi.org/10.13039/501100004504Lietuvos Mokslo Taryba
Peer Reviews
No public reviews on file for this paper yet. If you reviewed it on a platform where reviews are public (OpenReview, ICLR, NeurIPS, ICML), you can paste yours below so the community can read it here.
Videos
No videos yet. Explain this paper in a talk, walkthrough, or lecture? Add one.
Taxonomy
TopicsCancer-related molecular mechanisms research · Cancer-related gene regulation · RNA modifications and cancer
Introduction
Head and neck squamous cell carcinoma is the seventh most common cancer in the world, of which about 25% consists of laryngeal squamous cell carcinoma (LSCC) [1]. LSCC is the second most common malignancy of the respiratory tract tumor, after lung cancer [2]. Symptoms of the LSCC include hoarseness, sore throat, dysphagia, painful swallowing, otalgia, cough and expectoration of blood [3]. About 150,000 new LSCC cases are diagnosed worldwide every year [1]. The overall survival rate has not significantly improved despite continuous improvements in the diagnosis and treatment of laryngeal cancer because of the tumor’s enigmatic occurrence and high recurrence rate [4]. According to the European Cancer Information System 190 new cases of laryngeal cancer were identified in Lithuania in 2022, most of them were diagnosed in men (178 cases) [5]. In recent years, LSC) has shown novel epidemiological traits. The incidence rate of laryngeal cancer has increased among young people, especially those under 40 years old. This tendency may be brought on by variables including changing patterns of alcohol and tobacco use, rising HPV infection rates, and bad lifestyle choices [4]. The disease is characterized by a different clinical course, prognosis and treatment, depending on the site of onset in the larynx [2]. The most favorable clinical course of LSCC was determined for the tumor that appeared in the vocal cords, due to the weak lymph flow and rarely detected metastases in regional neck lymph nodes [6]. Based on data from the Surveillance, Epidemiology, and End Results Program, the five-year relative survival rate for cancer that develops in the vocal cords is approximately 77% [7]. While the laryngeal supraglottis and subglottis regions have a rich lymphatic network, cancer in these areas is more likely to result in metastases to the regional lymph nodes [6]. The occurrence of LSCC is influenced by risk factors [8]. According to the American Cancer Society, risk factors such as gastroesophageal reflux, Plummer-Vinson syndrome, genetic inheritance, exposure to chemicals, asbestos, nickel or ionizing radiation, and some viral infections are associated with the development of laryngeal cancer [9]. Also, it has been proven that tobacco smoking and alcohol consumption play an important role in the carcinogenesis of this tumor [10]. Inflammation signaling pathways and xenobiotic metabolizing enzymes may contribute to carcinogenesis and malignant transformation by regulating the cell cycle, cell survival, angiogenesis, and invasiveness. Genetic variations, such as single nucleotide polymorphisms (SNPs), can significantly impact carcinogenesis by altering the normal function of proteins encoded by genes involved in these cellular mechanisms [11]. Bitter taste receptors (TAS2Rs) play a significant role in human health, and the factors determining their ligand specificity remain largely unclear [12]. TAS2Rs are part of the G-protein-coupled receptor family, were first discovered in taste buds, and act as peripheral receptors for bitter stimuli. Recent research has revealed that TAS2Rs are also expressed in various extra-gustatory tissues, such as the respiratory tract, gastrointestinal mucosa, urethra, heart, and gingiva. Activation of TAS2Rs can inhibit the production of inflammatory mediators induced by lipopolysaccharide (LPS) in both human whole blood and lung macrophages, indicating a potential role for TAS2Rs in regulating inflammation tightly [13]. TAS2R16 is one of the best-studied bitter taste receptors at the molecular and population level [14]. The receptor-mediated response to beta-glucopyranosides is mediated by the gene of TAS2R16, which is part of the TAS2R family [15]. TAS2R16 is not so widely studied, most polymorphisms of this gene are used in population studies, determining the change of protein functions or the effects of evolution [16, 17]. Numerous research has been carried out to investigate the role of taste receptor genes in innate immunity, ranging from cell culture tests to human and animal studies [15]. Several single nucleotide polymorphisms (SNPs) of the TAS2R16 are considered risk factors for alcohol dependence [12] or associated with longevity [18]. There are at least 17 polymorphisms in human TAS2R16 alone, that are related to alcohol dependency [12]. Additionally, TAS2R16 genetic variations have been linked to African Americans developing nicotine dependency [19]. We aim to investigate the influence of TAS2R16 gene polymorphisms on the occurrence of LSCC, as these variants are associated with alcohol and nicotine dependence – significant risk factors for the development of this disease. Finding more effective targets for both prediction and therapy is therefore urgently needed. However, data examining the relationships between TAS2R16 polymorphisms and the pure group of LSCC patients, as well as the effect on the survival rate of patients, are still lacking. By analyzing TAS2R16 gene SNPs, we seek to understand their potential role in predisposing individuals to LSCC, given the established link between alcohol consumption and increased cancer risk and also evaluate the five years survival rates.
Materials and methods
Study design and structure
From 2009 to 2024, this case-control research was carried out at the Lithuanian University of Health Sciences (LUHS), Kaunas, Lithuania, at the Department of Otorhinolaryngology and LUHS, Kaunas, Lithuania, Neuroscience institute, Laboratory of Ophthalmology. The Kaunas Regional Biomedical Research Ethics Committee gave its approval to the research protocol (BE-2-37), date of issue: 25 March 2019. Every method used in the study complied with the Declaration of Helsinki and its later revisions, the institution’s ethical guidelines, or comparable ethical standards. Every participant in the research gave their informed permission.
Our study involved 632 individuals divided into control (n = 320) and patients with LSCC (n = 312) groups. The LSCC patient group consisted of 312 men with an average age of 61.3 years. The control group consisted of 320 men with an average age of 61.6 years. When comparing the groups of subjects according to age, we did not find statistically significant differences (p = 0.081). However, during the study, we collected information about the lifestyle habits of individuals. We gathered data from 173 LSCC patients and 119 healthy individuals. In the LSCC group, smokers and alcohol drinkers accounted for 87.9% of each group, while in the healthy group, smokers consisted of 18.5% and alcohol drinkers – 49.7%. Demographic data of the subjects are presented in Table 1.
Table 1. Demographic dataCharacteristicsLSCC group, n = 312Control group, n = 320p-valueAge median (IQR)62 (10)64 (9)0.081*Smoking habits, n (%) Smokers Non-smokers152 (87.9)22 (18.5)21 (22.1)97 (81.5)Alcohol consumption, n (%) Drinkers Non-drinkers152 (87.9)58 (49.7)21 (22.1)61 (51.3)Stage, n (%) I II III IV109 (34.9)66 (21.2)53 (17.0)84 (26.9)Tumor size (T), n (%) 1 2 3 4113 (36.2)66 (21.2)59 (18.9)74 (23.7)Metastasis to the neck lymph nodes (N), n (%) 0 1 2 3250 (80.1)19 (6.1)40 (12.8)3 (1.0)Distant metastasis (M), n (%) 0 1308 (98.7)4 (1.3) Tumor cell differentiation grade (G), n (%) 1 2 389 (28.5)198 (63.5)25 (8)LSCC – laryngeal squamous cell carcinoma; p-value – significance level and Bonferroni corrected significance level when p = 0.05/3
Control group
Patients who were consulted in the Department of Otorhinolaryngology, LUHS, and scheduled for surgical treatment (tympanoplasty, ossiculoplasty, tympanostomy, nasal bone reposition septoplasty, rhinoseptoplasty, uvulopalatopharyngoplasty, or radiofrequency thermoablation of the soft palate) were enrolled into the present study. Additionally, the inclusion criteria for the control group: those above the age of 18; signed a document requesting informed consent. The exclusion criteria for the control group: chronic infectious and non-infectious diseases (diabetes mellitus, malignant tumors, systemic connective tissue disorders, hypertension, coronary artery disease, stroke, or problems after organ or tissue transplantation are examples of systemic illnesses); use of sedatives or antiepileptic medications; subjects younger than 18 years of age.
LSCC group
The inclusion criteria for the LSCC group: those above the age of 18; pathologist-confirmed diagnosis of LSCC. All patients with suspected LSCC underwent a thorough otorhinolaryngological examination at the Department of Otorhinolaryngology’s Outpatient Office, which included flexible endoscopy and/or video laryngostroboscopy. A biopsy and direct micro laryngoscopy were performed on each patient. The LUHS Department of Pathology verified the histopathological diagnosis of LSCC. The final LSCC diagnosis with staging was established by doing neck and laryngeal computed tomography (CT) scans or magnetic resonance imaging (MRIs). The National Comprehensive Cancer Network (NCCN)-accepted Guidelines for Head and Neck Cancers Classification, Version 2.2020, were used in the staging of LSCC [20]. The exclusion criteria for the LSCC group: those with another type and location of cancer; those with acute or chronic infectious diseases; those taking psychomotor suppressants and antiepileptic medications; those under the age of 18. However, The Lithuanian State Register of Death Cases and Their Causes, Institute of Hygiene, Vilnius, provided the LSCC group statistics on the death rate, including the survival period following LSCC diagnosis.
Sample collection and DNA extraction
Peripheral venous blood samples from these patients were collected in ethylenediaminetetraacetic acid (EDTA) containing vacutainer tubes for DNA extraction and vacutainer tubes without any anticoagulants for protein measurements. The tube with EDTA was stored in a freezer at − 80 °C until extraction of the DNA, while the tubes without any anticoagulants were kept for 30 min at room temperature, in a vertical position, then centrifuged for 10 min with 1900 Relative Centrifugal Force (RCF). Following that, the vacuum tube’s blood serum was aspirated into a sterile Eppendorf tube and kept in a freezer at -80 °C until it was needed for the study.
DNA extraction was carried out in the Neuroscience Institute’s Ophthalmology Laboratory at the Lithuanian University of Health Sciences. The DNA salting-out technique was used to extract DNA samples from venous blood. The salting-out method was performed according to previous study [21].
Genotyping
TAS2R16 rs860170, rs978739, rs1357949 SNPs were identified using TaqMan^®^ genotyping assays (Thermofisher Scientific, Pleasanton, CA, USA). A Step One Plus real-time polymerase chain reaction (RT-PCR) system (Applied Biosystems, Foster City, CA, USA) was used to genotype TAS2R16 rs860170, rs978739, and rs1357949 in accordance with the manufacturer’s instructions. The RT-PCR was conducted using the Allelic discrimination program. The program used the fluorescence intensity of the several detectors (VIC and FAM) to determine the specific genotypes of each SNP. To verify the same rate of genotypes from the initial and recurrent genotyping, 5% of randomly chosen samples were genotyped for each of the SNPs.
Protein concentration measurement
Twenty-three LSCC patients and twenty control subjects had their serum TAS2R16 levels measured. A commercially available enzyme-linked immunosorbent assay (ELISA) kit for human TAS2R16 (Abbexa LTD; Cambridge, UK) was used to measure the protein TAS2R16 concentration in LSCC patients. Following the manufacturer’s instructions, a microplate reader (Multiskan FC microplate photometer, Thermo Scientific, Waltham, MA, USA) was used to measure optical density right away at a wavelength of 450 nm. The standard curve, which has a sensitivity of < 0.1 ng/mL and a sensibility range of 0.312 to 20 ng/mL, was used to compute the TAS2R16 level.
Statistical analysis
Statistical analysis was performed with IBM SPSS Statistics 29.0.1.0 software (IBM Corp, Armonk, NY, USA). Age of the patients and protein TAS2R16 concentration were presented as median with interquartile range (IQR). Using the Mann-Whitney U test, data that were not normally distributed between the two groups or subgroups were compared. The distribution of TAS2R16 rs860170, rs978739, and rs1357949 was compared between the LSCC groups and the control group using the chi square (χ2) test. To assess the impact of genotypes on the onset of LSCC, we also conducted binary logistic regression analysis, yielding odds ratios (OR) and 95% confidence intervals (CI). The Akaike information criterion (AIC) was used to choose the most suitable genetic model. The AIC states that the best inheritance model is the one with the lowest value. Since we looked at three SNPs in the TAS2R16 gene, we changed our significance threshold for multiple comparisons to alpha = 0.017 (0.05/3), and we defined statistically significant changes as those with p < 0.05. The Life-Table approach was used to analyze the survival rates of LSCC patients. Gehan’s criteria was used to compare survival rates across various genotypes of selected SNPs.
Results
Influence of TAS2R16 rs860170, rs978739, rs1357949 SNPs on the development of LSCC
After analyzing the distribution of SNP genotypes and alleles, we found that the distribution of TT, CT, and CC genotypes of the TAS2R16 rs860170 was statistically significantly different in LSCC patients compared to the control group (36.2%, 63.8%, and 0% vs. 40.3%, 56.3%, and 3.4%, p = 0.002) (Fig. 1).
Fig. 1 Genotype and allele frequencies of TAS2R16 in patients with LSCC and controls. A and B genotype and allele distributions of TAS2R16 rs860170. C and D – genotype and allele distributions of TAS2R16 rs978739. E and F – genotype and allele distributions of TAS2R16 rs1357949. LSCC – laryngeal squamous cell carcinoma; p-value – significance level and Bonferroni corrected significance level when p = 0.05/3; the bolded results indicate significant differences between the groups
Also, a binomial logistic regression analysis was performed to evaluate the influence of TAS2R16 SNPs on the development of LSCC, but statistically significant associations were not found (Table 2).
Table 2. Binomial logistic regression analysis of TAS2R16 (rs860170, rs978739, rs1357949) in patients with LSCC and controlsModelGenotype/alleleOR (95% CI)p–valueAICTAS2R16 rs860170 CodominantCT vs. TTCC vs. TT1.262 (0.914–1.744)–0.158–862.877 DominantCC + CT vs. TT1.189 (0.863–1.640)0.290876.915 OverdominantCT vs. TT + CC1.370 (0.995–1.885)0.054874.298 RecessiveCC vs. CT + TT––– AdditiveC1.025 (0.758–1.386)0.873878.011TAS2R16 rs978739 CodominantCT vs. TTCC vs. TT1.000 (0.718–1.392)0.795 (0.471–1.342)1.0000.391879.222 DominantCC + CT vs. TT0.954 (0.698–1.304)0.767877.949 OverdominantCT vs. TT + CC1.045 (0.762–1.433)0.785877.962 RecessiveCC vs. CT + TT0.795 (0.482–1.310)0.368877.222 AdditiveC0.927 (0.734–1.169)0.521877.624TAS2R16 rs1357949 CodominantAG vs. AAGG vs. AA0.882 (0.636–1.224)0.706 (0.397–1.256)0.4530.237878.428 DominantGG + AG vs. AA0.850 (0.622–1.162)0.308876.995 OverdominantAG vs. AA + GG0.931 (0.680–1.276)0.658877.841 RecessiveGG vs. AG + AA0.750 (0.431–1.305)0.309876.991 AdditiveG0.857 (0.672–1.093)0.857876.493OR – odds ratio, AIC – Akaike information criteria; the underlined AIC value indicates the best genetic model; CI – confidence interval; p-value – significance level; Bonferroni corrected significance level when p = 0.05/3
Associations of TAS2R16 rs860170, rs978739, rs1357949 SNPs with the clinical features of LSCC patients
Based on the clinical characteristics of LSCC, patients were categorized into four subgroups according to tumor size: T1, T2, T3, and T4. The frequencies of TAS2R16 rs860170, rs978739, and rs1357949 genotypes and alleles were compared between patients with different LSCC sizes and control groups (Fig. 2).
Fig. 2. Genotype and allele frequencies of TAS2R16 (rs860170, rs978739, rs1357949) in LSCC patients with different tumour sizes and in controls. A – genotype distribution of TAS2R16 rs860170; B – allele distribution of TAS2R16 rs860170; C – genotype distribution of TAS2R16 rs978739; D – allele distribution of TAS2R16 rs978739; E – genotype distribution of TAS2R16 rs1357949; F – allele distribution of TAS2R16 rs1357949. LSCC – laryngeal squamous cell carcinoma; p-value – significance level and Bonferroni corrected significance level when p = 0.05/3; p-value^1^ – control group vs. LSCC patients with T1 tumour size; p-value^2^ – control group vs. LSCC patients with T2 tumour size; p-value^3^ – control group vs. LSCC patients with T3 tumour size; p-value^4^ – control group vs. LSCC patients with T4 tumour size
Also, the binomial logistic regression analysis was performed with different tumour sizes. No statistically significant results were found (Tables 3, 4, 5 and 6).
Table 3. Binomial logistic regression analysis of TAS2R16 (rs860170, rs978739, rs1357949) in LSCC patients with T1 tumour size and in controlsModelGenotype/alleleOR (95% CI)p–valueAICTAS2R16 rs860170 CodominantCT vs. TTCC vs. TT1.259 (0.806–1.964)–0.311–493.355 DominantCC + CT vs. TT1.186 (0.761–1.849)0.451498.572 OverdominantCT vs. TT + CC1.366 (0.877–2.126)0.167497.211 RecessiveCC vs. CT + TT––– AdditiveC1.021 (0.682–1.528)0.919499.133TAS2R16 rs978739 CodominantCT vs. TTCC vs. TT0.841 (0.536–1.319)0.440 (0.186–1.038)0.4510.061497.080 DominantCC + CT vs. TT0.751 (0.488–1.154)0.191497.429 OverdominantCT vs. TT + CC0.953 (0.616–1.474)0.829499.097 RecessiveCC vs. CT + TT0.476 (0.206–1.097)0.081495.651 AdditiveC0.737 (0.527–1.029)0.073495.830TAS2R16 rs1357949 CodominantAG vs. AAGG vs. AA1.135 (0.721–1.787)1.141 (0.545–2.389)0.5840.727450.808 DominantGG + AG vs. AA1.136 (0.737–1.752)0.563498.809 OverdominantAG vs. AA + GG1.107 (0.720–1.703)0.643498.929 RecessiveGG vs. AG + AA1.069 (0.530–2.156)0.851499.109 AdditiveG1.091 (0.788–1.510)0.600498.869OR – odds ratio, AIC – Akaike information criteria; the underlined AIC value indicates the best genetic model; CI – confidence interval; p-value – significance level; Bonferroni corrected significance level when p = 0.05/3
Table 4. Binomial logistic regression analysis of TAS2R16 (rs860170, rs978739, rs1357949) in LSCC patients with T2 tumour size and in controlsModelGenotype/alleleOR (95% CI)p–valueAICTAS2R16 rs860170 CodominantCT vs. TTCC vs. TT1.340 (0.770–2.333)–0.301–351.866 DominantCC + CT vs. TT1.263 (0.726–2.196)0.409354.454 OverdominantCT vs. TT + CC1.454 (0.837–2.526)0.184353.341 RecessiveCC vs. CT + TT––– AdditiveC1.073 (0.655–1.757)0.780355.069TAS2R16 rs978739 CodominantCT vs. TTCC vs. TT1.097 (0.628–1.916)0.754 (0.293–1.939)0.7450.558356.502 DominantCC + CT vs. TT1.020 (0.599–1.736)0.943355.141 OverdominantCT vs. TT + CC1.157 (0.679–1.971)0.592354.861 RecessiveCC vs. CT + TT0.721 (0.292–1.779)0.477354.608 AdditiveC0.944 (0.636–1.401)0.775355.065TAS2R16 rs1357949 CodominantAG vs. AAGG vs. AA0.743 (0.426–1.293)0.507 (0.168–1.525)0.2930.227354.924 DominantGG + AG vs. AA0.699 (0.411–1.190)0.188353.402 OverdominantAG vs. AA + GG0.815 (0.474–1.399)0.458354.591 RecessiveGG vs. AG + AA0.581 (0.198–1.701)0.322354.039 AdditiveG0.727 (0.473–1.116)0.145352.938OR – odds ratio, AIC – Akaike information criteria; the underlined AIC value indicates the best genetic model; CI – confidence interval; p-value – significance level; Bonferroni corrected significance level when p = 0.05/3
Table 5. Binomial logistic regression analysis of TAS2R16 (rs860170, rs978739, rs1357949) in LSCC patients with T3 tumour size and in controlsModelGenotype/alleleOR (95% CI)p–valueAICTAS2R16 rs860170 CodominantCT vs. TTCC vs. TT1.122 (0.634–1.983)–0.693–327.838 DominantCC + CT vs. TT1.057 (0.599–1.867)0.848329.741 OverdominantCT vs. TT + CC1.217 (0.690–2.148)0.497329.312 RecessiveCC vs. CT + TT––– AdditiveC0.930 (0.556–1.556)0.783329.702TAS2R16 rs978739 CodominantCT vs. TTCC vs. TT1.013 (0.555–1.849)1.305 (0.565–3.011)0.9670.533331.371 DominantCC + CT vs. TT1.078 (0.617–1.886)0.791329.707 OverdominantCT vs. TT + CC0.952 (0.541–1.675)0.864329.748 RecessiveCC vs. CT + TT1.297 (0.592–2.843)0.516329.372 AdditiveC1.108 (0.744–1.651)0.613329.524TAS2R16 rs1357949 CodominantAG vs. AAGG vs. AA0.665 (0.371–1.193)0.403 (0.116–1.392)0.1710.151328.230 DominantGG + AG vs. AA0.617 (0.352–1.081)0.092326.899 OverdominantAG vs. AA + GG0.745 (0.421–1.320)0.314328.747 RecessiveGG vs. AG + AA0.482 (0.143–1.629)0.240328.132 AdditiveG0.651 (0.410–1.032)0.068326.245OR – odds ratio, AIC – Akaike information criteria; the underlined AIC value indicates the best genetic model; CI – confidence interval; p-value – significance level; Bonferroni corrected significance level when p = 0.05/3
Table 6. Binomial logistic regression analysis of TAS2R16 (rs860170, rs978739, rs1357949) in LSCC patients with T4 tumour size and in controlsModelGenotype/alleleOR (95% CI)p–valueAICTAS2R16 rs860170 CodominantCT vs. TTCC vs. TT1.323 (0.780–2.244)–0.299–378.891 DominantCC + CT vs. TT1.247 (0.736–2.112)0.412381.955 OverdominantCT vs. TT + CC1.436 (0.849–2.429)0.178380.781 RecessiveCC vs. CT + TT––– AdditiveC1.062 (0.663–1.702)0.801382.574TAS2R16 rs978739 CodominantCT vs. TTCC vs. TT1.203 (0.701–2.065)1.094 (0.481–2.489)0.5020.830384.186 DominantCC + CT vs. TT1.179 (0.707–1.966)0.529382.239 OverdominantCT vs. TT + CC1.180 (0.710–1.961)0.524382.232 RecessiveCC vs. CT + TT0.998 (0.460–2.162)0.995382.637 AdditiveC1.090 (0.754–1.574)0.648382.430TAS2R16 rs1357949 CodominantAG vs. AAGG vs. AA0.889 (0.525–1.506)0.617 (0.225–1.691)0.6620.348383.647 DominantGG + AG vs. AA0.839 (0.506–1.392)0.497382.176 OverdominantAG vs. AA + GG0.955 (0.573–1.591)0.860382.606 RecessiveGG vs. AG + AA0.652 (0.245–1.735)0.392381.838 AdditiveG0.831 (0.558–1.239)0.363381.797OR – odds ratio, AIC – Akaike information criteria; the underlined AIC value indicates the best genetic model; CI – confidence interval; p-value – significance level; Bonferroni corrected significance level when p = 0.05/3
Based on the stages of the LSCC, patients were categorized into early and late stages. The results showed that the distribution of TT, CT, and CC genotypes of TAS2R16 rs860170 is statistically significantly different in both early-stage and late-stage LSCC patients compared to the control group (38.29%, 61.71%, and 0.00% vs. 40.31%, 56.25%, and 3.44%, p = 0.035, 33.58%, 66.42%, and 0.00% vs. 40.31%, 56.25%, and 3.44%, p = 0.023, respectively). When we applied Bonferroni’s corrected significance threshold, these results did not reach statistical significance. (Fig. 3).
Fig. 3. Genotype and allele frequencies of TAS2R16 (rs860170, rs978739, rs1357949) in LSCC patients and controls according to the stage of the LSCC. A – genotype distribution of TAS2R16 rs860170; B – allele distribution of TAS2R16 rs860170; C – genotype distribution of TAS2R16 rs978739; D – allele distribution of TAS2R16 rs978739; E – genotype distribution of TAS2R16 rs1357949; F – allele distribution of TAS2R16 rs1357949; LSCC – laryngeal squamous cell carcinoma; p-value – significance level and Bonferroni corrected significance level when p = 0.05/3; p-value^1^ – control group vs. early-stage LSCC patients; p-value^2^ – control group vs. late-stage LSCC patients; the bolded results indicate significant differences between the groups
Binomial logistic regression analysis does not reveal statistically significant results in the early-stage group (Table 7).
Table 7. Binomial logistic regression analysis of TAS2R16 (rs860170, rs978739, rs1357949) in early-stage LSCC patients and controlsModelGenotype/alleleOR (95% CI)p–valueAICTAS2R16 rs860170 CodominantCT vs. TTCC vs. TT1.155 (0.790–1.688)–0.456–636.821 DominantCC + CT vs. TT1.089 (0.746–1.589)0.659644.917 OverdominantCT vs. TT + CC1.254 (0.860–1.827)0.239643.717 RecessiveCC vs. CT + TT––– AdditiveC0.951 (0.670–1.348)0.776645.031TAS2R16 rs978739 CodominantCT vs. TTCC vs. TT1.031 (0.700–1.519)0.636 (0.326–1.239)0.8780.183644.926 DominantCC + CT vs. TT0.942 (0.651–1.363)0.751645.011 OverdominantCT vs. TT + CC1.116 (0.770–1.619)0.562644.776 RecessiveCC vs. CT + TT0.627 (0.330–1.189)0.153642.950 AdditiveC0.879 (0.665–1.162)0.365644.285TAS2R16 rs1357949 CodominantAG vs. AAGG vs. AA0.929 (0.630–1.370)0.934 (0.489–1.785)0.7100.837646.936 DominantGG + AG vs. AA0.930 (0.643–1.346)0.700644.964 OverdominantAG vs. AA + GG0.940 (0.648–1.364)0.745645.006 RecessiveGG vs. AG + AA0.968 (0.521–1.799)0.919645.101 AdditiveG0.952 (0.718–1.263)0.735644.996OR – odds ratio, AIC – Akaike information criteria; the underlined AIC value indicates the best genetic model; CI – confidence interval; p-value – significance level; Bonferroni corrected significance level when p = 0.05/3
Binomial logistic regression analysis revealed that TAS2R16 rs860170 CT genotype is associated with 1.5-fold increase odds of developing late-stage LSCC under the overdominant model (OR = 1.539, 95% CI: 1.013–2.336, p = 0.043), although, this result does not survive Bonferroni correction (Table 8).
Table 8. Binomial logistic regression analysis of TAS2R16 (rs860170, rs978739, rs1357949) in late-stage LSCC patients and controlsModelGenotype/alleleOR (95% CI)p–valueAICTAS2R16 rs860170 CodominantCT vs. TTCC vs. TT1.418 (0.931–2.159)–0.104–551.516 DominantCC + CT vs. TT1.336 (0.879–2.032)0.175558.299 OverdominantCT vs. TT + CC1.539 (1.013–2.336) 0.043 555.990 RecessiveCC vs. CT + TT––– AdditiveC1.126 (0.770–1.647)0.540559.785TAS2R16 rs978739 CodominantCT vs. TTCC vs. TT0.960 (0.625–1.473)1.001 (0.528–1.900)0.8510.997562.121 DominantCC + CT vs. TT0.969 (0.649–1.448)0.879560.137 OverdominantCT vs. TT + CC0.960 (0.639–1.441)0.843560.121 RecessiveCC vs. CT + TT1.021 (0.556–1.876)0.947560.156 AdditiveC0.988 (0.738–1.324)0.937560.154TAS2R16 rs1357949 CodominantAG vs. AAGG vs. AA0.828 (0.546–1.255)0.444 (0.187–1.054)0.3740.066558.155 DominantGG + AG vs. AA0.758 (0.507–1.131)0.175558.315 OverdominantAG vs. AA + GG0.920 (0.614–1.379)0.687559.998 RecessiveGG vs. AG + AA0.485 (0.208–1.127)0.092556.946 AdditiveG0.743 (0.538–1.026)0.071556.825OR – odds ratio, AIC – Akaike information criteria; the underlined AIC value indicates the best genetic model; CI – confidence interval; p-value – significance level; Bonferroni corrected significance level when p = 0.05/3; the bolded results indicate significant differences between the groups
The impact of the selected SNPs on LSCC progression was analyzed by categorizing LSCC patients based on the presence of regional lymph node metastasis: patients without metastasis (N0) and those with metastasis to neck lymph nodes (N1-N3). A statistically significant difference was observed in the distribution of TT, CT, and CC genotypes of TAS2R16 rs860170 between LSCC patients without metastasis and the control group (36.14%, 63.86%, and 0.00% vs. 40.31%, 56.25%, and 3.44%, p = 0.005) (Fig. 4).
Fig. 4. Genotype and allele frequencies of TAS2R16 (rs860170, rs978739, rs1357949) in LSCC patients and controls according to metastasis to the neck lymph nodes. A – genotype distribution of TAS2R16 rs860170; B – allele distribution of TAS2R16 rs860170; C – genotype distribution of TAS2R16 rs978739; D – allele distribution of TAS2R16 rs978739; E – genotype distribution of TAS2R16 rs1357949; F – allele distribution of TAS2R16 rs1357949; LSCC – laryngeal squamous cell carcinoma; p-value – significance level and Bonferroni corrected significance level when p = 0.05/3; p-value^1^ – control group vs. LSCC patients without metastasis; p-value^2^ – control group vs. LSCC patients with metastasis; the bolded results indicate significant differences between the groups
Binomial logistic regression analysis of rs860170, rs978739, and rs1357949 SNPs in LSCC patients without and with neck lymph node metastases and controls did not reveal any statistically significant results (Tables 9 and 10).
Table 9. Binomial logistic regression analysis of TAS2R16 (rs860170, rs978739, rs1357949) in LSCC patients without metastasis to the neck lymph nodes and in controlsModelGenotype/alleleOR (95% CI)p–valueAICTAS2R16 rs860170 CodominantCT vs. TTCC vs. TT1.274 (0.904–1.796)–0.167–770.779 DominantCC + CT vs. TT1.201 (0.853–1.689)0.294782.464 OverdominantCT vs. TT + CC1.383 (0.984–1.942)0.062780.054 RecessiveCC vs. CT + TT––– AdditiveC1.033 (0.751–1.420)0.842783.530TAS2R16 rs978739 CodominantCT vs. TTCC vs. TT1.097 (0.773–1.556)0.727 (0.408–1.295)0.6040.280783.589 DominantCC + CT vs. TT1.014 (0.727–1.413)0.936783.563 OverdominantCT vs. TT + CC1.164 (0.834–1.624)0.374782.778 RecessiveCC vs. CT + TT0.695 (0.401–1.206)0.196781.858 AdditiveC0.933 (0.727–1.198)0.587783.274TAS2R16 rs1357949 CodominantAG vs. AAGG vs. AA0.840 (0.593–1.190)0.760 (0.417–1.385)0.3280.371784.182 DominantGG + AG vs. AA0.826 (0.593–1.150)0.258782.287 OverdominantAG vs. AA + GG0.878 (0.628–1.228)0.447782.992 RecessiveGG vs. AG + AA0.825 (0.463–1.470)0.514783.140 AdditiveG0.859 (0.665–1.110)0.246782.215OR – odds ratio, AIC – Akaike information criteria; the underlined AIC value indicates the best genetic model; CI – confidence interval; p-value – significance level; Bonferroni corrected significance level when p = 0.05/3
Table 10. Binomial logistic regression analysis of TAS2R16 (rs860170, rs978739, rs1357949) in LSCC patients with metastasis to the neck lymph nodes and in controlsModelGenotype/alleleOR (95% CI)p–valueAICTAS2R16 rs860170 CodominantCT vs. TTCC vs. TT1.215 (0.692–2.133)–0.497–338.386 DominantCC + CT vs. TT1.145 (0.653–2.008)0.636340.586 OverdominantCT vs. TT + CC1.319 (0.753–2.310)0.333339.861 RecessiveCC vs. CT + TT––– AdditiveC0.992 (0.599–1.644)0.976340.810TAS2R16 rs978739 CodominantCT vs. TTCC vs. TT0.665 (0.364–1.215)1.028 (0.454–2.328)0.1840.947340.766 DominantCC + CT vs. TT0.747 (0.433–1.288)0.294339.706 OverdominantCT vs. TT + CC0.661 (0.371–1.177)0.160338.771 RecessiveCC vs. CT + TT1.224 (0.560–2.674)0.613340.563 AdditiveC0.900 (0.603–1.342)0.605340.541TAS2R16 rs1357949 CodominantAG vs. AAGG vs. AA1.064 (0.607–1.863)0.472 (0.135–1.645)0.8290.239340.846 DominantGG + AG vs. AA0.955 (0.554–1.647)0.868340.784 OverdominantAG vs. AA + GG1.175 (0.682–2.026)0.561340.474 RecessiveGG vs. AG + AA0.458 (0.136–1.544)0.208338.892 AdditiveG0.857 (0.557–1.317)0.481340.307OR – odds ratio, AIC – Akaike information criteria; the underlined AIC value indicates the best genetic model; CI – confidence interval; p-value – significance level; Bonferroni corrected significance level when p = 0.05/3
The genotypes and alleles of TAS2R16 rs860170, rs978739, and rs1357949 were examined concerning the differentiation level of LSCC cells. Based on the patient’s clinical data, LSCC cell differentiation was categorized as well-differentiated (G1) and poorly differentiated (G2–G3). A statistically significant difference was identified in the distribution of TT, CT, and CC genotypes of TAS2R16 rs860170 between patients with poorly differentiated LSCC and the control group (37.22%, 62.78%, and 0.00% vs. 40.31%, 56.25%, 3.44%, p = 0.011) (Fig. 5).
Fig. 5. Genotype and allele frequencies of TAS2R16 (rs860170, rs978739, rs1357949) in LSCC patients and controls according to the differentiation of cancer cells. A – genotype distribution of TAS2R16 rs860170; B – allele distribution of TAS2R16 rs860170; C – genotype distribution of TAS2R16 rs978739; D – allele distribution of TAS2R16 rs978739; E – genotype distribution of TAS2R16 rs1357949; F – allele distribution of TAS2R16 rs1357949; LSCC – laryngeal squamous cell carcinoma; p-value – significance level and Bonferroni corrected significance level when p = 0.05/3; p-value^1^ – control group vs. LSCC patients with well-differentiated cancer cells; p-value^2^ – control group vs. LSCC patients with poorly differentiated cancer cells; the bolded results indicate significant differences between the groups
Binomial logistic regression analysis does not reveal any statistically significant results (Tables 11 and 12).
Table 11. Binomial logistic regression analysis of TAS2R16 (rs860170, rs978739, rs1357949) in LSCC patients with well-differentiated cells and in controlsModelGenotype/alleleOR (95% CI)p–valueAICTAS2R16 rs860170 CodominantCT vs. TTCC vs. TT1.409 (0.860–2.310)–0.174–423.144 DominantCC + CT vs. TT1.328 (0.811–2.175)0.259429.221 OverdominantCT vs. TT + CC1.530 (0.935–2.502)0.090427.575 RecessiveCC vs. CT + TT––– AdditiveC1.118 (0.719–1.737)0.620430.271TAS2R16 rs978739 CodominantCT vs. TTCC vs. TT0.777 (0.472–1.278)0.550 (0.231–1.309)0.3210.177430.120 DominantCC + CT vs. TT0.726 (0.453–1.163)0.183428.733 OverdominantCT vs. TT + CC0.858 (0.530–1.389)0.534430.126 RecessiveCC vs. CT + TT0.615 (0.265–1.427)0.258429.114 AdditiveC0.756 (0.526–1.085)0.129428.146TAS2R16 rs1357949 CodominantAG vs. AAGG vs. AA1.055 (0.641–1.735)1.170 (0.529–2.586)0.8340.698432.359 DominantGG + AG vs. AA1.076 (0.670–1.726)0.762430.425 OverdominantAG vs. AA + GG1.023 (0.638–1.641)0.924430.507 RecessiveGG vs. AG + AA1.139 (0.537–2.418)0.734430.403 AdditiveG1.072 (0.752–1.529)0.700430.368OR – odds ratio, AIC – Akaike information criteria; the underlined AIC value indicates the best genetic model; CI – confidence interval; p-value – significance level; Bonferroni corrected significance level when p = 0.05/3
Table 12. Binomial logistic regression analysis of TAS2R16 (rs860170, rs978739, rs1357949) in LSCC patients with poorly differentiated cells and controlsModelGenotype/alleleOR (95% CI)p–valueAICTAS2R16 rs860170 CodominantCT vs. TTCC vs. TT1.209 (0.849–1.721)–0.293–726.435 DominantCC + CT vs. TT1.139 (0.802–1.619)0.467736.807 OverdominantCT vs. TT + CC1.312 (0.924–1.862)0.128735.012 RecessiveCC vs. CT + TT––– AdditiveC0.987 (0.712–1.369)0.940737.331TAS2R16 rs978739 CodominantCT vs. TTCC vs. TT1.108 (0.771–1.594)0.914 (0.517–1.614)0.5800.756738.768 DominantCC + CT vs. TT1.064 (0.755–1.501)0.722737.210 OverdominantCT vs. TT + CC1.129 (0.799–1.593)0.492736.865 RecessiveCC vs. CT + TT0.869 (0.506–1.491)0.610737.075 AdditiveC1.003 (0.778–1.292)0.984737.336TAS2R16 rs1357949 CodominantAG vs. AAGG vs. AA0.824 (0.577–1.179)0.551 (0.281–1.080)0.2890.083735.788 DominantGG + AG vs. AA0.774 (0.549–1.090)0.143735.185 OverdominantAG vs. AA + GG0.897 (0.635–1.267)0.537736.954 RecessiveGG vs. AG + AA0.603 (0.314–1.158)0.129734.912 AdditiveG0.778 (0.593–1.021)0.070734.023OR – odds ratio, AIC – Akaike information criteria; the underlined AIC value indicates the best genetic model; CI – confidence interval; p-value – significance level; Bonferroni corrected significance level when p = 0.05/3
Associations of TAS2R16 rs860170, rs978739, rs1357949 SNPs with the lifestyle habits of LSCC patients
According to the smoking habits of the study subjects, all participants were divided into groups: smokers and non-smokers. Results showed that the distribution of the TAS2R16 rs860170 TT, CT, and CC genotypes was statistically significantly different between smoking controls and LSCC patients who smoked (59.09%, 40.91%, and 0.00% vs. 36.16%, 63.82%, and 0.00%, p = 0.040). TAS2R16 rs978739 C allele is more frequent in non-smokers than in smokers of the LSCC group (42.86% vs. 26.97%, p = 0.033), although these results do not survive Bonferroni correction. However, the analysis of genotype and allele distribution revealed that TAS2R16 rs1357949 AA, AG, and GG genotypes were statistically significantly different between non-smoking controls and non-smoking LSCC patients (50.52%, 38.14%, and 11.34% vs. 80.95%, 19.05%, and 0.00%, p = 0.029). Still, these results do not survive Bonferroni correction. Also, the distribution of these genotypes is statistically significantly different between non-smokers of the LSCC group and LSCC smokers (80.95%, 19.05%, and 0.00% vs. 46.05%, 44.74%, and 9.21%, p = 0.009). Results showed that the G allele of the TAS2R16 rs1357949 is less common in non-smokers of the LSCC group than the non-smokers of the control group (9.52% vs. 30.41%, p = 0.006). Results showed that the rs1357949 G allele is less frequent in the non-smokers than in the smokers LSCC group (9.52% vs. 31.58%, p = 0.003). When comparing the control group smokers with the LSCC group smokers, the distribution of the genotypes and alleles showed no statistically significant results. (Fig. 6).
Fig. 6. Genotype and allele frequencies of TAS2R16 (rs860170, rs978739, rs1357949) in LSCC patients and controls according to their smoking habits. A – genotype distribution of TAS2R16 rs860170; B – allele distribution of TAS2R16 rs860170; C – genotype distribution of TAS2R16 rs978739; D – allele distribution of TAS2R16 rs978739; E – genotype distribution of TAS2R16 rs1357949; F – allele distribution of TAS2R16 rs1357949; LSCC – laryngeal squamous cell carcinoma; p-value – significance level and Bonferroni corrected significance level when p = 0.05/3; the bolded results indicate significant differences between the groups; p-value^1^ – control group non-smokers vs. LSCC group non-smokers; p-value^2^ – control group smokers vs. LSCC group smokers; p-value^3^ - control group non-smokers vs. smokers; p-value^4^ – LSCC group non-smokers vs. smokers; the bolded results indicate significant differences between the groups
Binomial logistic regression analysis showed that TAS2R16 rs1357949 GG and AG genotypes together are associated with 4.2-fold decreased odds of developing LSCC in non-smoking patients under the dominant model (OR = 0.240, 95% CI: 0.075–0.766, p = 0.016). Also, each rs1357949 G allele was found to decrease the odds of LSCC occurrence in non-smokers by 3.8-fold under the additive model (OR = 0.262, 95% CI: 0.090–0.763, p = 0.014) (Table 13).
Table 13. Binomial logistic regression analysis of TAS2R16 (rs860170, rs978739, rs1357949) in non-smokers with LSCC and non-smoking controlsModelGenotype/alleleOR (95% CI)p–valueAICTAS2R16 rs860170 CodominantCT vs. TTCC vs. TT1.973 (0.667–5.837)–0.219–112.889 DominantCC + CT vs. TT1.973 (0.667–5.837)0.219110.889 OverdominantCT vs. TT + CC1.973 (0.667–5.837)0.219110.889 RecessiveCC vs. CT + TT––– AdditiveC1.973 (0.667–5.837)0.219110.889TAS2R16 rs978739 CodominantCT vs. TTCC vs. TT1.461 (0.511–4.181)3.214 (0.761–13.572)0.4800.112112.113 DominantCC + CT vs. TT1.731 (0.642–4.663)0.278111.298 OverdominantCT vs. TT + CC1.095 (0.426–2.818)0.851112.482 RecessiveCC vs. CT + TT2.618 (0.708–9.678)0.149110.619 AdditiveC1.718 (0.846–3.486)0.134110.276TAS2R16 rs1357949 CodominantAG vs. AAGG vs. AA0.312 (0.097–1.004)–0.051105.521 DominantGG + AG vs. AA0.240 (0.075–0.766) 0.016 105.510 OverdominantAG vs. AA + GG0.382 (0.119–1.222)0.105109.510 RecessiveGG vs. AG + AA––– AdditiveG0.262 (0.090–0.763) 0.014 104.136OR – odds ratio, AIC – Akaike information criteria; the underlined AIC value indicates the best genetic model; CI – confidence interval; p-value – significance level; Bonferroni corrected significance level when p = 0.05/3. The bolded results indicate significant differences between the groups
While binomial logistic regression analysis in smokers with LSCC patients and smoking controls showed that the TAS2R16 rs860170 CT genotype was found to increase the odds of developing LSCC in smokers by 2.5 times under the codominant and overdominant models, while the CT + CC models increase these odds by 2.5-fold under the dominant model, also each C allele increases these odds by 2.5 times (OR = 2.547, 95% CI: 1.023–6.342, p = 0.044 in all models). Although these results do not survive Bonferroni correction (Table 14).
Table 14. Binomial logistic regression analysis of TAS2R16 (rs860170, rs978739, rs1357949) in smokers with LSCC and smoking controlsModelGenotype/alleleOR (95% CI)p–valueAICTAS2R16 rs860170 CodominantCT vs. TTCC vs. TT2.547 (1.023–6.342)– 0.044 –131.963 DominantCC + CT vs. TT2.547 (1.023–6.342) 0.044 129.963 OverdominantCT vs. TT + CC2.547 (1.023–6.342) 0.044 129.963 RecessiveCC vs. CT + TT––– AdditiveC2.547 (1.023–6.342) 0.044 129.963TAS2R16 rs978739 CodominantCT vs. TTCC vs. TT0.843 (0.314–2.269)0.392 (0.107–1.435)0.7360.157134.261 DominantCC + CT vs. TT0.693 (0.282–1.700)0.423133.441 OverdominantCT vs. TT + CC1.021 (0.403–2.585)0.965134.084 RecessiveCC vs. CT + TT0.421 (0.124–1.431)0.166132.374 AdditiveC0.670 (0.354–1.268)0.219132.617TAS2R16 rs1357949 CodominantAG vs. AAGG vs. AA1.214 (0.452–3.261)0.500 (0.137–1.823)0.7000.294134.500 DominantGG + AG vs. AA0.976 (0.398–2.396)0.958134.083 OverdominantAG vs. AA + GG1.417 (0.561–3.575)0.461133.530 RecessiveGG vs. AG + AA0.457 (0.135–1.538)0.206132.649 AdditiveG0.807 (0.417–1.565)0.526133.689OR – odds ratio, AIC – Akaike information criteria; the underlined AIC value indicates the best genetic model; CI – confidence interval; p-value – significance level; Bonferroni corrected significance level when p = 0.05/3. The bolded results indicate significant differences between the groups
The analysis of non-smokers and smoking controls did not show any statistically significant results either (Table 15).
Table 15. Binomial logistic regression analysis of TAS2R16 (rs860170, rs978739, rs1357949) in non-smokers and smoking controlsModelGenotype/alleleOR (95% CI)p–valueAICTAS2R16 rs860170 CodominantCT vs. TTCC vs. TT0.427 (0.166–1.097)–0.077114.741 DominantCC + CT vs. TT0.427 (0.166–1.097)0.077112.741 OverdominantCT vs. TT + CC0.427 (0.166–1.097)0.077112.741 RecessiveCC vs. CT + TT––– AdditiveC0.427 (0.166–1.097)0.077112.741TAS2R16 rs978739 CodominantCT vs. TTCC vs. TT0.818 (0.296–2.265)2.250 (0.565–8.962)0.6990.250116.081 DominantCC + CT vs. TT1.038 (0.410–2.630)0.937115.925 OverdominantCT vs. TT + CC0.688 (0.265–1.791)0.444115.334 RecessiveCC vs. CT + TT2.472 (0.672–9.096)0.173114.231 AdditiveC1.279 (0.641–2.548)0.485115.449TAS2R16 rs1357949 CodominantAG vs. AAGG vs. AA1.059 (0.381–2.947)1.782 (0.471–6.745)0.9120.395117.217 DominantGG + AG vs. AA1.225 (0.484–3.101)0.668115.748 OverdominantAG vs. AA + GG0.927 (0.355–2.421)0.876115.907 RecessiveGG vs. AG + AA1.737 (0.497–6.077)0.387115.230 AdditiveG1.269 (0.664–2.425)0.471115.418OR – odds ratio, AIC – Akaike information criteria; the underlined AIC value indicates the best genetic model; CI – confidence interval; p-value – significance level; Bonferroni corrected significance level when p = 0.05/3
Results revealed that TAS2R16 rs978739 each C allele is associated with reduced odds of smoking for LSCC patients by 1.9-fold under the additive model (OR = 0.514, 95% CI: 0.269–0.983, p = 0.044), after applying Bonferroni’s corrected significance threshold, this result did not reach statistical significance. TAS2R16 rs1357949 AG genotype was found to increase the odds of smoking for LSCC patients by 4.2-fold under the codominant model (OR = 4.129, 95% CI: 1.321–12.898, p = 0.015), while GG and AG genotypes together increase these odds by 5 times under the dominant model (OR = 4.979, 95% CI: 1.600-15.488, p = 0.006). According to the overdominant model, AG genotype is associated with increased odds of smoking for the LSCC group (OR = 3.440, 95% CI: 1.106–10.705, p = 0.033), but this result does not survive after Bonferroni correction. However, each G allele increases the odds of the smoking habit for LSCC patients by 4.6-fold under the additive model (OR = 4.570, 95% CI: 1.553–13.447, p = 0.006) (Table 16).
Table 16. Binomial logistic regression analysis of TAS2R16 (rs860170, rs978739, rs1357949) in non-smokers and smoking LSCC patientsModelGenotype/alleleOR (95% CI)p–valueAICTAS2R16 rs860170 CodominantCT vs. TTCC vs. TT0.551 (0.191–1.586)–0.296–128.593 DominantCC + CT vs. TT0.551 (0.191–1.586)0.296128.593 OverdominantCT vs. TT + CC0.551 (0.191–1.586)0.296128.593 RecessiveCC vs. CT + TT––– AdditiveC0.551 (0.191–1.586)0.296128.593TAS2R16 rs978739 CodominantCT vs. TTCC vs. TT0.472 (0.170–1.315)0.274 (0.070–1.068)0.1510.062127.889 DominantCC + CT vs. TT0.416 (0.159–1.088)0.074126.523 OverdominantCT vs. TT + CC0.642 (0.256–1.606)0.343129.020 RecessiveCC vs. CT + TT0.397 (0.116–1.358)0.141127.992 AdditiveC0.514 (0.269–0.983) 0.044 125.934TAS2R16 rs1357949 CodominantAG vs. AAGG vs. AA4.129 (1.321–12.898)– 0.015 120.846 DominantGG + AG vs. AA4.979 (1.600–15.488) 0.006 120.305 OverdominantAG vs. AA + GG3.440 (1.106–10.705) 0.033 122.444 RecessiveGG vs. AG + AA––– AdditiveG4.570 (1.553–13.447) 0.006 119.205OR – odds ratio, AIC – Akaike information criteria; the underlined AIC value indicates the best genetic model; CI – confidence interval; p-value – significance level; Bonferroni corrected significance level when p = 0.05/3. The bolded results indicate significant differences between the groups
According to the alcohol consumption of the study subjects, all participants were divided into two groups: non-alcohol users and alcohol users. A comparison of genotype and allele distribution between alcohol drinkers in the control group and alcohol users in the LSCC group showed no statistically significant differences (Fig. 7).
Fig. 7. Genotype and allele frequencies of TAS2R16 (rs860170, rs978739, rs1357949) in LSCC patients and controls according to alcohol consumption. A – genotype distribution of TAS2R16 rs860170; B – allele distribution of TAS2R16 rs860170; C – genotype distribution of TAS2R16 rs978739; D – allele distribution of TAS2R16 rs978739; E – genotype distribution of TAS2R16 rs1357949; F – allele distribution of TAS2R16 rs1357949; LSCC – laryngeal squamous cell carcinoma; p-value – significance level and Bonferroni corrected significance level when p = 0.05/3; p-value^1^ – control group non-alcohol users vs. LSCC group non-alcohol users; p-value^2^ – control group alcohol users vs. LSCC group alcohol users; p-value^3^ - control group non-alcohol users vs. alcohol users; p-value^4^ – LSCC group non-alcohol users vs. alcohol users
Binomial logistic regression analysis of the rs860170, rs978739, and rs1357949 SNPs in LSCC patients who do not consume alcohol and in control subjects who do not use alcohol did not reveal any statistically significant results (Table 17).
Table 17. Binomial logistic regression analysis of TAS2R16 (rs860170, rs978739, rs1357949) in non-alcohol users LSCC patients and non-drinking alcohol controlsModelGenotype/alleleOR (95% CI)p–valueAICTAS2R16 rs860170 CodominantCT vs. TTCC vs. TT1.410 (0.478–4.159)–0.533–96.907 DominantCC + CT vs. TT1.410 (0.478–4.159)0.53394.907 OverdominantCT vs. TT + CC1.410 (0.478–4.159)0.53394.907 RecessiveCC vs. CT + TT––– AdditiveC1.410 (0.478–4.159)0.53394.907TAS2R16 rs978739 CodominantCT vs. TTCC vs. TT1.125 (0.394–3.210)0.857 (0.152–4.819)0.8260.86197.194 DominantCC + CT vs. TT1.065 (0.395–2.872)0.90295.290 OverdominantCT vs. TT + CC1.156 (0.423–3.160)0.77795.226 RecessiveCC vs. CT + TT0.812 (0.155–4.254)0.80595.243 AdditiveC0.991 (0.475–2.070)0.98295.305TAS2R16 rs1357949 CodominantAG vs. AAGG vs. AA0.783 (0.269–2.277)0.352 (0.039–3.149)0.6540.35096.187 DominantGG + AG vs. AA0.679 (0.246–1.872)0.45494.738 OverdominantAG vs. AA + GG0.886 (0.311–2.525)0.82195.254 RecessiveGG vs. AG + AA0.386 (0.045–3.335)0.38794.390 AdditiveG0.678 (0.305–1.508)0.34094.347OR – odds ratio, AIC – Akaike information criteria; the underlined AIC value indicates the best genetic model; CI – confidence interval; p-value – significance level; Bonferroni corrected significance level when p = 0.05/3
However, we performed a logistic regression analysis of the selected SNPs in alcohol-using LSCC patients and alcohol-consuming controls but did not find statistically significant results (Table 18).
Table 18. Binomial logistic regression analysis of TAS2R16 (rs860170, rs978739, rs1357949) in alcohol users, LSCC patients, and drinking alcohol controlsModelGenotype/alleleOR (95% CI)p–valueAICTAS2R16 rs860170 CodominantCT vs. TTCC vs. TT1.694 (0.918–3.126)–0.092–246.683 DominantCC + CT vs. TT1.694 (0.918–3.126)0.092246.683 OverdominantCT vs. TT + CC1.694 (0.918–3.126)0.092246.683 RecessiveCC vs. CT + TT––– AdditiveC1.694 (0.918–3.126)0.092246.683TAS2R16 rs978739 CodominantCT vs. TTCC vs. TT0.636 (0.336–1.203)0.938 (0.310–2.837)0.1640.909249.496 DominantCC + CT vs. TT0.682 (0.371–1.254)0.218247.986 OverdominantCT vs. TT + CC0.643 (0.349–1.184)0.156247.509 RecessiveCC vs. CT + TT1.161 (0.402–3.352)0.783249.437 AdditiveC0.828 (0.526–1.304)0.415248.854TAS2R16 rs1357949 CodominantAG vs. AAGG vs. AA1.031 (0.539–1.972)0.593 (0.221–1.587)0.9260.298250.296 DominantGG + AG vs. AA0.918 (0.501–1.683)0.782249.438 OverdominantAG vs. AA + GG1.137 (0.614–2.106)0.683249.347 RecessiveGG vs. AG + AA0.585 (0.229–1.494)0.262248.305 AdditiveG0.846 (0.538–1.331)0.470248.995OR – odds ratio, AIC – Akaike information criteria; the underlined AIC value indicates the best genetic model; CI – confidence interval; p-value – significance level; Bonferroni corrected significance level when p = 0.05/3
Moreover, a logistic regression analysis of the selected SNPs was also performed for non-alcohol-using and alcohol-consuming controls and non-alcohol-using and alcohol-consuming LSCC patients, although statistically significant results were not found (Tables 19 and 20).
Table 19. Binomial logistic regression analysis of TAS2R16 (rs860170, rs978739, rs1357949) in non-alcohol users and drinking alcohol controlsModelGenotype/alleleOR (95% CI)p–valueAICTAS2R16 rs860170 CodominantCT vs. TTCC vs. TT0.604 (0.290–1.259)–0.179–165.070 DominantCC + CT vs. TT0.604 (0.290–1.259)0.179165.070 OverdominantCT vs. TT + CC0.604 (0.290–1.259)0.179165.070 RecessiveCC vs. CT + TT––– AdditiveC0.604 (0.290–1.259)0.179165.070TAS2R16 rs978739 CodominantCT vs. TTCC vs. TT1.400 (0.654–2.996)0.857 (0.242–3.035)0.3860.811167.871 DominantCC + CT vs. TT1.277 (0.620–2.631)0.507166.451 OverdominantCT vs. TT + CC1.439 (0.695–2.987)0.327165.928 RecessiveCC vs. CT + TT0.728 (0.217–2.437)0.606166.625 AdditiveC1.077 (0.624–1.861)0.789166.822TAS2R16 rs1357949 CodominantAG vs. AAGG vs. AA1.239 (0.570–2.695)1.354 (0.435–4.220)0.5890.601168.456 DominantGG + AG vs. AA1.267 (0.617–2.603)0.520166.478 OverdominantAG vs. AA + GG1.165 (0.555–2.445)0.687166.730 RecessiveGG vs. AG + AA1.234 (0.417–3.652)0.704166.748 AdditiveG1.185 (0.706–1.989)0.520166.479OR – odds ratio, AIC – Akaike information criteria; the underlined AIC value indicates the best genetic model; CI – confidence interval; p-value – significance level; Bonferroni corrected significance level when p = 0.05/3
Table 20. Binomial logistic regression analysis of TAS2R16 (rs860170, rs978739, rs1357949) in non-alcohol users and drinking alcohol LSCC patientsModelGenotype/alleleOR (95% CI)p–valueAICTAS2R16 rs860170 CodominantCT vs. TTCC vs. TT0.726 (0.266–1.980)–0.532–129.504 DominantCC + CT vs. TT0.726 (0.266–1.980)0.532129.504 OverdominantCT vs. TT + CC0.726 (0.266–1.980)0.532129.504 RecessiveCC vs. CT + TT––– AdditiveC0.726 (0.266–1.980)0.532129.504TAS2R16 rs978739 CodominantCT vs. TTCC vs. TT0.792 (0.302–2.073)0.938 (0.186–4.715)0.6340.938131.681 DominantCC + CT vs. TT0.818 (0.328–2.040)0.667129.724 OverdominantCT vs. TT + CC0.800 (0.317–2.017)0.636129.688 RecessiveCC vs. CT + TT1.040 (0.220–4.908)0.960129.907 AdditiveC0.901 (0.459–1.771)0.763129.819TAS2R16 rs1357949 CodominantAG vs. AAGG vs. AA1.631 (0.614–4.335)2.284 (0.275–18.982)0.3260.445130.509 DominantGG + AG vs. AA1.713 (0.671–4.369)0.260128.608 OverdominantAG vs. AA + GG1.494 (0.571–3.912)0.413129.220 RecessiveGG vs. AG + AA1.871 (0.232–15.082)0.557129.503 AdditiveG1.577 (0.720–3.457)0.255128.522OR – odds ratio, AIC – Akaike information criteria; the underlined AIC value indicates the best genetic model; CI – confidence interval; p-value – significance level; Bonferroni corrected significance level when p = 0.05/3
TAS2R16 serum concentrations‘ association with LSCC
Protein TAS2R16 concentrations were measured in groups of patients with LSCC and healthy subjects. We found that TAS2R16 serum levels showed no statistically significant difference between LSCC patients and control group subjects (0.124 (0.024) ng/mL vs. 0.116 (0.027) ng/mL, p = 0.103) (Fig. 8).
Fig. 8TAS2R16 protein concentrations in control and LSCC groups
A TAS2R16 concentration comparison between study groups and genotypes was performed and showed statistically significant differences between the two groups. We found that TAS2R16 rs978739 CT carriers had higher TAS2R16 serum levels in the LSCC than the control group (0.129 (0.054) vs. 0.115 (0.017); p = 0.027). A Mann–Whitney U test was used to compare TAS2R16 concentrations between the two groups. The bars represent the median with the interquartile range (Table 21).
Table 21. Genotype distribution of SNPs and TAS2R16 concentration levels between patients with LSCC and the control groupGenotypeTAS2R16 concentrationp–valueControlMedian (IQR)LSCCMedian (IQR)TAS2R16 rs860170 TT0.115 (0.016)0.124 (0.016)0.180 CT0.118 (0.030)0.127 (0.042)0.427 CC–––TAS2R16 rs978739 TT0.116 (0.721)0.118 (0.017)0.661 CT0.115 (0.017)0.129 (0.054) 0.027 CC0.118 (1.126)0.149 (–)0.439TAS2R16 rs1357949 AA0.151 (2.208)0.128 (0.058)0.937 AG0.116 (0.011)0.118 (0.014)0.356 GG–––LSCC – laryngeal squamous cell carcinoma; p-value – significance level and Bonferroni corrected significance level when p = 0.05; the bolded results indicate significant differences between the groups
Haplotype analysis of TAS2R16 rs860170, rs978739, and rs1357949
A high pairwise linkage disequilibrium (LD) was observed between the polymorphisms TAS2R16 rs978739 and rs1357949, rs860170 and rs978739, rs860170 and rs1357949 (Table 22).
Table 22. Linkage disequilibrium between TAS2R16 SNPsSNPsD’ r ^2^ rs860170-rs9787390.8890.175rs860170-rs13579490.8690.154rs978739- rs13579490.9130.176SNPs – single nucleotide polymorphisms; D’ is the deviation between the expected haplotype frequency and the observed frequency [D’ scale: 0.1]; r^2^ is the squared correlation coefficient of the haplotype frequencies [r^2^ scale: 0.1]
A haplotype association analysis was performed of TAS2R16 rs860170, rs978739, and rs1357949 in patients with LSCC compared with a control group. Statistical analysis showed no statistically significant associations (Table 23).
Table 23. Haplotype association of TAS2R16 (rs860170, rs978739, rs1357949) with the predisposition to LSCC occurrenceHaplotypeTAS2R16 rs860170TAS2R16 rs978739TAS2R16 rs1357949Frequency (%)OR (95% CI)p–valueControlLSCC1TCA0.3060.3041.00–2CTA0.2770.3161.20 (0.84–1.70)0.323TTG0.2980.2780.93 (0.70–1.25)0.644TTA0.0740.0891.12 (0.72–1.74)0.625CTG0.0170.0030.13 (0.02–1.02)0.052Rare***––0.44 (0.16–1.19)0.1LSCC – laryngeal squamous cell carcinoma; OR – odds ratio; CI – confidence interval; p-value – significance level; *All haplotypes with less than 1% frequencies were grouped and labeled as “rare” haplotypes
Association between TAS2R16 rs860170, rs978739, and rs1357949 and five-year survival rate
The five-year overall survival (OS) rate of selected 238 LSCC patients including all causes of death was 51% (Fig. 9).
Fig. 9. The five-year overall survival rate of the patients included in the LSCC group
However, we analyzed LSCC patients’ five-year survival rate and the genotype distributions of TAS2R16 rs860170, rs978739, and rs1357949. We did not find any statistically significant differences between the genotypic distribution of TAS2R16 rs860170 and the survival rate of the LSCC patients (p = 0.794) (Fig. 10).
Fig. 10. Five-year survival rate according to the distribution of TAS2R16 rs860170 genotypes
Analyzing LSCC patients’ five-year survival rate and the genotype distribution of TAS2R16 rs978739 we clarified that subjects carrying CC genotype had a statistically significantly poorer five-year survival rate (five-year survival 25%) than those carrying TT and CT genotypes (five-year survival 56%, p = 0.043 and 53%, p = 0.002, respectively) (Fig. 11).
Fig. 11. Five-year survival rate according to the distribution of TAS2R16 rs978739 genotypes
Results revealed five-year survival based on the distribution of the genotypes of the TAS2R16 rs1357949 that the carriers of AG genotype had a statistically significantly greater five-year survival rate (five-year survival 67%) than those carrying AA and GG genotypes (five-year survival 40%, p = 0.013 and 41%, p = 0.048, respectively) (Fig. 12).
Fig. 12. Five-year survival rate according to the distribution of TAS2R16 rs1357949 genotypes
Discussion
During this study, we investigated the possible association between TAS2R16 SNPs and TAS2R16 protein serum levels in patients with laryngeal squamous cell carcinoma in Lithuania. We performed genotyping analysis of three specific TAS2R16 SNPs: rs860170, rs978739, and rs1357949. The analysis was performed on two groups consisting of 312 patients with LSCC and 320 control subjects. For the first time, we examined the serum levels of TAS2R16 rs860170, rs978739, and rs1357949 in LSCC patients. Although studies have examined the impact of the TAS2R16 rs860170, rs978739, and rs1357949 polymorphisms examined in this work on other diseases, whose development may be linked to autoimmune diseases, inflammation, and other factors [13, 15]. At the same time, there is no information in the scientific literature regarding the association between these polymorphisms and LSCC. The fundamental cause of TAS2R16 link to illnesses is that food decisions are influenced by the altered sensitivity to bitter taste brought on by desire and reluctance. Changes in desire and reluctance brought on by a heightened sensitivity to bitter taste also influence dietary choices, which is the fundamental cause of its relationship with LSCC. Furthermore, forming dietary habits may have an impact on nutritional status later and raise the risk of chronic illnesses and long-term health issues.
The gene encoding TAS2R16 is located on the long arm of chromosome 7, at position 31 (7q31.32) and is 997 bp long [22]. The bitter taste receptor family’s TAS2R16 gene, sensitive to substances including salicin, amygdalin, and sinigrin, has recently been subjected to selection pressure [17]. These substances, present in many foods, have pharmacological actions including anti-inflammatory and cancer-inhibiting qualities [23–25]. Pears and wheat have arbutin, which suppresses bladder cancer [25]; fruit seeds contain amygdalin, which may influence cancer cells [26]; Brassicaceae plants include sinigrin, which may protect against colorectal cancer [27]; and willow bark has salicin, which functions similarly to aspirin [28]. According to research, the TAS2R16 receptor plays a part in identifying advantageous chemicals the organism interacts with. The effectiveness of the different substances may be impacted by a receptor’s reduced function, which might eventually put the organism at a disadvantage.
Beyond bitter taste receptor’s role in bitter taste perception, innate immunity, thyroid function, heart physiology, and other biological functions are all impacted by TAS2Rs [29–31]. Moreover, TAS2Rs have been investigated in head and neck squamous cell carcinoma (HNSCC), breast, and ovarian malignancies [32–34]. Studies demonstrate that some bitter agonists that activate different TAS2Rs raise nuclear and mitochondrial Ca2+, which causes squamous airway epithelium and HNSCC cells to undergo apoptosis [34, 35]. Furthermore, in the study by Mirza et al., patients with head and neck cancer showed anomalies in taste, and based on therapy, it was proposed that radiation exposure was the origin of these deficiencies [36].
It has been proposed that polymorphic variants in TAS2R16 affect the perceptions, preferences, or consumption of common beverages that contain phytochemicals and other pharmacologically active ingredients associated with chronic diseases [16]. These variations also confer differential response in vitro through functional alterations in the receptor [37]. Genetic polymorphisms and environmental factors can influence the TAS2R16 receptor’s ability to recognize harmful and beneficial substances, potentially affecting lifespan. Recent studies suggest taste receptors like TAS2R16 also have non-gustatory roles, such as influencing respiratory function in response to harmful stimuli, which may contribute to healthy aging [38].
HNSCC, including LSCC, is influenced by various genetic alterations beyond TAS2R16. Several well-established genes play a critical role in tumorigenesis, and their interaction with clinical features is widely studied. SPINK5, serine peptidase inhibitor Kazal type 5, also known as lympho-epithelial Kazal-type-related inhibitor, is a member of the serine protease inhibitor Kazal type family, is located in the 5q32 region of the chromosome and contains 15 potential inhibitory domains [39]. Prior research revealed that, in comparison to the matched neighboring normal tissues, SPINK5 was downregulated 9.7 times in 22 head and neck squamous cell carcinoma tissues [40]. The same team’s subsequent research showed that downregulated SPINK5 facilitated the invasion, colony formation, and proliferation of HNSCC cells [41]. Furthermore, it was shown that oral squamous cell carcinoma had decreased levels of LEKTI, a big protein encoded by the SPINK5 gene, with a shorter OS being associated with a higher KLK5/SPINK5 mRNA ratio [42]. Liu and co-authors found that SPINK5 was downregulated in tumor tissues compared to normal tissues, showing a significant correlation with LSCC. Their findings demonstrated a correlation between SPINK5 and the DNA damage and repair pathways as well as the carcinogenesis pathways. Low SPINK5 expression in Liu et al. study was associated with worse survival and worse outcomes for LSCC patients. It’s probable that SPINK5 contributes to a bad prognosis for LSCC patients by interfering with various signaling pathways [43]. However, RNA transcripts longer than 200 nucleotides are known as long non-coding RNAs, or lncRNAs. They have an important role in the control of gene expression, chromatin remodeling, splicing, and intracellular trafficking, but they do not have the functional duty of encoding proteins [44]. Many different kinds of lncRNAs have been shown to be useful prognostic biomarkers and therapeutic targets for LSCC or HNSCC as a result of current research examining the modalities of cell death in these cancers. Nevertheless, little is known about how disulfidptosis-related lnRNAs (DRlncRNAs) contribute to laryngeal squamous cell carcinoma (LSCC) [4]. The use of the DRlncRNAs signature in a number of malignant tumors, such as liver hepatocellular carcinoma [45], lung adenocarcinoma [46], and colon adenocarcinoma [47], has been well documented in earlier research, demonstrating its important prognostic and therapeutic utility. The study done by Zhang et al. aimed to determine the prognostic DRlncRNAs in LSCC, which can offer critical insights into the underlying signaling pathways and mechanisms involved. Significant differences emerged between the high-risk and low-risk groups of the LSCC patients, particularly in immune-related processes and metabolic dysfunction. The high-risk group exhibited activation of metabolic pathways (glutathione metabolism, pentose phosphate pathway) and showed higher levels of activated mast cells and eosinophils but lower activated NK cell levels, indicating a potentially compromised anti-tumor immune response. In contrast, the low-risk group displayed immune-related pathway activation (IgA production, autoimmune diseases) and had greater immune cell infiltration, as confirmed by a significantly higher immune score. In vitro experiments revealed distinct behaviors of DRlncRNAs, highlighting their potential role in tumor progression and immune regulation. Ultimately, the DRlncRNAs signature presents a robust biomarker capable of predicting both prognosis and therapeutic responses in LSCC patients [4].Notably, TAS2R16, a bitter taste receptor gene, has emerged as another significant genetic factor in LSCC. Discussing the results of our research, we found that the distribution of TT, CT, and CC genotypes of the TAS2R16 rs860170 was statistically significantly different in LSCC patients compared to the control group (p = 0.002). Barontini and co-authors analyzed TAS2R16 rs860170 influence on colorectal cancer patients, although, they did not find any statistically significant associations [48]. Another study investigated TAS2R16 SNPs’ association with benign tumour – pituitary adenoma (PA). A study showed no statistically significant correlation between rs860170 and PA development [49]. Gedvilaite et al. studied the influence of TAS2R16 gene variants on the development of chronic disease. They found that the CC genotype and C allele were statistically significantly more frequent in the multiple sclerosis patients than in the healthy individuals (p < 0.001 and p = 0.008, respectively) [50].
We also examined the impact of selected SNPs on the clinical features of the LSCC. Results showed that the distribution of TT, CT, and CC genotypes of TAS2R16 rs860170 is statistically significantly different in both early-stage and late-stage LSCC patients compared to the control group (p = 0.035 and p = 0.023, respectively). We determined that TAS2R16 rs860170 CT genotype is associated with 1.5-fold increase odds of developing late-stage LSCC (p = 0.043) Also, a statistically significant difference was observed in the distribution of TT, CT, and CC genotypes of TAS2R16 rs860170 between LSCC patients without metastasis and the control group (p = 0.005) and between patients with poorly differentiated LSCC and the control group (p = 0.011). While other scientists analyzed TAS2R16 SNPs’ influence on clinical features of PA, they found that the CT genotype of the rs860170 reduces the likelihood of developing non-invasive PA by 1.9-fold under the codominant and overdominant model (p = 0.024 and p = 0.030, respectively). Nevertheless, under the dominant model, rs860170 CT + CC genotypes reduce the odds of developing non-invasive PA by two times (p = 0.021), and under the additive model, each C allele reduces these odds by two times (p = 0.018) [49]. In another study done by Liu and co-authors tumour features, such as advanced T, advanced N, and advanced M stages, were linked to an increased risk of early mortality from all causes and from cancer specifically [51].
According to earlier research, smoking is a risk factor in and of itself for a lower specific survival rate in LSCC [51]. Considering that smoking and alcohol consumption are risk factors for head and neck cancer [10], we suggested that these lifestyle habits may have an important role in the development of LSCC and should be further investigated. The analysis of genotype and allele distribution revealed that the distribution of the TAS2R16 rs860170 TT, CT, and CC genotypes was statistically significantly different between smoking controls and LSCC patients who smoked (p = 0.040), suggesting a potential role of this variant in LSCC among smokers. TAS2R16 rs1357949 AA, AG, and GG genotypes were statistically significantly different between non-smoking controls and non-smoking LSCC patients (p = 0.029). Also, the distribution of these genotypes is statistically significantly different between non-smokers of the LSCC group and LSCC smokers (p = 0.009). Our findings show that the TAS2R16 rs1357949 polymorphism is significantly associated with LSCC in non-smokers, as its genotype distribution differs between non-smoking controls and non-smoking LSCC patients. A notable difference in rs1357949 genotype distribution is also observed between non-smoking LSCC patients and smoking LSCC patients, indicating that this SNP may influence LSCC risk differently in smokers and non-smokers. The TAS2R16 rs1357949 G allele is less common in non-smokers of the LSCC group than in the non-smokers of the control group (p = 0.006), and the smokers than in non-smokers when comparing only LSCC patients (p = 0.003), proposing a potential protective effect of this allele in non-smokers. TAS2R16 rs978739 C allele is more frequent in non-smokers than in smokers of the LSCC group (p = 0.033), further indicating that genetic susceptibility to LSCC may differ by smoking status. The binomial logistic regression analysis reveals significant associations between TAS2R16 polymorphisms and both LSCC development and smoking behavior, highlighting potential genetic risk factors and protective effects. This analysis in smokers with LSCC patients and smoking controls showed that the TAS2R16 rs860170 CT genotype was found to increase the odds of developing LSCC in smokers by 2.5 times under the codominant and overdominant models, while the CT + CC models increase these odds by 2.5-fold under the dominant model, also each C allele increases these odds by 2.5 times (p = 0.044 in all models). Our results imply that rs860170 of the TAS2R16 may act as a risk factor for LSCC in smokers, increasing susceptibility to the disease. The results showed that TAS2R16 rs1357949 GG and AG genotypes together are associated with 4.2-fold decreased odds of developing LSCC in non-smoking patients under the dominant model (p = 0.016). Also, each rs1357949 G allele decreased the odds of LSCC occurrence in non-smokers by 3.8-fold under the additive model (p = 0.014), suggesting a potential protective effect. Analysis revealed that TAS2R16 rs978739 each C allele is associated with reduced odds of smoking for LSCC patients by 1.9-fold under the additive model (p = 0.044), indicating a possible protective role against smoking. Moreover, TAS2R16 rs1357949 AG genotype was found to increase the odds of smoking for LSCC patients by 4.2-fold and 3.4-fold under the codominant and overdominant models (p = 0.015 and p = 0.033, respectively), while GG and AG genotypes together increase these odds by 5 times under the dominant model (p = 0.006). Also, each of the rs1357949 G alleles increases the odds of the smoking habit for LSCC patients by 4.6-fold under the additive model (p = 0.006), suggesting a genetic influence on smoking behavior. So far, only other TAS2R16 genetic variants appear to influence alcohol and nicotine dependence [12, 19]. Since this is the first study to examine the associations between TAS2R16 (rs860170, rs978739, and rs1357949) polymorphisms and human habits such as smoking and alcohol drinking, our findings provide new insights into the potential role of this receptor in lifestyle factors and LSCC risk, warranting further investigation in future studies. Our study implies that TAS2R16 polymorphisms may contribute to LSCC susceptibility, with distinct effects in smokers and non-smokers, specifically the rs1357949 G allele may have a protective role, particularly in non-smokers. Our results imply that the C allele of TAS2R16 rs860170 may be associated with an increased risk under multiple inheritance models. However, TAS2R16 rs1357949 G allele appears to have a protective effect against LSCC in non-smokers, but it is associated with a significantly higher likelihood of smoking among LSCC patients. Also, TAS2R16 rs978739 C allele may be protective against smoking in LSCC patients, which could have implications for smoking cessation strategies. These findings suggest a strong gene-environment interaction between TAS2R16 SNPs and smoking in LSCC risk. Further research is needed to explore these genetic influences on smoking behavior and cancer susceptibility.
TAS2R16 protein concentrations were also measured in the patients’ and controls’ serum. TAS2R16 concentration comparison between study groups and genotypes was performed. We determined that the TAS2R16 serum levels in the LSCC were greater in TAS2R16 rs978739 CT genotype carriers than in the control group (p = 0.027). Different genotypes of the *TAS2R16 (*rs860170, rs978739, and rs1357949) were also compared in terms of TAS2R16 serum levels in patients with PA and controls. PA patients with the TT or CT genotype of the TAS2R16 rs860170 had higher protein levels than the healthy control group (p = 0.031 and p = 0.006, respectively). Serum levels of TAS2R16 were greater in PA patients with the TT or CT genotype than in healthy individuals, according to TAS2R16 rs978739 SNV (p = 0.025 and p = 0.019, respectively). Furthermore, PA patients with the AA or AG genotype of the TAS2R16 rs1357949 SNV had higher TAS2R16 protein concentrations than did healthy individuals (p = 0.005 and p = 0.007, respectively) [49]. The differences in TAS2R16 levels based on genotype and condition indicate that these genetic variations may play a role in the pathophysiology of LSCC and PA, possibly affecting disease susceptibility or progression.
In our study we examined the the five-year overall survival (OS) rate of LSCC patients according to the selected TAS2R16 SNPs. We determined that patients who have the CC genotype of the rs978739 had a statistically significantly poorer five-year survival rate than those carrying TT and CT genotypes (p = 0.043 and p = 0.002, respectively). According to rs1357949, the five-year survival rate for carriers of the AG genotype was statistically substantially higher than for those carrying the AA and GG genotypes (p = 0.013 and p = 0.048, respectively). Pasvenskaite and co-authors found that the five-year overall survival rate of 300 LSCC patients was 65%. These scientists determined that AA genotype at IL-9 rs1859430 is statistically significant association with poorer LSCC-specific five-year survival rate [52]. In other study done by Liu et al. the 3-month mortality rates among patients with newly diagnosed supraglottic LSCC were calculated. Scientist found that 8.38% of the supraglottic LSCC patients died within 3 months following diagnosis [51].
The observed associations between TAS2R16 genetic variants, lifestyle factors like smoking, and LSCC risk emphasize the need to further explore these interactions. Our findings open new avenues for research into the potential of TAS2R16 as a biomarker for LSCC and other related cancers, while also suggesting the importance of dietary habits and lifestyle choices in cancer prevention. Although there were notable discoveries in this study, we recognize that our work also has several future directions. For example, conducting studies in diverse populations will help validate the observed associations and ensure broader applicability of the findings. Further research is needed to elucidate the molecular mechanisms by which TAS2R16 influences inflammation in LSCC and to clarify the exact effect of the protein on the occurrence and progression of the disease. Also, investigating additional bitter taste receptor genes may uncover their potential roles in cancer susceptibility and progression.
Conclusion
This study represents the first investigation into the association between TAS2R16 SNPs (rs860170, rs978739, and rs1357949) and TAS2R16 protein serum levels in patients with LSCC in Lithuania. Our findings reveal that specific TAS2R16 genotypes are significantly associated with LSCC, suggesting a potential role of TAS2R16 genetic polymorphisms in the disease’s development and clinical features. The study also demonstrates that the TAS2R16 protein serum levels are elevated in LSCC patients carrying TAS2R16 rs978739 CT genotype, further supporting the involvement of this receptor in LSCC pathophysiology.
Future studies should aim to confirm these associations in larger, more diverse populations and investigate the underlying mechanisms of TAS2R16’s influence on cancer development, considering both genetic predispositions and environmental factors such as diet and lifestyle.
The reference list from the paper itself. Each links out to its DOI / PubMed record.
- 1American Cancer Society. Cancer Facts & Figs. 2019 [Internet] [cited 2024 Jan 30]. Available from: https://www.cancer.org/research/cancer-facts-statistics/allcancer-facts-figures/cancer-facts-figures-2019.html
- 2Gene Cards. TAS 2R 16 Gene - Taste 2 Receptor Member 16. [Internet] [cited 2024 Nov 29] Available from: https://www.genecards.org/cgi-bin/carddisp.pl?gene=TAS 2R 16