Integrated UPLC–MS/MS and UPLC–Q–TOF–MS/MS analysis to reveal pharmacokinetics, tissue distribution, metabolism, and excretion of sipeimine in rats
Hui Zong, Chongyang Wang, Dongdong He, Liting Liu, Juanjuan Wan, Guodong Wang, Dingtao Li, Jun Ran, Meiling Zhang, Hui Tang, Liping Wang

TL;DR
This study investigates how sipeimine, a compound from a traditional Chinese medicine, is absorbed, distributed, metabolized, and excreted in rats.
Contribution
The study provides the first comprehensive in vivo disposition profile of sipeimine using advanced analytical methods.
Findings
Sipeimine shows rapid absorption and slow elimination in rats with 40% oral bioavailability.
The compound is distributed in most organs but not the brain and has 30% plasma protein binding.
Metabolism involves hydroxylation, sulfation, and glucosidation, with renal excretion as the main route.
Abstract
Fritillaria Bulbus is a traditional Chinese medicine used to treat respiratory diseases such as cough, expectoration, and asthma for more than 2000 years. Sipeimine, a major isosteroidal alkaloid isolated from Fritillaria Bulbus, has attracted considerable attention from the research community owing to its antitussive, anti-inflammatory, and lung-protective activities. However, there exist few reports regarding the in vivo disposition of sipeimine. This study aims to investigate the disposition of sipeimine in rats. A rapid, sensitive, and selective UPLC–MS/MS approach was developed to the quantification of sipeimine in various biological samples and successfully applied to the investigation of pharmacokinetic characteristics, tissue distribution, and excretion of sipeimine in rats. A reliable UPLC–Q–TOF–MS/MS combined with a scientific metabolite identification strategy was used to…
Genes, proteins, chemicals, diseases, species, mutations and cell lines named across the full text — each resolved to its canonical identifier and authoritative record.
Click any figure to enlarge with its caption.
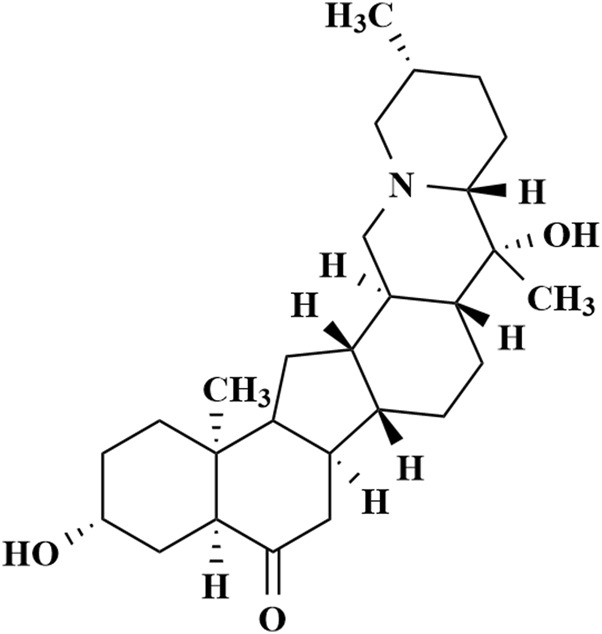 FIGURE 1
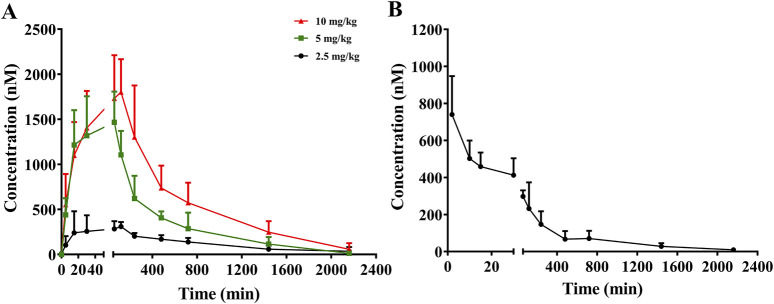 FIGURE 2
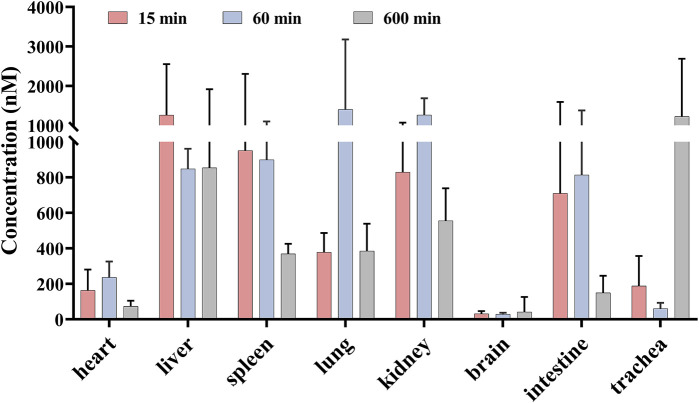 FIGURE 3
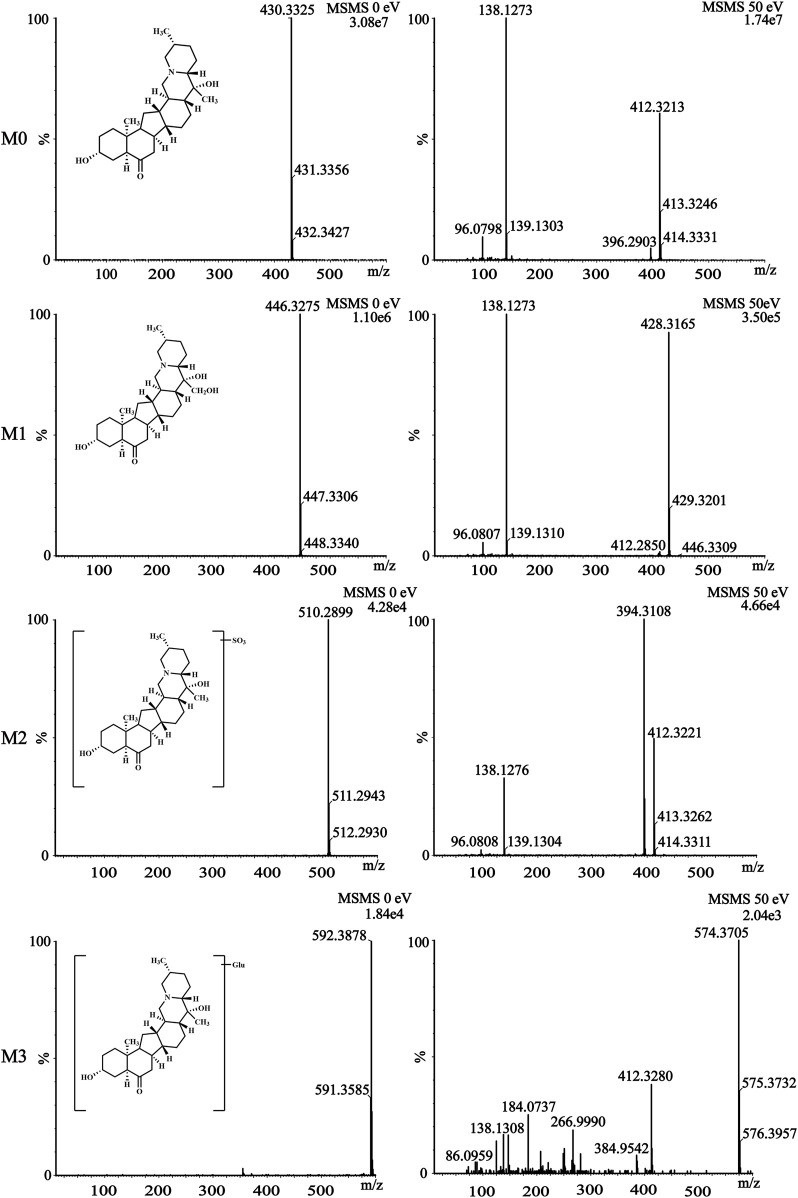 FIGURE 4
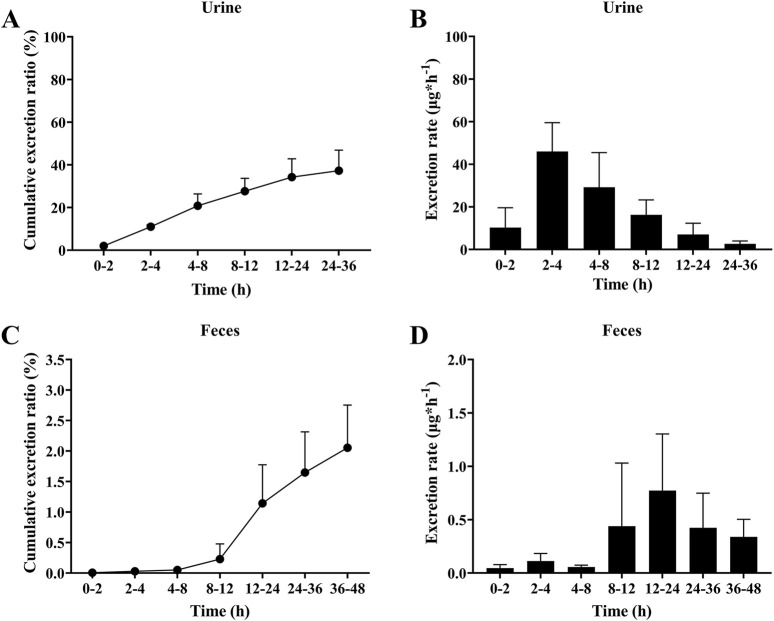 FIGURE 5
| Parameter | i.g. (2.5 mg/kg) | i.g. (5 mg/kg) | i.g. (10 mg/kg) | i.v. (0.5 mg/kg) |
|---|---|---|---|---|
|
| 1.29 ± 0.81 | 0.83 ± 0.26 | 1.83 ± 0.41 | 0.03 ± 0.00 |
|
| 0.17 ± 0.07 | 0.65 ± 0.15 | 0.83 ± 0.15 | 0.32 ± 0.09 |
|
| 11.83 ± 11.46 | 5.91 ± 0.76 | 9.88 ± 2.38 | 7.99 ± 2.63 |
|
| 1.78 ± 0.48 | 4.60 ± 1.51 | 8.59 ± 2.60 | 1.12 ± 0.51 |
|
| 2.23 ± 1.22 | 4.70 ± 1.54 | 9.70 ± 3.20 | 1.18 ± 0.53 |
|
| 10.64 ± 3.06 | 7.92 ± 1.76 | 9.50 ± 1.82 | 7.98 ± 2.25 |
|
| 1.39 ± 0.69 | 1.13 ± 0.25 | 1.17 ± 0.51 | 0.48 ± 0.17 |
|
| 17.31 ± 6.82 | 9.57 ± 2.34 | 15.68 ± 4.67 | 5.34 ± 1.88 |
|
| 37.80 | 39.83 | 41.10 | — |
| Concentration/nM | Protein binding rates (%) | Average (%) |
|---|---|---|
| 50 | 30.32 ± 7.22 | 29.91 ± 5.90 |
| 250 | 28.46 ± 3.65 | |
| 1,250 | 30.95 ± 6.84 |
Peer Reviews
No public reviews on file for this paper yet. If you reviewed it on a platform where reviews are public (OpenReview, ICLR, NeurIPS, ICML), you can paste yours below so the community can read it here.
Videos
No videos yet. Explain this paper in a talk, walkthrough, or lecture? Add one.
Taxonomy
TopicsPharmacological Effects of Natural Compounds · Biochemical Analysis and Sensing Techniques · Silymarin and Mushroom Poisoning
1 Introduction
Fritillaria Bulbus, referred to as “Bei-mu” in Chinese, holds significance not only as a botanical resource but also as a source of food and medicine worldwide (Kumar et al., 2024). There are five sorts of Fritillaria Bulbus officially recorded in Chinese Pharmacopeia (2020 edition), including Fritillaria cirrhosa D.Don, Fritillaria thunbergii Miq., Fritillaria usuriensis Maxim., Fritillaria pallidiflora Schrenk ex Fisch. & C.A.Mey., and Fritillaria monantha Migo. (The plant name has been checked with http://www.theplantlist.org). According to traditional descriptions, Fritillaria Bulbus is slightly cold and affects the lungs (to clear heat and moisten dryness, and used for hot-type bronchitis with dry cough) and the heart (to calm heart fire) (Xu et al., 2019). Modern pharmacological researches have demonstrated that the active components from Fritillaria Bulbus have revealed potential in alleviating respiratory disorders, including cough, expectoration, asthma, chronic obstructive pulmonary disease, and nonsmall cell lung cancer (Yeum et al., 2007; Wu et al., 2018; Xu et al., 2019; Liu et al., 2023; Li et al., 2024). At present, isosteroidal alkaloids, saponins, terpenoids, glycosides, and many other compounds have been isolated from Fritillaria Bulbus, among which isosteroidal alkaloids are traditionally believed to be responsible for its pharmacological activities (Wang et al., 2012; Wang et al., 2016b; Pai et al., 2023; Peng M. et al., 2023; Wang et al., 2024).
Sipeimine, also known as imperialine (Figure 1), is one of the most favored active isosteroidal alkaloids isolated from Fritillaria Bulbus and has been shown to exert antitussive, anti-inflammatory, and lung-protective activities (Wu et al., 2015; Wang et al., 2016a; Huang et al., 2023). In LPS-induced inflammatory response, sipeimine reduces inflammatory mediators by inhibiting the PI3K/AKT/NF-κB pathway, thereby suppressing NLRP3 inflammasome activation and pyroptosis, and ultimately alleviating inflammation (Fang et al., 2024). In rats with PM2.5-induced lung toxicity, sipeimine mitigates damage and NLRP3 inflammasome-mediated pyroptosis by regulating the PI3K/AKT signaling pathway (Huang et al., 2023). Moreover, sipeimine exerts anticancer effects against nonsmall cell lung cancer without exhibiting any cytotoxicity and exhibits robust systemic safety (Lin et al., 2020).
Chemical structure of sipeimine.
The pharmacokinetic profiling of bioactive compounds, including their absorption, distribution, metabolism, and excretion (Sun et al., 2020), is vital for understanding their in vivo behavior and mechanisms of action. Currently, most pharmacokinetic studies on Fritillaria Bulbus are primarily focused on the extracts (Chen et al., 2013; Wang et al., 2018; Jeong et al., 2024) and other alkaloids (Chen et al., 2015; Wang et al., 2019; Zhang et al., 2021). A few studies have evaluated the behavior of sipeimine in rat plasma using liquid chromatography with evaporative light-scattering detection (Chan et al., 2000) or tandem mass spectrometry (Lin et al., 2013). Sipeimine was determined to be rapidly absorbed from the gastrointestinal tract, with passive membrane diffusion dominating its intestinal absorption (Lin et al., 2013; Lin et al., 2015). Nevertheless, there remains a controversy regarding the oral bioavailability of sipeimine (Chan et al., 2000; Lin et al., 2013). Moreover, the tissue distribution, metabolism, and excretion of sipeimine remain largely unknown.
An ultrahigh performance liquid chromatography–tandem mass spectrometry (UPLC–MS/MS) approach was developed to the quantification of sipeimine in various biological samples and successfully applied to evaluate the pharmacokinetics, tissue distribution, and excretion of sipeimine in rats. Metabolites of sipeimine were identified in rat plasma and urine using UPLC coupled with quadrupole time-of-flight mass spectrometry (UPLC–Q–TOF–MS/MS). These results are expected to prove useful for the interpretation of the pharmacokinetic and pharmacodynamic characteristics of sipeimine and the traditional Chinese medicines containing sipeimine.
2 Materials and experimental methods
2.1 Chemicals and reagents
Sipeimine (purity ≥ 98%), carbamazepine (Internal standard, IS, purity ≥ 98%), and heparin sodium were obtained from Yuanye Bio-Technology Co., Ltd. (Shanghai, China). Sodium carboxymethyl cellulose (CMC-Na) was obtained from Shanghai Acmec Biochemical Co., Ltd. (Shanghai, China). LC-grade methanol was purchased from Sigma-Aldrich Inc. (St. Louis, United States). LC-grade acetonitrile was purchased from Fisher Scientific International Inc. (Massachusetts, United States). LC-grade formic acid was purchased from Fuchen Chemical Reagent Co., Ltd. (Tianjin, China).
2.2 Animals
Male Sprague–Dawley rats weighing 180–220 g were procured from the Henan SkBys Biotechnology Co., Ltd (Anyang, China). All the rats were fed standard lab chow and water ad libitum for 7 days and housed under conditions of controlled temperature (21°C ± 2°C), humidity (50% ± 10%), and a 12-h light/dark cycle. Animal procedures adhered strictly to the guidelines set by the Animal Care and Use Committee of the Shihezi University (China), who also approved the study protocol (A2024-025).
2.3 Quantification of sipeimine in biological samples from rat using UPLC–MS/MS
UPLC–MS/MS analysis was performed on the ACQUITY UPLC H-Class system (Waters, United States). The chromatographic separation was performed on a Waters ACQUITY UPLC BEH C18 column (100 × 2.1 mm, 1.7 µm) with a mobile phase consisting of 0.1% (v/v) formic acid solution (A) and acetonitrile (B) at a flow rate of 0.3 mL/min. Chromatographic separation was achieved using a gradient elution program, as follows: 0.0–1.0 min, B% 2%–15%; 1.0–2.0 min, B% 15%–25%; 2.0–3.0 min, B% 25%–25%; 3.0–3.1 min, B% 25%–100%; 3.1–4.5 min, B% 100%–100%; 4.5–4.8 min, B% 100%–2%; and 4.8–6.0 min, B% 2%–2%.
Detection by MS was performed on a Waters Xevo TQ-S triple-quadrupole mass spectrometer (Waters, United States) with an electrospray ionization (ESI) source in the positive multiple reaction monitoring (MRM) mode. The parameters were optimized as follows: ion source temperature, 150°C; capillary voltage, 3 kV; desolvation temperature, 450°C; desolvation gas flow, 800 L/h; cone gas flow, 150 L/h; collision gas flow, 0.15 mL/min; precursor–product ion transitions, m/z 430→138 for sipeimine and 237→179 for IS; and declustering potential and collision energy, 100 V and 60 eV for sipeimine and 50 V and 15 eV for IS, respectively. Data acquisition and instrument control was performed using the MassLynx analyst software (Waters, United States).
2.4 Preparation of biological samples
In a 1.5 mL centrifuge tube, 10 μL solution of IS was added to 20 μL of biological samples. 200 μL acetonitrile was added to precipitate protein. The resulting solution was subjected to vortex mixing for 3 min and then centrifuged at 16,106 × g for 20 min. The supernatant (200 µL) was transferred to a polypropylene tube and evaporated to dryness by centrifugation at 25°C ± 2°C. The residue was dissolved in 200 µL of 1:1 solution of methanol: acetonitrile, and the resulting solution was again subjected to vortex mixing for 2 min and subsequent centrifugation at 16,106 × g for 20 min. The resulting supernatant was then injected for UPLC–MS/MS analysis.
2.5 Method validation
The UPLC–MS/MS method developed herein was fully validated according to the biological sample analysis methodology guide of the United States Food and Drug Administration (FDA), which is described in the Supplementary Material.
2.6 Pharmacokinetic studies
All rats were subjected to fasting for 12 h, with free access to water prior to the pharmacokinetics analysis. For intragastric (i.g.) administration, sipeimine was suspended in 0.5% CMC-Na to final concentrations of 0.25, 0.5, and 1 mg/mL. Eighteen rats were randomly divided into three groups (n = 6 per group), and each group received a single oral dose of 2.5, 5, or 10 mg/kg sipeimine. Blood samples (0.5 mL) were collected from the vein of the eye into heparinized tubes at predose and postdose (5, 15, 30, 60, 120, 240, 480, 720, 1,440, and 2,160 min after oral administration) time points. For intravenous (i.v.) administration, sipeimine was dissolved in 0.1% hydrochloric acid solution to a final concentration of 0.25 mg/mL. Six rats received a single intravenous dose of 0.5 mg/kg sipeimine. Blood samples (0.5 mL) were collected at predose and postdose (2, 10, 15, 30, 60, 120, 240, 480, 720, 1,440, and 2,160 min after injection) time points. All the blood samples were centrifuged to obtain the plasma, which was stored at −80°C until further analysis.
To acquire the pharmacokinetic parameters of sipeimine in plasma, the concentration–time data were subjected to noncompartmental analysis using WinNonlin Version 8.0 (Pharsight Corporation, United States). The oral bioavailability (F) was calculated by comparing the area under the curve and dose of sipeimine following i.g. and i.v. administration according to the following formula:
2.7 Evaluation of tissue distribution of sipeimine
Twenty-four rats were randomly divided into four groups (n = 6 per group). The rats of the first group were employed for obtaining blank tissue samples. The remaining three groups were sacrificed at 15, 60, and 600 min after the administration of 5 mg/kg sipeimine via the i.g., route. The various tissues, including heart, liver, spleen, lung, kidney, intestines, trachea, and brain, were immediately dissected and washed with physiological saline solution maintained at 4°C. Finally, all the tissues were blotted on filter paper, weighed, and separately homogenized using physiological saline solution to yield the tissue homogenates (1:9, w/v). The concentration of sipeimine in the homogenate samples was determined using UPLC–MS/MS.
2.8 In vitro evaluation of plasma protein binding ratio
The plasma protein binding ratio of sipeimine was determined using the equilibrium dialysis method. A semipermeable membrane bag (3,500 Da, Beijing Solaibao Technology Co., Ltd., China) was precut to an appropriate size and pretreated according to the instructions. Plasma samples (1 mL) obtained from rats of the blank group were added to the bags, which were then tightly tied at both ends. The bags were then placed in different bottles containing 20 mL of sipeimine solution at three concentrations (50, 250, and 1,250 nM). Five parallel samples were prepared for each concentration. The liquid within and outside the bag was maintained at the same level and care was taken that the bag did not touch the wall of the bottle, the setup was then incubated in a water bath at 37°C for 4 h such that equilibrium was attained. The concentrations of sipeimine in the plasma samples within the bag and the dialysate outside were estimated using UPLC–MS/MS.
2.9 Analysis of sipeimine metabolites in rat plasma and urine using UPLC–Q–TOF–MS/MS
The processed plasma and urine samples were injected into a Waters UPLC system equipped with an ACQUITY UPLC BEH C18 column. The mobile phases employed included 0.1% formic acid in water (A) and acetonitrile (B). The following linear gradient program was employed: 0–1 min, B% 5%–5%; 1–3 min, B% 5%–100%; 3–4 min, B% 100%–100%; 4–4.5 min, B% 100%–5%; and 4.5–6 min, B% 5%–5%. The temperature of the column oven was maintained at 40°C, and a flow rate of 0.3 mL/min was employed.
Sipeimine and its metabolites in rat plasma and urine were identified using a SYNAPT XS mass spectrometer (Waters, United States) with an ESI source in positive mode. The working parameters were as follows: source temperature of 120°C, desolvation temperature of 450°C, cone gas flow at 100.0 L/h, and desolvation gas flow at 800.0 L/h. Scanning modes encompassed Full MS/dd-MS_2_. The capillary voltage was 3 kV. The scan range (m/z) was from 50 to 1,000 Da. Collision energy of the second order was set at 50 V.
2.10 Evaluation of excretion of sipeimine
Six rats were administered sipeimine (5 mg/kg) via the i.g. route and individually housed in metabolic cages. Urine was collected at 0, 2, 4, 8, 12, 24, and 36 h. Feces were collected at 0, 2, 4, 8, 12, 24, 36, and 48 h. The volumes of the urine samples were measured accurately, followed by their 50-fold dilution. Feces were dried at 37°C, homogenized in 9 volumes (v/w) of 50% methanol/50% water and then centrifuged at 740 × g for 10 min. The concentration of sipeimine in the urine and feces was determined using UPLC–MS/MS.
3 Results and discussion
3.1 Validation of the UPLC–MS/MS method
3.1.1 Selectivity
The application of the UPLC–MS/MS method was validated for the quantitative analysis of sipeimine in rat plasma and other biological samples. Under the established chromatographic conditions, the analysis of sipeimine and IS using the selected MRM mode was highly selective without any interfering peaks. The typical chromatograms are shown in Supplementary Figures S1, S2.
3.1.2 Linearity and lower limit of quantitation
As shown in Supplementary Table S1, the calibration curves demonstrated good linearity over the concentration ranges typical of sipeimine in rat plasma and other samples, with correlation coefficients (r^2^) ≥ 0.99.
3.1.3 Precision and accuracy
Quality control samples were assessed at three concentrations to evaluate the precision and accuracy of the method. As shown in Supplementary Table S2, The values of relative standard deviation (RSD, for precision) and relative error (RE, for accuracy) were within ±15.0%. These observations demonstrate the reliability and reproducibility of the method developed herein.
3.1.4 Stability
The results of the experiments to evaluate stability are presented in Supplementary Table S3. Sipeimine was found to be stable in biological samples stored at −80°C for 2 weeks and after three cycles of freezing–thawing. In addition, the processed samples were stable at 4°C for 6 h, with RSD and RE values of within ±15%.
3.1.5 Extraction recovery and matrix effect
The extraction recoveries and matrix effects of sipeimine are shown in Supplementary Table S4. The extraction of sipeimine at different concentrations were consistent and a significant matrix effect was not detectable in the biological samples.
3.2 Pharmacokinetics analysis
The mean plasma concentration–time profiles of sipeimine following its administration via the i.g. and i.v. routes in rats are presented in Figure 2. The estimated pharmacokinetic parameters are summarized in Table 1. Following the oral administration of sipeimine, the time to peak concentration (t max) of sipeimine ranged from (0.83 ± 0.26) to (1.83 ± 0.41) h, demonstrating its quick absorption in rats. Sipeimine exhibited high levels of systemic exposure and a dose-proportional linear increase in the plasma of rats. Additionally, the values of elimination half-life (t _ 1/2 _) and mean residence time (MRT) indicated that sipeimine persists in the body for a prolonged duration. Our study also observed that the t _ 1/2 _ of the i.g., (2.5 mg/kg) dose group shows unusually high variability, potentially attributed to amplified inter-individual differences in enzyme activity under unsaturated metabolic conditions, compounded by gastrointestinal absorption fluctuations and detection sensitivity limitations. The values for volume of distribution ([V d]/F) in rats ranged from (9.57 ± 2.34) to (17.31 ± 6.82) L/kg, which indicated that sipeimine was widely distributed in plasma and extracellular fluid. Moreover, a significant local accumulation of sipeimine was not observed, which closely corresponds with the observed pattern of wide tissue distribution.
Mean plasma concentration-time curves of sipeimine in rats after intragastric (i.g., A) and intravenous (i.v., B) administration of sipeimine (n = 6, Mean ± SD).
For the group that was administered sipeimine via the i.v., route, the maximum plasma drug concentration (C max) and value of AUC 0–t were found to be 0.32 ± 0.09 mg/L and 1.12 ± 0.51 h∙mg/L, respectively. The oral bioavailability of sipeimine ranged from 37.8% to 41.1% at the three oral dosages employed, which is in line with the results obtained in a previous study (Lin et al., 2013). The pharmacokinetic characteristics of rapid absorption, slow elimination, and high oral bioavailability reveal that sipeimine can be retained in the body for a prolonged duration and exert therapeutic effects. However, female animals were not included in this study, and it may not be possible to fully predict fluctuations in exposure due to sex differences. Further research on gender differences is worth conducting.
3.3 Tissue distribution of sipeimine
Based on the mean plasma concentration–time profiles, the time points 15, 60, and 600 min after the oral administration of sipeimine (5 mg/kg) were selected for the study of its distribution in rat tissues. As shown in Figure 3, the results reveal that sipeimine was rapidly distributed to various tissues following i.g., administration. The concentrations of sipeimine in various tissues at the 15-min time point were determined as follows: liver > spleen > kidney > intestines > lung > trachea > heart > brain. The prominent increase in the concentration of sipeimine in the lung and kidney tissues at the 60-min time point may be associated with its lung-protective effects and renal excretion. At the 600-min time point, the concentration of sipeimine was observed to decrease in most tissues. Interestingly, the concentration of sipeimine in the trachea remained high at the 600-min time point, which is beneficial for effective lung-protective activity. Furthermore, the high concentration and long-term retention of sipeimine in the liver is suggestive of a strong affinity of sipeimine for the liver and low rate of hepatic clearance. In addition, the concentration of sipeimine in the brain was found to be very low, suggesting difficulties in crossing the blood–brain barrier.
Mean concentration of sipeimine in rat tissues at 15, 60, and 600 min after intragastric administration of 5 mg/kg sipeimine (n = 6, Mean ± SD).
3.4 In vitro evaluation of plasma protein binding ratio
An evaluation of the plasma protein binding ratio of a drug helps explain drug–drug interaction, pharmacodynamics, and pharmacokinetic characteristics, which are closely related to its reversible binding with plasma proteins (Yang et al., 2022). The plasma protein binding ratio affects the pharmacokinetics of unbound drugs, leading to alterations in clinical outcomes (Xiang et al., 2022). As shown in Table 2, the plasma protein binding ratio of sipeimine was found to be approximately 30%, which is considered moderate; this corroborates the pharmacokinetic characteristics of “rapid absorption and slow elimination” exhibited by sipeimine in rats. A saturation of plasma protein binding did not occur within the sipeimine concentration range of 50–1,250 nM, indicating the relatively sufficient abundance of the binding site that interacts with the plasma proteins or the moderate affinity of its molecular structure for these proteins, which is insufficient to support saturation at low concentrations. In addition, the free (unbound) drug remaining in the body following the administration of any drug is chiefly responsible for its efficacy; a moderate extent of plasma protein binding may indicate a certain concentration of free sipeimine in the body, such that a decrease in free drug concentration due to tissue distribution results in the reversible supplementation of the bound drug. This process inevitably delays the elimination of the drug from the body and prolongs the duration of drug activity, which is an important aspect in the evaluation of efficacy and safety of the active ingredient.
3.5 Identification of sipeimine metabolites
The metabolism of the active ingredient of any drug is of great significance (Peng W. et al., 2023). This study identified the metabolites of sipeimine in rat plasma and urine using UPLC–Q–TOF–MS/MS in the positive-ion mode. A comparison of the blank sample with the samples obtained after drug administration allowed the identification of sipeimine and its three metabolites, which has been explained subsequently. The most abundant of these metabolites in both rat plasma and urine was M1. Sipeimine is readily conjugated with sulfuric acid and glucose owing to the presence of the hydroxy group in the molecule, yielding the sulfated (M2) and glucose (M3) conjugates, respectively.
The parent compound sipeimine (M0) was eluted at 2.213 min and was detected as [M + H]^+^ at an m/z of 430.3325 (C_27_H_43_NO_3_ ^+^). The mass spectrum (Figure 4) demonstrated that the primary fragment ions corresponded to m/z of 412.3213, 138.1273, and 96.0798. The fragment ion at m/z 412.3213 (C_27_H_42_NO_2_, [M + H - H_2_O]^+^) resulted from the loss of H_2_O from the ion at m/z 430.3325. The fragment ion at m/z 138.1273 (C_9_H_6_N, [M + H - C_18_H_28_O_3_]^+^) was obtained by the loss of C_18_H_28_O_3_ from the precursor at m/z 430.3325; the ion detectable at m/z 96.0798 resulted from the loss of C_3_H_6_ from the ion at m/z 138.1273.
The mass spectra fragmentation of sipeimine (M0) and its metabolites (M1, M2, and M3) in rat plasma and urine after intragastric administration of 5 mg/kg sipeimine.
The retention time (t_R_) of the metabolite M1 was 2.179 min and was detected as a protonated molecular ion at m/z 446.3275 (C_27_H_43_NO_4_ ^+^), corresponding to a nominal increase in mass (16 Da) from that of sipeimine. The MS/MS spectrum (Figure 4) showed characteristic product ions at m/z 428.3165, 138.1273, and 96.0807. The fragment ion at m/z 428.3165 (C_27_H_42_NO_3_, [M + H - H_2_O]^+^) resulted from the loss of H_2_O from the ion at m/z 446.3275. Furthermore, the MS/MS spectrum was similar to that of the parent compound with respect to the ions at m/z 138.1273 and 96.0807. Therefore, M1 was identified as the hydroxylation product of sipeimine.
The metabolite M2 (t_R_ = 2.230 min) was detected as a protonated molecular ion at m/z 510.2899 (C_27_H_43_NO_6_S^+^). The difference in mass of 80 Da between sipeimine and M2 as well as the addition of the group SO_3_ indicated that M2 is the sulfate-conjugated metabolite of sipeimine. The MS/MS spectrum (Figure 4) revealed the characteristic fragment ions at m/z 412.3221 (corresponding to the loss of H_2_O and SO_3_ from the ion at m/z 510.2899) and 394.3108 (corresponding to the loss of H_2_O from the ion at m/z 412.3221). Furthermore, the MS/MS spectrum was similar to that of the parent compound with respect to the ion at m/z 138.1276. Therefore, M2 was identified as the sulfate-conjugated product of sipeimine.
The metabolite M3 (t_R_ = 2.138 min) corresponded to a molecular formula of C_33_H_53_NO_8_. The protonated molecular ion was observed at m/z 592.3878 [M + H]^+^, which is 162 Da higher than that of sipeimine. Additionally, the MS/MS spectrum (Figure 4) was identical to that of the parent drug with respect to the ions at m/z 412.3280 and 138.1308, indicating that M3 was the glucose conjugate of sipeimine. The MS/MS spectrum showed the characteristic fragment ions at m/z 574.3705 (corresponding to the loss of H_2_O from the ion at m/z 592.3878), 412.3280 (corresponding to the loss of C_6_H_10_O_5_ from the ion at m/z 574.3705), and 384.9542 (corresponding to the loss of CO from the ion at m/z 412.3221). Therefore, M3 was identified as the glucose-conjugated product of sipeimine.
3.6 Urinary and fecal excretion of sipeimine
Drugs and their metabolites are excreted from the body through excretory processes, such as through renal, and intestinal excretions. The average cumulative excretion curves is shown in Figure 5A and in Figure 5C. After orally administering 5 mg/kg sipeimine to rats, the percentage of cumulative excretion of sipeimine in relation to the administered dose was found to be 37.28% ± 9.59% in urine at 36 h, and 2.65% ± 0.70% in feces at 48 h. The urinary excretion rate of sipeimine continued to increase throughout the detection period, with a peak urinary excretion rate of 46.01 ± 13.52 μg/h at the 2–4 h time point. The excretion rate in feces initially rises slowly and then followed by a rapid increase after 12 h, reaching a peak at 12–24 h at 0.77 ± 0.53 μg/h for feces. The excretion rate is displayed in Figure 5B and in Figure 5D. These findings indicated that sipeimine could be excreted through feces and urine, with urine excretion being the main route of elimination.
Excretion of sipeimine in urine (A,B) and feces (C,D) after intragastric administration of 5 mg/kg sipeimine (n = 6, Mean ± SD).
4 Conclusion
In conclusion, the study showcases the development of a rapid, reliable, and sensitive UPLC–MS/MS method and its application for the quantitation of sipeimine in biological samples collected from rats. The pharmacokinetics, tissue distribution, metabolism, and excretion of sipeimine in rats were systemically investigated. Sipeimine exhibited the characteristics of rapid absorption in the gastrointestinal tract, slow elimination, and high oral bioavailability. Following its absorption, sipeimine was rapidly distributed in all the organs except brain. The plasma protein binding ratio of sipeimine is moderate. The metabolism of sipeimine in rats is mainly accomplished via its hydroxylation, sulfation, and glucose conjugation. The excretion of sipeimine in its original form chiefly occurs via urine. These results are expected to prove useful for the interpretation of the pharmacokinetic and pharmacodynamic characteristics of sipeimine and the traditional Chinese medicines containing sipeimine.
The reference list from the paper itself. Each links out to its DOI / PubMed record.
- 1Chan S. W.Li S. L.Lin G.Li P. (2000). Pharmacokinetic study and determination of imperialine, the major bioactive component in antitussive Fritillaria cirrhosa, in rat by high-performance liquid chromatography coupled with evaporative light-scattering detector. Anal. Biochem. 285 (1), 172–175. 10.1006/abio.2000.4756 10998280 · doi ↗ · pubmed ↗
- 2Chen L.Li D.Zhang G.Zhang W.Zhang L.Guan Y. (2015). Pharmacokinetics, tissue distribution and excretion of peimisine in rats assessed by liquid chromatography-tandem mass spectrometry. Arch. Pharm. Res. 38 (6), 1138–1146. 10.1007/s 12272-014-0434-1 25001900 · doi ↗ · pubmed ↗
- 3Chen L. H.Zhang H. M.Guan Z. Y.Zhu W. F.Yi W. J.Guan Y. M. (2013). Sex dependent pharmacokinetics, tissue distribution and excretion of peimine and peiminine in rats assessed by liquid chromatography-tandem mass spectrometry. J. Ethnopharmacol. 145 (1), 77–84. 10.1016/j.jep.2012.09.054 23123795 · doi ↗ · pubmed ↗
- 4Fang Y.Lou C.Lv J.Zhang C.Zhu Z.Hu W. (2024). Sipeimine ameliorates osteoarthritis progression by suppression of NLRP 3 inflammasome-mediated pyroptosis through inhibition of PI 3K/AKT/NF-κB pathway: an in vitro and in vivo study. J. Orthop. Transl. 46, 1–17. 10.1016/j.jot.2024.04.004 PMC 1109919938765604 · doi ↗ · pubmed ↗
- 5Huang D.Shen Z.Zhao S.Pei C.Jia N.Wang Y. (2023). Sipeimine attenuates PM 2.5-induced lung toxicity via suppression of NLRP 3 inflammasome-mediated pyroptosis through activation of the PI 3K/AKT pathway. Chem. Biol. Interact. 376, 110448. 10.1016/j.cbi.2023.110448 36898572 · doi ↗ · pubmed ↗
- 6Jeong J. S.Kim J. W.Kim J. H.Chung E. H.Ko J. W.Hwang Y. H. (2024). Investigating changes in pharmacokinetics of steroidal alkaloids from a hydroethanolic fritillariae thunbergii bulbus extract in 2,4-dinitrobenzene sulfonic acid-induced colitis rats. Pharm. (Basel) 17 (8), 1001. 10.3390/ph 17081001 PMC 1135748439204106 · doi ↗ · pubmed ↗
- 7Kumar P.Kumar V.Sharma S.Sharma R.Warghat A. R. (2024). Fritillaria steroidal alkaloids and their multi-target therapeutic mechanisms: insights from network pharmacology. Naunyn Schmiedeb. Arch. Pharmacol. 398, 2209–2228. 10.1007/s 00210-024-03502-z 39382678 · doi ↗ · pubmed ↗
- 8Li L.Sun J.Li Q.Sun K.Jiang J. (2024). Fritillaria cirrhosa D. Don alleviates inflammatory progression and suppresses M 1 polarization of macrophages in chronic obstructive pulmonary disease. Int. Arch. Allergy Immunol. 186, 243–251. 10.1159/000539755 39284286 · doi ↗ · pubmed ↗