Trends and determinants of healthcare-induced poverty in China 2013–2019
Linwei Li, Bingqing Guo, Chaojie Liu, Qiang Yao

TL;DR
This study examines how healthcare costs contribute to poverty in China and finds that targeted government programs have reduced the problem, though disparities remain.
Contribution
The study evaluates the impact of China's national health poverty alleviation project on healthcare-induced poverty using detailed household data.
Findings
Healthcare-induced poverty decreased significantly after 2016 following government interventions.
Rural and elderly populations remain particularly vulnerable to catastrophic health expenditures.
Higher income and education levels are strongly associated with lower odds of healthcare-induced poverty.
Abstract
Healthcare costs are a major driver of poverty, accounting for 44.1% of poverty cases in China. By 2015, nearly 20 million people fell into or returned to poverty due to health issues. In response, the Chinese government launched the national health poverty alleviation project in 2016. This study aims to evaluate the distribution and trends of healthcare-induced poverty from 2013 to 2019. Using data from the China Household Finance Survey (CHFS), we estimated the incidence of household catastrophic health expenditure (CHE) and impoverishing health expenditure (IHE) and analyzed their determinants through multi-level logistic regression models. Subgroup analyses were conducted based on rural/urban location, geographic region, and province. In 2013, 31.83% of households experienced CHE, while 9.56% faced IHE. CHE incidence declined significantly after 2016 [adjusted odds ratio (AOR) =…
Genes, proteins, chemicals, diseases, species, mutations and cell lines named across the full text — each resolved to its canonical identifier and authoritative record.
Click any figure to enlarge with its caption.
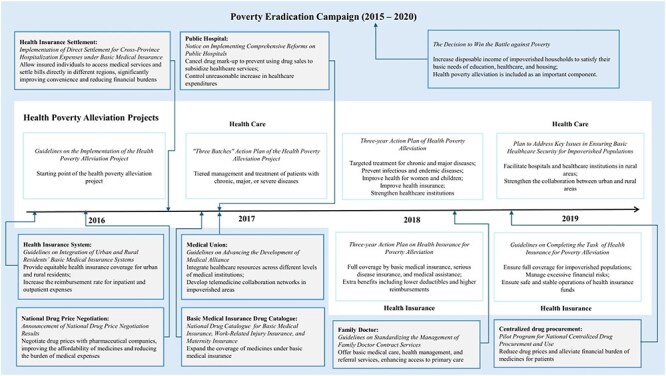 Figure 1
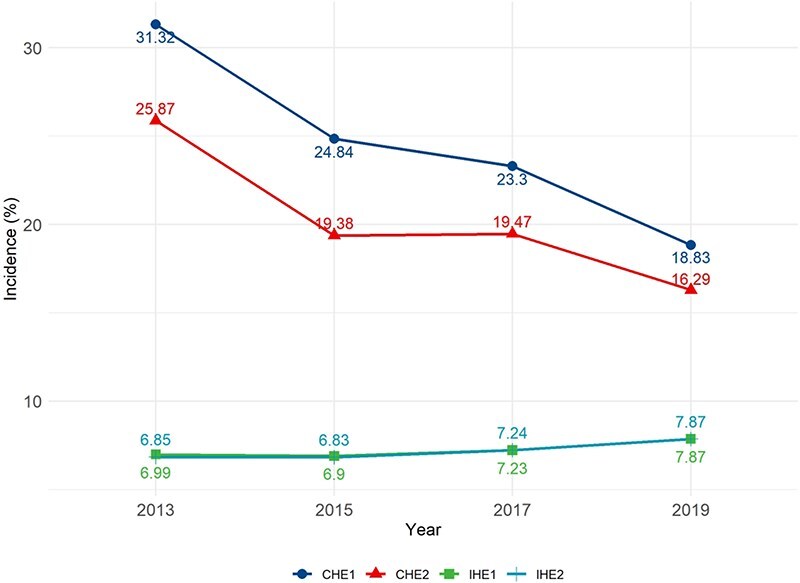 Figure 2
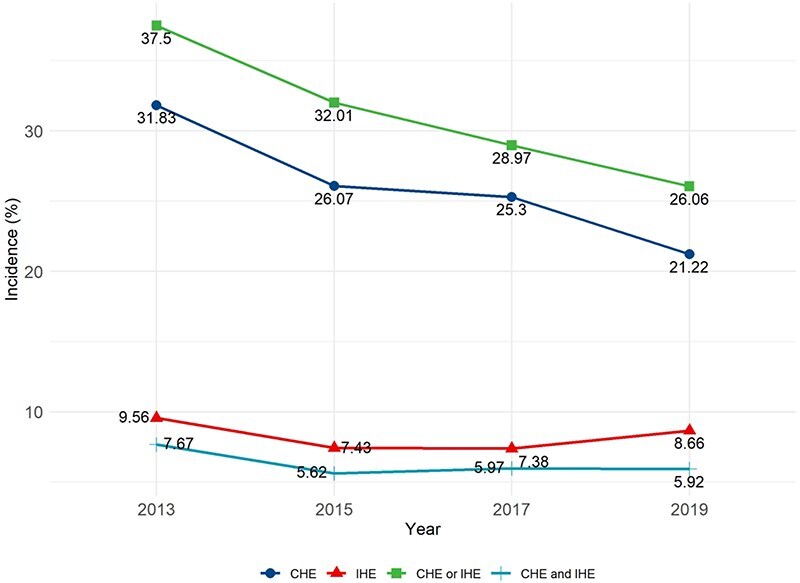 Figure 3
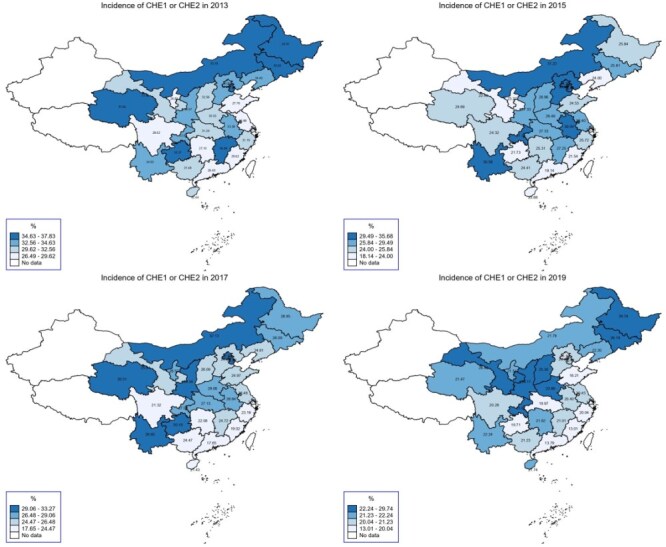 Figure 4
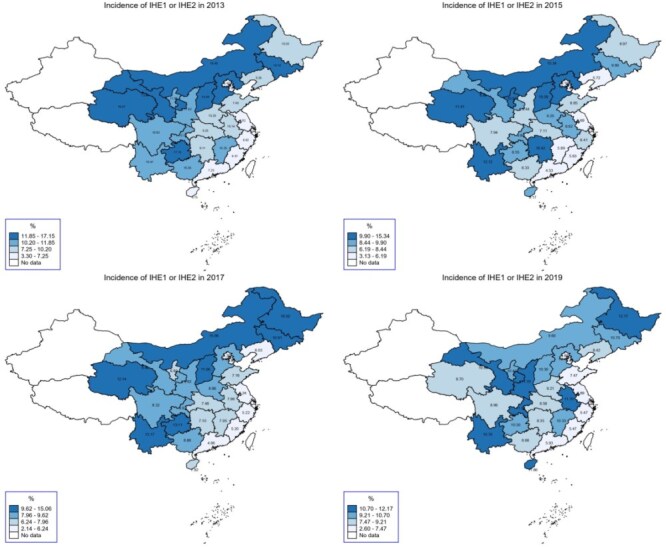 Figure 5
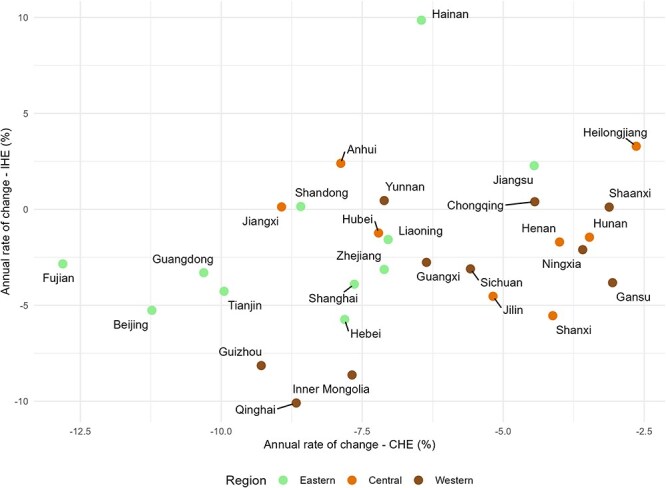 Figure 6
| Definition | Threshold | |
|---|---|---|
| CHE1 | Health expenditure ≥40% of a household’s income minus food expenditure | |
| CHE2 | Health expenditure ≥25% of total household income | |
| IHE1 | Healthcare-induced poverty against the poverty line set by the Chinese government | 2013: Ұ2 736 |
| IHE2 | Healthcare-induced poverty against the poverty line set by the World Bank | 2013: Ұ1 770 |
| Variable | Categorization |
|---|---|
| Year | 2013, 2015, 2017, 2019 |
|
| |
|
| |
| Gender of household head | Female, male |
| Age (years) of household head | <45, 45–54, 55–65, >65 |
| Household size | <3, 3, 4, >4 |
|
| |
| Educational attainment of household head | Up to primary school, junior middle school, senior middle school, tertiary education |
| Employment of household head | Unemployed, employed |
| Annual household income per capita | Quartiles within each year: lowest, lower, higher, highest |
| Basic medical insurance | (i) None: no household member covered by basic medical insurance; (ii) partial coverage: some household members, but not all, covered by basic medical insurance; (iii) full coverage by the UEBMI: all household members covered by the basic medical insurance for urban employees; (iv) full coverage by the URRBMI: all household members covered by the basic medical insurance for urban and rural residents; (v) full mixed coverage: all household members covered by basic medical insurance, but with different types. |
| Commercial medical insurance | No, yes |
| Households with age pension for employees | Household members aged ≥60 years covered by age pension for employees (no, yes) |
| Residency | Urban, rural |
|
| |
| Household with elderly | Household with members aged ≥60 years (no, yes) |
| Household with children | Household with members aged ≤5 years (no, yes) |
| Number of members in poor health | Household members with self-rated poor or very poor health (0, 1, >1) |
|
| |
| Health expenditure per capita | Continuous variable, per capita total health expenditure by province |
| Percentage of total government expenditure on health | Continuous variable, proportion of government health expenditure in total health expenditure by province |
| Number of beds in medical institutions per 1000 population | Continuous variable, number of health institution beds per 1000 population by province |
| Annual hospitalization rate | Continuous variable, annual hospitalization rate by province |
| Average number of doctor visits by residents | Continuous variable, annual average number of doctor visits per resident by province |
| Variable | 2013 | 2015 | 2017 | 2019 | ||||
|---|---|---|---|---|---|---|---|---|
|
| % |
| % |
| % |
| % | |
|
| 28 141 | 37 289 | 40 011 | 34 643 | ||||
|
| ||||||||
| Gender | ||||||||
| Female | 6 843 | 24.32 | 9 133 | 24.49 | 8 272 | 20.67 | 8 540 | 24.65 |
| Male | 21 297 | 75.68 | 28 156 | 75.51 | 31 738 | 79.33 | 26 103 | 75.35 |
| Age (years) | ||||||||
| <45 | 9 485 | 33.71 | 10 440 | 28.00 | 9 187 | 22.96 | 6 767 | 19.53 |
| 45–54 | 7 022 | 24.95 | 9 826 | 26.35 | 10 495 | 26.23 | 8 708 | 25.14 |
| 55–65 | 6 788 | 24.12 | 9 355 | 25.09 | 10 441 | 26.10 | 9 614 | 27.75 |
| >65 | 4 846 | 17.22 | 7 668 | 20.56 | 9 888 | 24.71 | 9 554 | 27.58 |
|
| ||||||||
| Household size | ||||||||
| <3 | 8 168 | 29.03 | 10 663 | 28.60 | 16 169 | 40.41 | 15 531 | 44.83 |
| 3 | 8 113 | 28.83 | 10 110 | 27.11 | 10 051 | 25.12 | 7 806 | 22.53 |
| 4 | 5 257 | 18.68 | 6 844 | 18.35 | 6 112 | 15.28 | 5 086 | 14.68 |
| >4 | 6 603 | 23.46 | 9 672 | 25.94 | 7 679 | 19.19 | 6 220 | 17.95 |
|
| ||||||||
| Educational attainment | ||||||||
| Up to primary school | 8 622 | 30.65 | 11 829 | 31.77 | 12 575 | 31.47 | 11 177 | 32.30 |
| Junior middle school | 9 233 | 32.83 | 12 180 | 32.71 | 13 237 | 33.13 | 11 898 | 34.38 |
| Senior middle school | 5 615 | 19.96 | 7 281 | 19.55 | 7 793 | 19.50 | 6 607 | 19.09 |
| Tertiary education | 4 657 | 16.56 | 5 947 | 15.97 | 6 353 | 15.90 | 4 922 | 14.22 |
| Employment | ||||||||
| Unemployed | 9 184 | 32.65 | 13 071 | 35.17 | 15 345 | 38.37 | 752 | 20.18 |
| Employed | 1 8945 | 67.35 | 24 098 | 64.83 | 24 651 | 61.63 | 2 975 | 79.82 |
|
| ||||||||
| Annual household income per capita | ||||||||
| Lowest quintile | 7 035 | 25.00 | 9 338 | 25.04 | 10 004 | 25.00 | 8 661 | 25.00 |
| Lower | 7 058 | 25.08 | 9 314 | 24.98 | 10 003 | 25.00 | 8 660 | 25.00 |
| Higher | 7 013 | 24.92 | 9 338 | 25.04 | 10 002 | 25.00 | 8 662 | 25.00 |
| Highest quintile | 7 035 | 25.00 | 9 299 | 24.94 | 10 002 | 25.00 | 8 660 | 25.00 |
| Basic medical insurance | ||||||||
| None | 2 429 | 8.64 | 2 455 | 6.58 | 1 631 | 4.08 | 1 292 | 3.73 |
| Partial coverage | 19 531 | 69.44 | 11 684 | 31.33 | 6 627 | 16.56 | 4 625 | 13.35 |
| Full coverage by UEBMI | 2 064 | 7.34 | 3 817 | 10.24 | 5 171 | 12.92 | 4 388 | 12.67 |
| Full coverage by URRBMI | 3 006 | 10.69 | 14 180 | 38.03 | 19 086 | 47.70 | 17 904 | 51.68 |
| Full coverage by mixed | 1 098 | 3.90 | 5 153 | 13.82 | 7 496 | 18.73 | 6 434 | 18.57 |
| Commercial medical insurance | ||||||||
| No | 26 557 | 94.37 | 35 346 | 94.79 | 37 929 | 94.80 | 32 366 | 93.43 |
| Yes | 1 584 | 5.63 | 1 943 | 5.21 | 2 082 | 5.20 | 2 277 | 6.57 |
| Age pension for employees | ||||||||
| No | 24 092 | 85.61 | 30 614 | 82.10 | 31 581 | 78.93 | 27 925 | 80.61 |
| Yes | 4 049 | 14.39 | 6 675 | 17.90 | 8 430 | 21.07 | 6 718 | 19.39 |
| Residency | ||||||||
| Urban | 19 209 | 68.26 | 25 635 | 68.75 | 27 279 | 68.18 | 22 307 | 64.39 |
| Rural | 8 932 | 31.74 | 11 654 | 31.25 | 12 732 | 31.82 | 12 336 | 35.61 |
|
| ||||||||
| Household with elderly | ||||||||
| Yes | 12 920 | 45.91 | 19 225 | 51.56 | 21 958 | 54.88 | 19 603 | 56.59 |
| No | 15 221 | 54.09 | 18 064 | 48.44 | 18 053 | 45.12 | 15 040 | 43.41 |
| Household with children | ||||||||
| Yes | 4 075 | 14.48 | 4 981 | 13.36 | 4 588 | 11.47 | 3 649 | 10.53 |
| No | 24 066 | 85.52 | 32 308 | 86.64 | 35 423 | 88.53 | 30 994 | 89.47 |
| Number of members in poor health | ||||||||
| 0 | 9 947 | 35.35 | 25 973 | 69.65 | 26 692 | 66.71 | 22 664 | 65.42 |
| 1 | 8 560 | 30.42 | 7 763 | 20.82 | 8 641 | 21.60 | 7 468 | 21.56 |
| >1 | 9 634 | 34.23 | 3 553 | 9.53 | 4 678 | 11.69 | 4 511 | 13.02 |
|
|
| Mean ± SD |
| Mean ± SD |
| Mean ± SD |
| Mean ± SD |
| Health expenditure per capita | 29 | 2 346.46 | 29 | 2 912.00 | 29 | 3 795.71 | 29 | 4 475.44 |
| Percentage of total government expenditure on health (%) | 29 | 30.31 | 29 | 29.40 | 29 | 29.14 | 29 | 28.40 |
| Number of hospital beds per 1000 population | 29 | 4.28 | 29 | 4.83 | 29 | 5.37 | 29 | 6.00 |
| Annal hospitalization rate (%) | 29 | 12.80 | 29 | 14.43 | 29 | 15.93 | 29 | 17.74 |
| Annal average number of medical visits | 29 | 5.32 | 29 | 5.80 | 29 | 6.03 | 29 | 5.97 |
| CHE1 using WHO threshold | CHE2 using SDGs threshold | CHE1 or CHE2 | ||||
|---|---|---|---|---|---|---|
| Model 1 | Model 2 | Model 3 | ||||
| Variable (reference) | AOR |
| AOR |
| AOR |
|
|
| ||||||
| 2015 | 0.968 | 0.395 | 0.961 | 0.399 | 1.014 | 0.719 |
| 2017 | 0.699 | <0.001 | 0.775 | 0.004 | 0.766 | <0.001 |
| 2019 | 0.437 | <0.001 | 0.468 | <0.001 | 0.493 | <0.001 |
|
| ||||||
| Gender (female) | ||||||
| Male | 1.019 | 0.327 | 1.017 | 0.401 | 1.017 | 0.367 |
| Age (<45 years) | ||||||
| 45–54 | 1.320 | <0.001 | 1.304 | <0.001 | 1.304 | <0.001 |
| 55–65 | 1.482 | <0.001 | 1.427 | <0.001 | 1.450 | <0.001 |
| >65 | 2.222 | <0.001 | 2.025 | <0.001 | 2.175 | <0.001 |
|
| ||||||
| Household size (<3) | ||||||
| 3 | 0.673 | <0.001 | 0.700 | <0.001 | 0.684 | <0.001 |
| 4 | 0.609 | <0.001 | 0.632 | <0.001 | 0.624 | <0.001 |
| >4 | 0.556 | <0.001 | 0.601 | <0.001 | 0.577 | <0.001 |
|
| ||||||
| Educational attainment (up to primary school) | ||||||
| Junior middle school | 0.883 | <0.001 | 0.876 | <0.001 | 0.879 | <0.001 |
| Senior middle school | 0.826 | <0.001 | 0.844 | <0.001 | 0.818 | <0.001 |
| Tertiary education | 0.675 | <0.001 | 0.694 | <0.001 | 0.681 | <0.001 |
| Employment (unemployment) | ||||||
| Employed | 0.690 | <0.001 | 0.700 | <0.001 | 0.708 | <0.001 |
|
| ||||||
| Annual household income per capita (lowest quintile) | ||||||
| Lower | 0.954 | 0.025 | 0.981 | 0.384 | 0.946 | 0.007 |
| Higher | 0.863 | <0.001 | 0.915 | <0.001 | 0.860 | <0.001 |
| Highest quintile | 0.819 | <0.001 | 0.971 | 0.321 | 0.834 | <0.001 |
| Basic medical insurance (full coverage by UEBMI) | ||||||
| None | 0.897 | 0.010 | 0.918 | 0.062 | 0.909 | 0.023 |
| Partial coverage | 0.913 | 0.007 | 0.992 | 0.826 | 0.919 | 0.011 |
| Full coverage by URRBMI | 0.921 | 0.010 | 1.005 | 0.896 | 0.944 | 0.072 |
| Full coverage by mixed | 0.906 | 0.003 | 0.983 | 0.629 | 0.924 | 0.018 |
| commercial medical insurance (No) | ||||||
| Yes | 0.797 | <0.001 | 0.800 | <0.001 | 0.797 | <0.001 |
| Age pension for employees (no) | ||||||
| Yes | 1.267 | <0.001 | 1.149 | <0.001 | 1.259 | <0.001 |
| Residency (urban) | ||||||
| Rural | 1.154 | <0.001 | 1.286 | <0.001 | 1.199 | <0.001 |
|
| ||||||
| Household with elderly (no) | ||||||
| Yes | 1.325 | <0.001 | 1.410 | <0.001 | 1.336 | <0.001 |
| Household with children (no) | ||||||
| Yes | 1.210 | <0.001 | 1.202 | <0.001 | 1.210 | <0.001 |
| Number of members in poor self-rated health (0) | ||||||
| 1 | 2.415 | <0.001 | 2.663 | <0.001 | 2.455 | <0.001 |
| >1 | 3.757 | <0.001 | 4.189 | <0.001 | 3.838 | <0.001 |
|
| ||||||
| Health expenditure per capita | 1.348 | 0.032 | 1.232 | 0.280 | 1.346 | 0.034 |
| Percentage of total government expenditure on health | 0.997 | 0.535 | 0.990 | 0.128 | 0.996 | 0.426 |
| Number of hospital beds per 1000 population | 0.901 | 0.036 | 0.902 | 0.083 | 0.932 | 0.149 |
| Annal hospitalization rate | 1.015 | 0.270 | 1.038 | 0.056 | 1.012 | 0.396 |
| Average number of medical visits per resident | 0.985 | 0.519 | 0.949 | 0.058 | 0.975 | 0.264 |
| Model statistics | ||||||
| LR test ( | 0.000 | 0.000 | 0.000 | |||
| AIC | 106 040.657 | 95 621.818 | 108 881.773 | |||
| IHE1 using China poverty line | IHE2 using World Bank poverty line | IHE1 or IHE2 | ||||
|---|---|---|---|---|---|---|
| Model 1 | Model 2 | Model 3 | ||||
| Variable (reference) | AOR |
| AOR |
| AOR |
|
|
| ||||||
| 2015 | 1.795 | <0.001 | 2.413 | <0.001 | 1.580 | <0.001 |
| 2017 | 0.612 | <0.001 | 0.910 | 0.198 | 0.465 | <0.001 |
| 2019 | 0.711 | 0.019 | 0.945 | 0.682 | 0.607 | <0.001 |
|
| ||||||
| Gender (female) | ||||||
| Male | 0.949 | 0.159 | 0.961 | 0.281 | 0.961 | 0.280 |
| Age (<45 years) | ||||||
| 45–54 | 1.045 | 0.376 | 1.032 | 0.524 | 1.045 | 0.357 |
| 55–65 | 0.999 | 0.988 | 0.995 | 0.923 | 1.009 | 0.861 |
| >65 | 1.247 | <0.001 | 1.227 | 0.001 | 1.255 | <0.001 |
|
| ||||||
| Household size (<3) | ||||||
| 3 | 0.537 | <0.001 | 0.533 | <0.001 | 0.530 | <0.001 |
| 4 | 0.417 | <0.001 | 0.419 | <0.001 | 0.422 | <0.001 |
| >4 | 0.335 | <0.001 | 0.340 | <0.001 | 0.335 | <0.001 |
|
| ||||||
| Educational attainment (up to primary school) | ||||||
| Junior middle school | 0.933 | 0.058 | 0.925 | 0.032 | 0.926 | 0.030 |
| Senior middle school | 0.935 | 0.166 | 0.923 | 0.098 | 0.913 | 0.053 |
| Tertiary education | 0.785 | 0.001 | 0.778 | 0.001 | 0.769 | <0.001 |
| Employment (unemployment) | ||||||
| Employed | 0.601 | <0.001 | 0.593 | <0.001 | 0.610 | <0.001 |
|
| ||||||
| Annual household income per capita (lowest quintile) | ||||||
| Lower | 0.141 | <0.001 | 0.148 | <0.001 | 0.104 | <0.001 |
| Higher | 0.042 | <0.001 | 0.049 | <0.001 | 0.031 | <0.001 |
| Highest quintile | 0.024 | <0.001 | 0.028 | <0.001 | 0.017 | <0.001 |
| Basic medical insurance (full coverage by UEBMI) | ||||||
| None | 0.812 | 0.030 | 0.840 | 0.065 | 0.799 | 0.016 |
| Partial coverage | 1.001 | 0.991 | 0.992 | 0.917 | 0.978 | 0.770 |
| Full coverage by URRBMI | 1.105 | 0.183 | 1.098 | 0.214 | 1.045 | 0.558 |
| Full coverage by mixed | 0.937 | 0.419 | 0.928 | 0.360 | 0.93 | 0.367 |
| commercial medical insurance (no) | ||||||
| Yes | 1.083 | 0.361 | 1.005 | 0.952 | 1.043 | 0.623 |
| Age pension for employees (no) | ||||||
| Yes | 0.872 | 0.014 | 0.865 | 0.010 | 0.879 | 0.020 |
| Residency (urban) | ||||||
| Rural | 1.075 | 0.044 | 1.052 | 0.158 | 1.093 | 0.011 |
|
| ||||||
| Household with elderly (no) | ||||||
| Yes | 1.270 | <0.001 | 1.198 | <0.001 | 1.237 | <0.001 |
| Household with children (no) | ||||||
| Yes | 1.05 | 0.383 | 1.014 | 0.798 | 1.059 | 0.277 |
| Number of members in poor self-rated health (0) | ||||||
| 1 | 2.883 | <0.001 | 2.909 | <0.001 | 2.809 | <0.001 |
| >1 | 4.243 | <0.001 | 4.282 | <0.001 | 4.137 | <0.001 |
|
| ||||||
| Health expenditure per capita | 1.726 | 0.001 | 1.567 | 0.001 | 1.610 | 0.001 |
| Percentage of total government expenditure on health | 1.015 | 0.001 | 1.017 | <0.001 | 1.016 | <0.001 |
| Number of hospital beds per 1000 population | 1.060 | 0.375 | 1.100 | 0.100 | 1.073 | 0.259 |
| Annal hospitalization rate | 0.983 | 0.255 | 0.976 | 0.070 | 0.981 | 0.169 |
| Average number of medical visits per resident | 0.963 | 0.147 | 0.983 | 0.454 | 0.975 | 0.293 |
| Model statistics | ||||||
| LR test ( | 0.000 | 0.000 | 0.000 | |||
| AIC | 61 001.914 | 33 179.624 | 153 457.674 | |||
| CHE or IHE | CHE and IHE | |||
|---|---|---|---|---|
| Model 5 | Model 6 | |||
| Variable (reference) | AOR |
| AOR. |
|
|
| ||||
| 2015 | 1.143 | 0.001 | 1.382 | <0.001 |
| 2017 | 0.648 | <0.001 | 0.599 | <0.001 |
| 2019 | 0.476 | <0.001 | 0.527 | <0.001 |
|
| ||||
| Gender (female) | ||||
| Male | 1.026 | 0.190 | 0.941 | 0.112 |
| Age (<45 years) | . | |||
| 45–54 | 1.264 | <0.001 | 1.208 | 0.001 |
| 55–65 | 1.386 | <0.001 | 1.205 | 0.001 |
| >65 | 2.086 | <0.001 | 1.601 | <0.001 |
|
| ||||
| Household size (<3) | ||||
| 3 | 0.652 | <0.001 | 0.540 | <0.001 |
| 4 | 0.588 | <0.001 | 0.412 | <0.001 |
| >4 | 0.528 | <0.001 | 0.354 | <0.001 |
|
| ||||
| Educational attainment (up to primary school) | . | |||
| Junior middle school | 0.884 | <0.001 | 0.899 | 0.004 |
| Senior middle school | 0.837 | <0.001 | 0.834 | <0.001 |
| Tertiary education | 0.705 | <0.001 | 0.609 | <0.001 |
| Employment (unemployment) | ||||
| Employed | 0.685 | <0.001 | 0.599 | <0.001 |
|
| ||||
| Annual household income per capita (lowest quintile) | ||||
| Lower | 0.197 | <0.001 | 0.232 | <0.001 |
| Higher | 0.168 | <0.001 | 0.079 | <0.001 |
| Highest quintile | 0.158 | <0.001 | 0.050 | <0.001 |
| Basic medical insurance (full coverage by UEBMI) | ||||
| None | 0.953 | 0.276 | 0.861 | 0.131 |
| Partial coverage | 0.919 | 0.012 | 1.052 | 0.526 |
| Full coverage by URRBMI | 0.903 | 0.002 | 1.161 | 0.055 |
| Full coverage by mixed | 0.914 | 0.008 | 1.006 | 0.943 |
| commercial medical insurance (no) | ||||
| Yes | 0.834 | <0.001 | 0.928 | 0.455 |
| Age pension for employees (no) | ||||
| Yes | 1.252 | <0.001 | 0.833 | 0.001 |
| Residency (urban) | ||||
| Rural | 1.187 | <0.001 | 1.125 | 0.001 |
|
| ||||
| Household with elderly (no) | ||||
| Yes | 1.307 | <0.001 | 1.323 | <0.001 |
| Household with children (no) | ||||
| Yes | 1.194 | <0.001 | 1.021 | 0.728 |
| Number of members in poor self-rated health (0) | ||||
| 1 | 2.510 | <0.001 | 3.160 | <0.001 |
| >1 | 3.862 | <0.001 | 4.803 | <0.001 |
|
| ||||
| Health expenditure per capita | 1.529 | 0.003 | 1.377 | 0.022 |
| Percentage of total government expenditure on health | 1.001 | 0.852 | 1.017 | <0.001 |
| Number of hospital beds per 1000 population | 0.899 | 0.038 | 1.118 | 0.057 |
| Annal hospitalization rate | 1.019 | 0.190 | 0.969 | 0.018 |
| Average number of medical visits per resident | 0.971 | 0.196 | 0.988 | 0.587 |
| Model statistics | ||||
| LR test ( | 0.000 | 0.000 | ||
| AIC | 95 143.513 | 31 173.933 | ||
- —China Scholarship Council10.13039/501100004543
- —National Natural Science Foundation of China10.13039/501100001809
- —China Scholarship Council10.13039/501100004543
- —National Natural Science Foundation of China10.13039/501100001809
Peer Reviews
No public reviews on file for this paper yet. If you reviewed it on a platform where reviews are public (OpenReview, ICLR, NeurIPS, ICML), you can paste yours below so the community can read it here.
Videos
No videos yet. Explain this paper in a talk, walkthrough, or lecture? Add one.
Taxonomy
TopicsHealthcare Systems and Reforms · Global Health Care Issues · Global Maternal and Child Health
Introduction
Poverty has always been a global concern. The United Nations (UN) established 17 sustainable development goals (SDGs) to be achieved by 2030, with poverty eradication as the primary objective (United Nations 2015). Health and healthcare services have an impact on poverty through multiple pathways. Poor health can diminish an individual’s ability to earn income, thereby increasing the risk of poverty (Li et al. 2023). High out-of-pocket health expenditure can lead to financial hardship when it exceeds a certain threshold of a household’s consumption or income (Sirag and Mohamed Nor 2021). Additionally, poor health itself is regarded as a form of poverty resulting in capability deprivation (Deng et al. 2015). The UN emphasized the importance of health services in achieving the goal of ending poverty and further reaffirmed that universal health coverage would be beneficial to long-term economic development (World Health Organization 2023). Empirical evidence shows that the transfer of a productive asset, food, or cash had potentially positive effects on the health of extremely poor people in six developing countries (Banerjee et al. 2015).
Preventing healthcare-induced poverty is a critical global policy objective aligned with the SDGs. Efforts to alleviate poverty generally focus on three key approaches: improving healthcare utilization, reducing out-of-pocket health expenditure, and providing financial support to impoverished populations. Enhancing healthcare utilization helps improve health outcomes among disadvantaged groups, addressing healthcare-induced poverty at its root. For example, India’s Ayushman Bharat program established 150 000 health and wellness centers in impoverished areas to ensure access to essential healthcare services (Bhargava and Paul 2022). Mexico established the Seguro Popular, a health insurance program with no premium requirements for low-income families (Parker et al. 2018). Indonesia (Agustina et al. 2019) and Thailand (Sumriddetchkajorn et al. 2019) have developed comprehensive programs to mitigate healthcare-induced poverty, with a particular focus on disadvantaged populations.
Healthcare-induced poverty (referred to as health poverty) has been a severe problem in China. In total, 44.1% of China’s poverty was observed to be caused by diseases, and nearly 20 million people fell into or returned to poverty due to health problems, of whom 3.3 million suffered from serious illnesses and 4 million suffered from long-term chronic conditions (State Council 2018a). In 2016, China’s National Health and Family Planning Commission launched the national health poverty alleviation project, requiring all provinces to implement it (State Council 2016c). This initiative aimed to ensure that impoverished populations had access to essential healthcare services while preventing other households from falling into poverty due to illness. The health poverty alleviation project became a key component of the Healthy China Initiative and the broader poverty eradication campaign. Targeting disadvantaged populations and regions, its main actions included strengthening financial protection related to healthcare, controlling health expenditure for severe illnesses, providing treatment for chronic diseases, and enhancing healthcare service delivery (State Council, 2016c).
Multiple policies were developed under the health poverty alleviation project and the broader poverty eradication campaign (Fig. 1). The health poverty alleviation project aims to reduce healthcare expenditure by reinforcing financial protection, improving disease management and treatment (National Health Commission 2017a), and strengthening healthcare infrastructure in impoverished regions (State Council 2019c). Universal social health insurance coverage, along with additional medical assistance for low-income populations—such as lower deductibles and higher reimbursement rates—plays a crucial role in this initiative (State Council 2018c, State 2019a). Beyond health insurance reforms (MOHRSS 2016, State Council 2016b), several complementary reforms were introduced, including those targeting hospitals (National Health Commission 2017b), healthcare alliance (State Council 2017), family doctors (State Council 2018b), drug price negotiation (National Health Commission 2016), and centralized drug procurement (State Council 2019b). These measures collectively aim to alleviate the financial burden of healthcare. Meanwhile, the broader poverty eradication campaign expanded its efforts by providing comprehensive economic support to impoverished households, increasing their disposable income to meet essential needs (State Council 2015). These initiatives have been implemented across various sectors, including agriculture, tourism, vocational education, and employment services (State Council 2016a). Detailed information on the mentioned policies can be found in Appendix 1 (see online supplementary material).
Major policies relevant to health poverty alleviation.
Extensive studies have examined the incidence of catastrophic health expenditure (CHE) and impoverishing health expenditure (IHE) in China (Ma et al. 2019, Zhao et al. 2020, Jia et al. 2023), the two key indicators of health poverty alleviation efforts. However, there is a notable gap in the literature regarding changes in CHE and IHE during the critical period of China’s poverty eradication campaign (2015–2020). Existing studies either fall outside this pivotal timeframe (Ma et al. 2019, Zhao et al. 2020) or provide only a cross-sectional view without tracking trends over time (Jia et al. 2023). Additionally, few studies compare regional variations (Chen and J 2019, Lu et al. 2021) or population differences (Ma et al. 2020, Qin et al. 2021), limiting their relevance for policy action.
Our research addresses gaps in the literature by analyzing trends in healthcare-induced poverty, covering the period of the health poverty alleviation project, and examining regional variations and population differences. Unlike previous studies, we estimate both CHE and IHE indicators to capture the multidimensional nature of health poverty. By linking findings to household- and provincial-level factors over time, this study provides a comprehensive assessment of health poverty, offering insights into targeted interventions and sustainable poverty reduction strategies.
Methods
Data sources
The household-level data were obtained from the China Household Finance Survey (CHFS), a nationally conducted project by the Survey and Research Centre for China Household Finance. It employed a multi-stage stratified sampling strategy to recruit study participants, covering 29 out of the 34 provinces/regions in China (Southwestern University Of Finance and Economics 2022). A total of 140 084 household responses were valid for data analysis: 28 141 from 2013, 37 289 from 2015, 40 011 from 2017, and 34 643 from 2019.
The provincial-level data were extracted from the China Health Statistical Yearbooks (2013–2019) (National Health Commission 2023) and the China Statistical Yearbooks (2013–2019) (National Bureau Of Statistics 2023). They were matched to each household according to the year and location of the surveyed household.
Variables
Dependent variables
CHE proposed by the World Health Organization (WHO) defines out-of-pocket health expenditure as catastrophic when it equals or exceeds 40% of a household’s non-subsistence income (i.e. income available after basic needs have been met) (Xu et al. 2005). The UN SDGs define CHE as out-of-pocket health expenditure greater than 10% or 25% of total household expenditure or income (United Nations 2023).
IHE measures household consumption per capita against the poverty line: it pushes household consumption per capita from above the poverty line to below it after subtracting per capita out-of-pocket health expenditure (Grépin et al. 2020). The choice of the poverty line is often contextualized.
This study utilized both CHE and IHE to measure health poverty. We applied the CHE definitions from the WHO and the UN SDGs. IHE was estimated using both the international poverty line and the China poverty line (Table 1).
Supplementary Table S1, see online supplementary material, provides detailed information on the measurement and data sources for household consumption, income, and health expenditure.
Independent and control variables
‘Year’ was introduced in the statistical modelling as an independent variable to measure trends. China initiated a poverty eradication campaign in 2015 and subsequently the health poverty alleviation project in 2016. The data (2013–2019) used in this study covered the time periods before and after the poverty eradication campaign and the health poverty alleviation project.
Both household- and provincial-level factors were considered in the statistical modeling. The selection of household-level variables was guided by Andersen’s Behavioral Model of Health Services Use, a widely used theoretical framework for explaining the determinants of CHE (Brinda et al. 2014). This model categorizes the determinants of health service utilization into predisposing, enabling, and need factors. Following recent systematic reviews (Borde et al. 2022, Eze et al. 2022) and aligning with Andersen’s model, this study measured the following predictors of health poverty. (i) Predisposing factors—gender and age of the household head, and household size. (ii) Enabling factors—educational attainment and employment status of the household head, annual income per capita, coverage by different types of health insurance, coverage by pension insurance for the elderly, and the household’s regional and urban/rural location. (III) Need factors—the number of household members with self-rated poor health and the presence of household members with high healthcare needs, such as children or the elderly (Wang et al. 2024) (Table 2).
The provincial-level variables included average health expenditure per capita, the governmental share of total health expenditure, hospital beds per 1000 population, the annual hospitalization rate, and the average number of medical visits per person per year. These variables capture both the demand and supply aspects of healthcare services (Eze et al. 2022, Topmiller et al. 2023).
Statistical analysis
The incidence of CHE and IHE was calculated for the entire sample and for subgroups to assess disparities in their distribution and identify which groups experienced the most significant changes during the study period (2013–2019).
Multilevel logistic regression models were established to determine the associations of household- and provincial-level factors with the incidence of CHE and IHE. The household samples in this study are distributed across 29 provincial administrative units, with each provincial unit comprising a sample of households ranging from 687 to 1528 and forming a two-level data structure.
We assessed the variance inflation factor for all predictors and confirmed the absence of multicollinearity (all variance inflation factor < 5) (O’Brien 2007).
An empty model was established first to determine the provincial cluster effects using likelihood ratio (LR) tests. The P-value of the LR test for the empty model for both CHE and IHE was <0.001, indicating the necessity of an unconstrained multilevel model (Peugh 2010).
We established two-level logistic regression models for CHE and IHE, respectively. The Akaike Information Criterion for the two-level CHE and IHE models was consistently lower than that of their corresponding empty model, indicating the appropriateness of the two-level models. In this study, we did not examine the correlations between household and provincial variables.
Stata 16.0 IC was used in the statistical analyses.
Results
Characteristics of respondents
More than three-quarters of household heads were male; around half were >55 years old; ∼15% had a university degree; and >60% were employed. Around 40% of households had three or four members; half had a member >60 years old; <15% had a child (Table 3).
The majority (≥65%) of households were located in urban areas. Coverage of basic medical insurance increased over time, with > 96% of households having at least one insured member by 2019. However, <7% of households purchased commercial health insurance. Less than 20% of households with elderly members received an age pension for employees. The average annual household income per capita reached 27 649 Yuan. Across most years, <35% of household members self-rated their health as poor, except in 2013, when this figure was 64% (Table 3).
At the provincial level, health expenditure per capita almost doubled from 2013 to 2019. The proportion of government expenditure in total health expenditure remained stable at ∼30%. Hospital beds per 1000 population increased slightly by 1.72%. The annual hospitalization rate rose from 12.8% to 17.7% over the study period, while the annual number of medical visits per resident showed a slight increase, rising from 5.32 to 5.97 (Table 3).
Trend of CHE and IHE
From 2013 to 2019, the incidence of CHE decreased despite an increase in healthcare service volumes: it decreased from 31.32% in 2013 to 18.83% in 2019 as measured by the WHO threshold and from 25.87% in 2013 to 16.29% in 2019 as measured by the UN SDGs threshold (Fig. 2).
Incidence of CHE and IHE over the period from 2013 to 2019.
From 2013 to 2019, the incidence of IHE increased slightly: it increased from 6.99% in 2013 to 7.87% in 2019 against the China poverty line and from 6.85% in 2013 to 7.87% in 2019 against the international poverty line (Fig. 2).
If we include both households with CHE or IHE, the declining trend over time persisted: 37.50% of households incurred either CHE or IHE in 2013, compared with 26.06% in 2019 (Fig. 3).
Incidence of CHE and/or IHE over the period from 2013 to 2019.
Inequalities existed in the decline of health poverty, with the most significant reduction (9.99%–10.95%) observed among households in the highest income quartile. In contrast, households with more than one member reporting poor self-rated health experienced an increase in health poverty (0.32%–6.90%) (Table S2, see online supplementary material).
The eastern developed region had a lower incidence of CHE and IHE compared to the central and western regions ([Figs 4 and 5](#F4 F5)). Within the eastern developed region, Fujian and Shanghai recorded the lowest incidence of CHE (13.01%) and IHE (2.60%) in 2019, whereas Heilongjiang, from the central developing region, had the highest incidence of CHE (29.74%) and IHE (12.17%) in the same year.
Incidence of CHE by province from 2013 to 2019.
Incidence of IHE by provinces from 2013 to 2019.
Households in urban areas (6.81%) and the eastern developed region (8.31%) experienced the greatest reductions in CHE, while those in rural areas (2.95%) and the western underdeveloped region (6.81%) saw the most significant decreases in IHE (Table S3, see online supplementary material). Among provinces, Heilongjiang (central developing region) exhibited the lowest annual change in CHE (2.64%), whereas Fujian (eastern developed region) showed the highest (12.81%). Hainan, also in the eastern developed region, experienced a concerning rise in IHE at a rate of 9.86%, whereas Qinghai (western underdeveloped region) recorded the largest decline (10.09%) in IHE (Fig. 6).
Annual rates of changes in incidence of CHE and IHE by province from 2013 to 2019.
Lower annual change rates were associated with higher incidences of CHE and IHE (Figs S1 and S2, respectively, see online supplementary material) in 2019.
Factors associated with CHE
The regression models indicated that there was no decline in the incidence of CHE measured by the WHO threshold between 2013 and 2015 (P > 0.05) before the launch of the health poverty alleviation project. However, a significant decline has been observed since the project’s initiation in 2016. The odds of CHE measured by the WHO threshold decreased by 30.1% [adjusted odds ratio (AOR) = 0.699, P < 0.001] in 2017 and 56.3% (AOR = 0.437, P < 0.001) in 2019, respectively, compared with the CHE level in 2013. Similarly, the odds of CHE measured by the UN SDGs threshold decreased by 22.5% (AOR = 0.775, P < 0.01) in 2017 and 53.2% (AOR = 0.468, P < 0.001) in 2019, respectively, compared with the CHE level in 2013 (Table 4).
Higher educational attainment (AOR = 0.675–0.883, P < 0.001) and employment of household head (AOR = 0.690–0.700, P < 0.001), larger household size (AOR = 0.556–0.700, P < 0.01), and higher household income (AOR = 0.819–0.915, P < 0.01) were protective factors against CHE. While commercial insurance was associated with lower odds (AOR = 0.797–0.800, P < 0.001) of CHE, households covered entirely by the Urban Employee Basic Medical Insurance (UEBMI), the most prestigious social health insurance program (with higher funding pools and entitlements), and households with elderly members covered by pension insurance for employees (the most generous pension fund) had higher odds of CHE than others (Table 4).
Older age of household head (AOR = 1.304–2.222, P < 0.001), rural location (AOR = 1.154–1.286, P < 0.001), household with elderly (AOR = 1.325–1.410, P < 0.001) or children (AOR = 1.202–1.210, P < 0.001), and more members with self-rated poor health (AOR = 2.415–4.189, P < 0.01) were risk factors for CHE (Table 4).
No significant associations between CHE and the provincial-level factors were observed (Table 4).
The regression models for urban and rural areas (Table S4, see online supplementary material), as well as for different regions (Table S5, see online supplementary material), identified similar predictors of CHE, reinforcing the findings from the national sample.
Factors associated with IHE
The regression models revealed that in 2015 (prior to the launch of the health poverty alleviation project), the incidence of IHE increased by 79.5% (AOR = 1.795, P < 0.001) against the China poverty line and by 141.3% (AOR = 2.413, P < 0.01) against the World Bank poverty line, respectively, compared to the year 2013. The odds of IHE declined in 2017 by 38.8% (AOR = 0.612, P < 0.001) and in 2019 by 28.9% (AOR = 0.711, P < 0.05) against the China poverty line (Table 5).
Higher educational attainment (AOR = 0.778–0.925, P < 0.05) and employment (AOR = 0.593–0.601, P < 0.001) of household head, larger household size (AOR = 0.335–0.537, P < 0.001), and higher household income per capita (AOR = 0.024–0.18, P < 0.001) were protective factors against IHE (Table 5).
Older age (AOR = 1.227–1.247, P < 0.001) of household head, and households with elderly members (AOR = 1.198–1.270, P < 0.001) and more members with self-rated poor health (AOR = 2.883–4.282, P < 0.001) were risk factors for IHE (Table 5).
At the provincial level, higher health expenditure per capita (AOR = 1.567–1.726, P < 0.01) and a higher governmental share in total health expenditure (AOR = 1.015–1.017, P < 0.01) were associated with higher odds of IHE. (Table 5).
The regression models for urban and rural areas (Table S6, see online supplementary material) and different regions (Table S7, see online supplementary material) identified similar predictors of IHE, reinforcing the findings from the national sample.
Factors associated with CHE and IHE
The regression models on the combined CHE or/and IHE indicators (Table 6) yielded similar results as the models established for each indicator separately. Healthcare-induced poverty increased (AOR = 1.382–1.143 in 2015, P < 0.01) prior to the launch of the health poverty alleviation project, before decreasing afterward (AOR = 0.476–0.648 in 2017, P < 0.001).
Higher educational attainment (AOR = 0.609–0.899, P < 0.01) and employment (AOR = 0.599–0.685, P < 0.01) of household head, larger household size (AOR = 0.354–0.652, P < 0.001), higher household income per capita (AOR = 0.050–0.232, P < 0.001), and commercial medical insurance (OR = 0.834, P < 0.001) were protective factors against healthcare-induced poverty. Older age of household head (AOR = 1.205–2.086, P < 0.01), households with elderly members (AOR = 1.307–1.323, P <0.05), rural location (AOR = 1.125–1.187, P < 0.01), and more members with self-rated poor health (AOR = 2.510–4.803, P < 0.001) were risk factors for healthcare-induced poverty (Table 6).
At the provincial level, higher health expenditure per capita (OR = 1.377–1.529, P < 0.05) was associated with higher odds of healthcare-induced poverty (Table 6).
The regression models for urban and rural areas (Tables S8 and S9, see online supplementary material) and different regions (Tables S10 and S11, see online supplementary material) identified similar predictors, reinforcing the findings from the national sample.
Discussion
This study shows that financial hardship due to health expenditure has significantly decreased in China over the years. From 2013 to 2015, there was no significant reduction in CHE and IHE incidence. However, following the launch of the health poverty alleviation project in 2016, the incidence of CHE declined substantially, aligning with findings from previous studies (Chen and J 2019, Lu et al. 2021, Zhang et al. 2022). Despite these achievements, the overall incidence of CHE and IHE in China remains high (21.22% for CHE and 8.66% for IHE in 2019) compared to many other countries. For instance, CHE incidence ranges from 2% to 6% in Japan, 0.5% to 2% in the UK, and 0.8% to 5% in the USA (Wagstaff et al. 2018).
Multiple factors may have contributed to the decline in CHE and IHE. Undeniably, an increase in household income or consumption capacity helps reduce CHE and IHE. In China, annual household income per capita rose from 21 466 in 2013 to 29 140 in 2019. The poverty eradication campaign (State Council 2015) achieved significant success, lowering the proportion of households living below the poverty line from 22.4% in 2013 to 14.2% in 2019. However, income-related inequalities in CHE and IHE persist. Our findings indicate that households in the highest income quartile experienced the most significant reduction in health poverty. Moreover, income and unemployment remain significant predictors of CHE and IHE, even after controlling for variations in other factors, including the year.
The health poverty alleviation project supported poor households by providing greater financial subsidies for healthcare and improving the management of health conditions (State Council 2016c). By 2020, the reimbursement rate of health expenditure from social health insurance for impoverished households had increased by 10% compared to the general population, reaching an actual reimbursement rate of 60% for overall medical expenses and 80% for hospitalizations (NHSA 2020). However, a dilemma arises: lowering financial barriers may drive greater healthcare utilization and increase health expenditure (Wang and Liu 2019). This may help explain the positive association between CHE and IHE and total provincial health expenditure. A key concern is the positive correlation between government health investment and the incidence of IHE observed in this study, suggesting a limited impact of the health poverty alleviation project. This finding aligns with previous reports (Tang et al. 2021). In 2021, the National Healthcare Security Administration incorporated financial protection measures into its assessment of poverty alleviation progress (NHSA 2021). As government health investment continues to grow, more evidence-based and effective strategies are needed to maximize the impact of public funding.
We found that urban households fully covered by UEBMI, the most prestigious social health insurance program, are more likely to incur CHE than others. Empirical evidence suggests that UEBMI enrollees in urban areas have the privilege and convenience of bypassing primary care, often seeking more expensive medical treatment at tertiary hospitals concentrated in metropolitan areas (Yao et al. 2022). China has yet to establish a primary care gatekeeping mechanism (Ye et al. 2024).
Strengthening disease prevention and health management is a key component of the health poverty alleviation project, as poor health is the root cause of health poverty. The findings of this study provide further evidence supporting this argument. We found that older age and poor self-rated health are associated with a higher incidence of CHE and IHE. The Chinese government has sought to reform the hospital-dominated healthcare system by strengthening primary care. Primary care institutions receive funding to systematically manage local residents with chronic conditions (National Health Commission 2017a, State Council 2019c). By early 2019, >98% of patients with chronic and serious health conditions from poor households had received essential treatment (Cheng et al. 2021), largely due to government investment in health infrastructure in impoverished areas, including the establishment of 138 000 rural clinics (Cheng et al. 2021).
Household size, a significant predictor of CHE and IHE, continues to shrink in China, posing a profound challenge to the country’s welfare system. In response, the Chinese government has increasingly relied on insurance tools to address these challenges. Our findings indicate that commercial health insurance is indeed associated with lower odds of healthcare-induced poverty. Policymakers could explore ways to better integrate commercial health insurance into the existing system, enhancing its role in complementing and bridging gaps in basic medical insurance. Some cities have implemented commercial supplementary health insurance schemes to enhance financial protection for impoverished households (Fuzhou 2017, Hangzhou 2020).
Regional inequality remains a significant health policy concern in China. Our findings indicate that regional disparities in CHE and IHE persist, with the central and western regions exhibiting a higher incidence—consistent with previous research (Jia et al. 2023, Wang et al. 2023). Despite the Chinese government’s call to enhance cross-territory collaboration in health poverty alleviation (State Council 2019c), rural and less-developed provinces continue to bear a disproportionate burden of CHE and IHE. This underscores the need for sustained efforts from the central government to address regional disparities.
There are several limitations in this study. Firstly, while the data enabled us to calculate CHE and IHE, it did not capture those who forgo health services due to financial challenges. Secondly, we treated the CHFS 2013–2019 as repeated cross-sectional data without tracking the same households. Caution needs to be taken when inferring a direct causal relationship between the health poverty alleviation project and the outcomes of CHE and IHE due to the lack of a control group. Finally, although the study period (2013–2019) covers both the pre- and post-policy phases of the poverty eradication campaign (2015–2020) and the health poverty alleviation projects (2016–2020), data for 2020 are unavailable.
Conclusions
China has achieved some success in poverty alleviation campaigns, with household financial hardship due to healthcare expenditure decreasing over time. However, there are disparities between urban and rural areas and across regions, indicating the necessity to focus on equality in future efforts.
Supplementary Material
czaf026_Supp
The reference list from the paper itself. Each links out to its DOI / PubMed record.
- 1Agustina R, Dartanto T, Sitompul R et al. Universal health coverage in Indonesia: concept, progress, and challenges. Lancet 2019;393:75–102. doi: 10.1016/S 0140-6736(18)31647-730579611 · doi ↗ · pubmed ↗
- 2Banerjee A, Duflo E, Goldberg N et al. A multifaceted program causes lasting progress for the very poor: evidence from six countries. Science 2015;348:1260799. doi: 10.1126/science.126079925977558 · doi ↗ · pubmed ↗
- 3Bhargava B, Paul VK. Informing NCD control efforts in India on the eve of Ayushman Bharat. Lancet 2022;399:e 17–e 19. doi: 10.1016/S 0140-6736(18)32172-X 30219331 · doi ↗ · pubmed ↗
- 4Borde MT, Kabthymer RH, Shaka MF et al. The burden of household out-of-pocket healthcare expenditures in Ethiopia: a systematic review and meta-analysis. Int J Equity Health 2022;21:14. doi: 10.1186/s 12939-021-01610-3PMC 880248935101038 · doi ↗ · pubmed ↗
- 5Brinda EM, Andrés RA, Enemark U. Correlates of out-of-pocket and catastrophic health expenditures in Tanzania: results from a national household survey. BMC Int Health Hum Right 2014;14:1–8.10.1186/1472-698X-14-5PMC 394623624597486 · doi ↗ · pubmed ↗
- 6Chen C, J Pan. The effect of the health poverty alleviation project on financial risk protection for rural residents: evidence from Chishui City, China. Int J Equity Health 2019;18:1–16. doi: 10.1186/s 12939-019-0982-631151447 PMC 6544991 · doi ↗ · pubmed ↗
- 7Cheng B, Zhu Z, Zhao D et al. Achievements, experiences and challenges of health and poverty alleviation in China. Chin Health Econ 2021;40:5–8.
- 8Deng L, Li J, and Ke X. Analysis of the negative effect of health poverty and government relief strategies for urban poor people. Health Econ Res 2015;7:19–22.