CT feature-based nomogram for predicting tumor spread through air spaces in stage IA lung adenocarcinoma
Bin Luo, Han Yang, Ningbo Fan, Pengfei Duan, Zhesheng Wen, Peng Lin

TL;DR
This study developed a preoperative model to predict tumor spread in early-stage lung cancer using CT features and clinicopathological data.
Contribution
A novel CT feature-based nomogram was developed to predict STAS in stage IA lung adenocarcinoma.
Findings
Irregular nodule shape, margin, and vascular convergence were significant predictors of STAS.
Higher consolidation tumor ratios were strongly associated with increased STAS risk.
The nomogram showed good predictive accuracy with an AUC of 0.812.
Abstract
This research aimed to examine the relationships between clinicopathological characteristics and the occurrence of Spread Through Air Spaces (STAS) in patients with stage IA lung adenocarcinoma (LUAD) and to develop a preoperative prediction model. Data from 1,375 patients with stage IA LUAD at Sun Yat-sen University Cancer Center were analyzed. Propensity score matching (PSM) was employed to match 141 STAS-positive patients with 282 STAS-negative patients. Both univariate and multivariate logistic regression analyses were performed to determine independent variables among 16 clinicopathological and 13 CT imaging characteristics. A nomogram prediction model was developed and evaluated via receiver operating characteristic (ROC) and decision curve analyses (DCAs). Multivariate analysis identified several independent risk factors. Irregular nodule shape (OR = 1.817, 95% CI: 1.106–2.986,…
Genes, proteins, chemicals, diseases, species, mutations and cell lines named across the full text — each resolved to its canonical identifier and authoritative record.
Click any figure to enlarge with its caption.
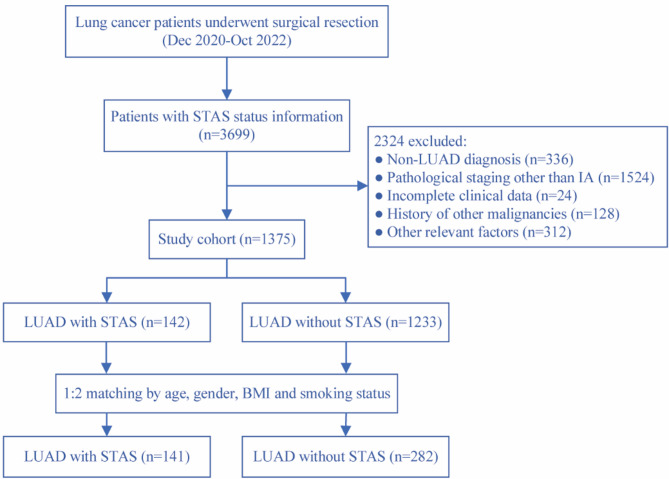 Figure 1
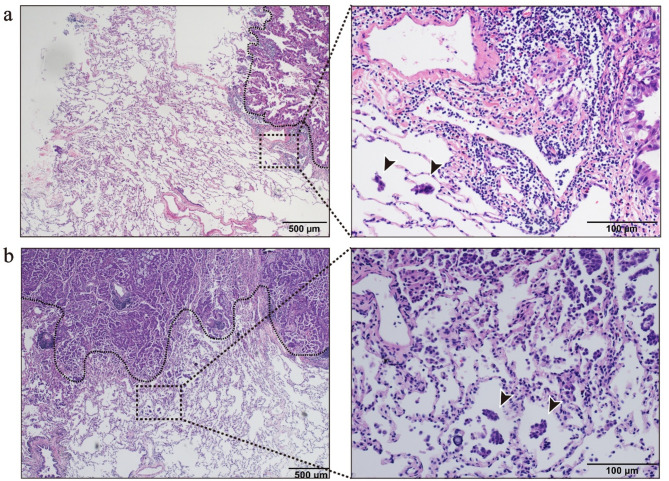 Figure 2
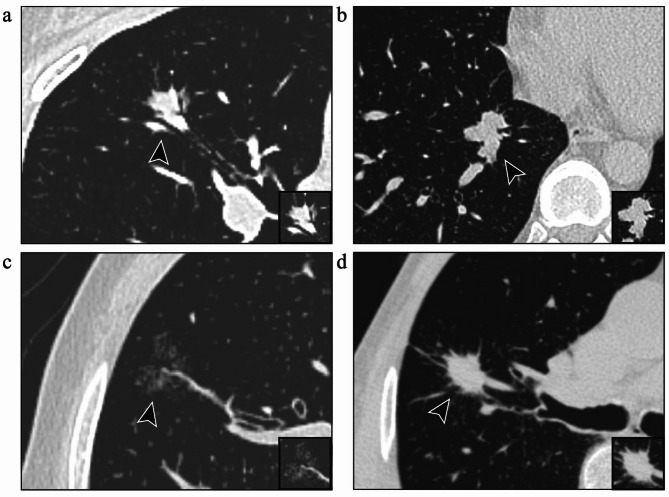 Figure 3
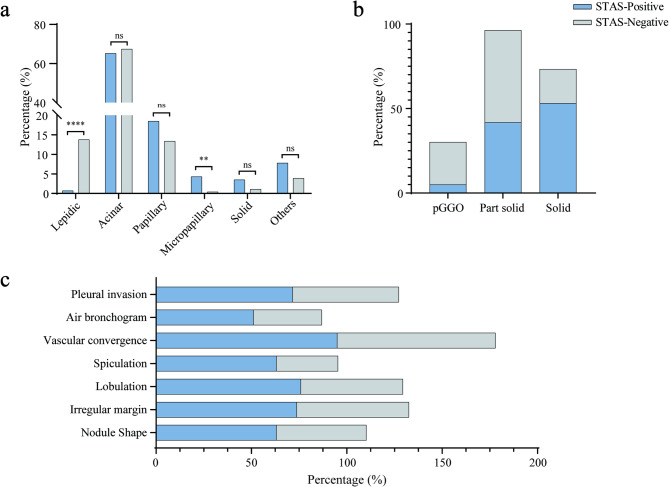 Figure 4
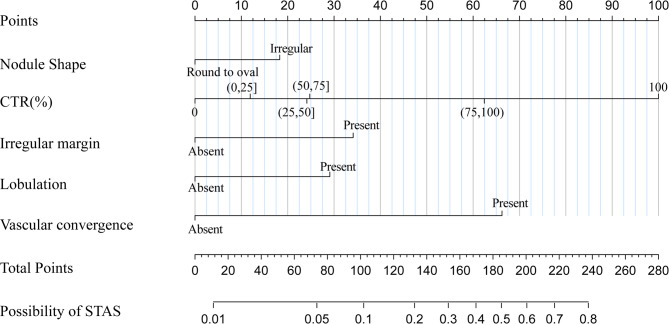 Figure 5
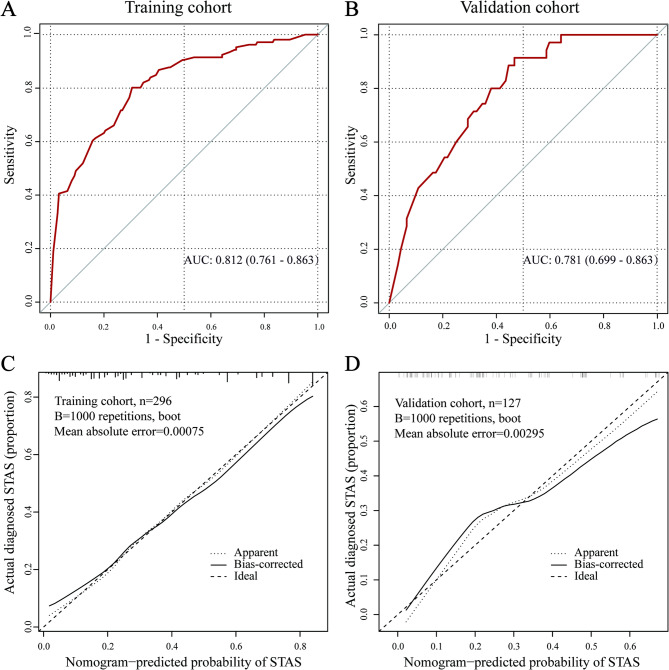 Figure 6
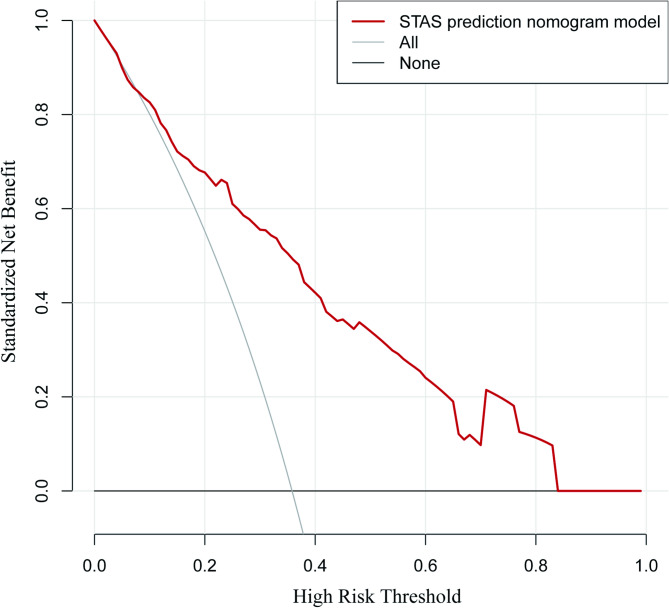 Figure 7
Peer Reviews
No public reviews on file for this paper yet. If you reviewed it on a platform where reviews are public (OpenReview, ICLR, NeurIPS, ICML), you can paste yours below so the community can read it here.
Videos
No videos yet. Explain this paper in a talk, walkthrough, or lecture? Add one.
Taxonomy
TopicsLung Cancer Diagnosis and Treatment · Radiomics and Machine Learning in Medical Imaging · Medical Imaging Techniques and Applications
Introduction
Lung cancer exhibits one of the highest incidence and mortality rates globally. According to the global cancer statistics from 2020, lung cancer constitutes approximately 12.4% of all cancer cases and accounts for about 18.7% of all cancer deaths, rendering it the most prevalent and lethal malignant tumor among males [1]. LUAD is the most common histological subtype of non-small cell lung cancer (NSCLC) [2]. Traditionally, lobectomy has been the standard surgical approach for early-stage lung cancer [3]. However, advancements in chest CT screening and imaging technologies over the past two decades have led to the detection of more early-stage tumors, sparking interest in sublobar resection as an alternative for stage IA NSCLC patients [4–8].
In recent years, STAS has been recognized as a distinct invasive pattern in lung cancer. First introduced by Kadota et al. in 2015 [9], STAS was incorporated into the World Health Organization (WHO) classification of lung cancer in the same year. STAS is defined as the spread of tumor cells into alveolar spaces beyond the primary tumor margin within the lung parenchyma [10]. Current studies indicate that STAS is a risk factor for postoperative recurrence in patients with early-stage LUAD [9, 11–17]. Accumulating evidence suggests that STAS-positive patients undergoing sublobar resection have poorer disease-free survival (DFS) and overall survival (OS) compared to those undergoing lobectomy [14, 18–24]. Moreover, a multicenter retrospective study by Chen et al. demonstrated that postoperative adjuvant chemotherapy can improve the prognosis of stage IA LUAD patients with STAS who underwent sublobar resection [25]. These findings underscore the importance of implementing appropriate therapeutic strategies for STAS-positive patients to enhance their prognosis.
The diagnosis of STAS currently relies on adequate postoperative pathological sampling and examination. However, preoperative or intraoperative identification is even more critical for selecting optimal therapeutic strategies. Preoperative STAS detection remains challenging due to the lack of reliable diagnostic tools, and intraoperative frozen section analysis has limited accuracy in identifying STAS [26].
This study aims to explore the risk factors associated with the occurrence of STAS in stage IA LUAD patients treated at our center and to establish an accurate STAS prediction model based on preoperative independent influencing factors, guiding the selection of optimal surgical strategies for these patients.
Methods
Study population
We retrospectively analyzed postoperative pathological data from 3,699 patients diagnosed with lung cancer who received surgical treatment at Sun Yat-sen University Cancer Center between December 2020 and October 2022. Patients were categorized into STAS-positive and STAS-negative groups based on postoperative pathological findings.
The inclusion criteria were as follows: (i) histopathological confirmation of LUAD following surgical treatment; (ii) postoperative pathological stage confirmed as stage IA according to the 8th edition of the TNM staging system by the International Association for the Study of Lung Cancer (IASLC); and (iii) availability of complete clinical data.
The exclusion criteria were as follows: (i) lack of preoperative chest CT scans within three months before surgery; (ii) receipt of neoadjuvant treatments (e.g., chemotherapy, radiotherapy, immunotherapy, or targeted therapy); (iii) postoperative pathological diagnosis of carcinoma in situ or minimally invasive adenocarcinoma; (iv) presence of multiple invasive adenocarcinomas in the same lung lobe; (v) history of prior lung surgery; (vi) history of other malignancies.
Given the imbalance in the number of cases between STAS-positive and STAS-negative groups, PSM was applied to reduce confounding bias. The matching variables included demographic factors (age, gender), body mass index (BMI), and smoking status. Matching was performed at ratios of 1:1, 1:2, and 1:3, with a 1:2 matching ratio ultimately selected to optimize the balance between group size and data quality (Supplementary Table 1). A detailed flowchart of the patient selection process is presented in Fig. 1.
Fig. 1. Flow chart for the study population
Evaluation of pathological data
Pathological specimens obtained from lung cancer surgeries were evaluated by two specialized pathologists in accordance with the WHO definition of STAS. Hematoxylin and eosin (H&E) staining was performed on all specimens, with representative findings illustrated in Fig. 2. Discrepancies between the two pathologists were resolved through joint discussions. Histological classification adhered to the criteria jointly proposed by the IASLC, the American Thoracic Society, and the European Respiratory Society. The percentages of histological subtypes were recorded in increments of 5%, with subtypes comprising at least 5% of the tumor considered present. The predominant histological subtype, defined as the subtype with the highest percentage, was utilized for classification and further analysis [27]. Additionally, the degree of tumor differentiation, lymphovascular invasion, and perineural invasion were specifically documented, along with other relevant pathological features.
Fig. 2. Histopathological features of patients with stage IA LUAD who are positive for STAS. This figure shows the diagnosis of STAS through H&E staining. The tumor that spreads through air spaces is located outside the edge of the primary tumor (black dashed line). (a) In a 33-year-old male patient with LUAD, the pathological subtype was mainly acinar; (b) In a 38-year-old male patient with LUAD, the pathological subtype was mainly micropapillary
Evaluation of CT data
The chest CT images were analyzed independently by two radiologists specializing in lung cancer, including a physician with 2 years of experience and an attending physician with 5 years of experience in diagnostic radiology. Image analysis was performed using the picture archiving and communication system (PACS). To ensure unbiased evaluation, both radiologists were blinded to the postoperative pathological diagnosis, including STAS status. The radiological features assessed included nodule type, size, CTR, lobulation, vascular convergence, spiculation, and other relevant characteristics (Fig. 3). The long- and short-axis diameters of the nodule and its solid component were measured on the largest cross-sectional plane. Discrepancies between the two radiologists were resolved through re-evaluation by a third independent radiologist, a chief physician with 20 years of experience. Among all cases, 7.8% required arbitration.
Fig. 3. Representative imaging features in patients with stage IA LUAD who are positive for STAS. (a) Air bronchogram sign; (b) Lobulation sign; (c) Vascular convergence sign; (d) Spiculation sign
Statistical analysis
Statistical analyses were conducted using SPSS (v27.0) and R software (v4.4.0). PSM was performed with the ‘MatchIt’ package in R to balance covariates, including age, gender, BMI, and smoking status, between the two groups. Continuous variables were summarized as mean ± standard deviation when normally distributed or as median (interquartile range) otherwise, with group comparisons conducted using t-tests or Wilcoxon rank-sum tests. Categorical variables were expressed as frequencies and percentages and compared using chi-square or Fisher’s exact tests. Both univariable and multivariable logistic regression analyses were performed to identify significant predictors of STAS. To assess potential multicollinearity among the variables included in the multivariate logistic regression model, we calculated the variance inflation factors (VIFs) in both the training and validation cohorts. The VIF values for all variables were below 1.15 in the training set and below 1.24 in the validation set, both of which are substantially lower than the commonly accepted threshold of 5. Therefore, multicollinearity does not pose a significant concern in our model. The dataset was randomly divided into training and validation sets in a 70:30 ratio using the base functions in R, with a fixed random seed (set.seed(1234)) to ensure reproducibility. A nomogram was developed using the ‘rms’ package in R, and its predictive performance was assessed through ROC curves and calibration curves. Statistical significance was defined as a two-sided p value of less than 0.05.
Results
Demographic and clinical characteristics
A total of 3,789 patients diagnosed with primary lung cancer were initially screened. After the implementation of the inclusion and exclusion criteria, 1,375 patients with stage IA LUAD were retained for the final analysis, comprising 141 STAS-positive and 1,234 STAS-negative patients. Following PSM, 141 STAS-positive and 282 STAS-negative patients were selected for further analysis (Fig. 1).
The study population consisted of 220 males and 203 females, with a mean age of 57.7 ± 10.9 years. Among the patients in the STAS-positive group, 19.1% (27/141) underwent sublobar resection, which was significantly lower than the 39.7% (112/282) in the STAS-negative group (P < 0.001). Univariate analysis indicated no statistically significant differences between the two groups in terms of comorbidities, serum carcinoembryonic antigen (CEA) levels, or family history of lung cancer (P > 0.05). However, among patients who underwent postoperative genetic testing, the EGFR mutation status differed significantly between the groups (P < 0.05), with wild-type EGFR being more prevalent in the STAS-positive group. A summary of the clinical characteristics of the study population is presented in Table 1.
Table 1. Relationships between the STAS and clinicopathological featuresVariableAll patients(n = 423)STAS(+)STAS(-)P Value Age(year) 57.7 ± 10.957.7 ± 11.157.7 ± 10.90.965 Gender 0.945 Male220(52.0)73(51.8)147(52.1) Female203(48.0)68(48.2)135(47.9) Smoking status 0.543 Present150(35.5)50(64.5)100(35.5) Absent273(64.5)91(64.5)182(35.5) BMI 23.3 ± 3.223.4 ± 3.323.3 ± 3.20.828 Family history of lung cancer 0.543 Present37(8.7)14(9.9)23(8.2) Absent386(91.3)127(90.1)259(91.8) Comorbidities 0.24 Hypertension91(19.5)58(20.6)33(18.9) Diabetes43(9.2)15(9.4)28(9.1) Heart disease16(3.4)9(5.6)7(2.3) Hepatitis9(1.9)5(3.1)4(1.3) Others32(6.9)12(7.5)20(6.5) CEA(mg/dL) 0.306 Normal343(81.1)111(78.7)222(82.3) Abnormal33(7.8)15(10.6)18(6.4) N/A47(11.1)15(10.6)32(11.3) Surgery
<0.001 Lobectomy284(67.1)114(80.9)170(60.3) Sublobar resection139(32.9)27(19.1)112(39.7) pT stage
<0.001 T1a71(16.8)10(7.1)61(21.6) T1b232(54.8)78(55.3)154(54.6) T1c120(28.4)53(37.6)67(23.8) Tumor differentiation
< 0.001 Well30(7.1)3(2.1)27(9.6) Moderate333(78.7)94(66.7)239(84.7) poor60(14.2)40(31.2)16(5.7) Histologic subtypes Lepidic predominant40(9.5)1(0.7)39(13.8) <0.0001 Acinar predominant282(66.6)92(65.2)190(67.4)0.662 Papillary predominant64(15.1)26(18.5)38(13.4)0.179 Micropapillary predominant7(1.7)6(4.3)1(0.4) 0.006 a Solid predominant8(1.9)5(3.5)3(1.1)0.077 Others _b_22(5.2)11(7.8)11(3.9)0.089 Micropapillary Component
0.001 Present105(24.8)80(56.7)25(8.9) Absent318(75.2)61(43.3)257(91.1) Lymphovascular invasion
<0.001 Present25(5.9)21(14.9)4(1.4) Absent398(94.1)120(85.1)278(98.6) Perineural invasion 1.000 Present2(0.5)1(0.4)1(0.7) Absent421(99.5)281(99.6)140(99.3) EGFR Mutation 125(61.0)38(51.4)87(66.4) 0.034
ALK Rearrangement 7(3.6)5(7.0)2(1.6)0.103EGFR: epidermal growth factor receptor; ALK: anaplastic lymphoma kinase; a: Fisher’s exact test; b: other pathological subtypes, including complex glandular patterns and the mucinous type
Pathological features
Univariate analysis of pathological characteristics revealed significant differences between the STAS-positive and STAS-negative groups in terms of tumor T stage, degree of differentiation, and predominant pathological subtype. In the STAS-positive group, 56.7% of tumors exhibited a micropapillary structure, and 14.9% demonstrated lymphovascular invasion, both of which were significantly greater than those in the STAS-negative group. Detailed comparisons of pathological characteristics are provided in Table 1.
Radiological features
Univariate analysis of chest CT features revealed that both the maximum nodule diameter and the maximum diameter of the solid component within the nodule were significantly larger in the STAS-positive group compared to the STAS-negative group (19.2 mm vs. 16.5 mm and 15.0 mm vs. 8.6 mm, respectively; both P < 0.001). The CTR was also significantly different between the groups (P < 0.001), with STAS positivity increased notably when CTR ≥ 75% and peaked at CTR = 100% (Supplementary Fig. 1). While the right upper lobe was the most common location for nodules (33.8% of cases), no significant difference in nodule location was observed between the groups (P > 0.05). However, the type of nodule was significantly different (P < 0.001). Radiological features such as irregular nodule shape, irregular margins, lobulation, spiculation, vascular convergence, air bronchogram, and pleural invasion were significantly more prevalent in the STAS-positive group. These findings are summarized in Table 2 and visually illustrated in Fig. 4.
Table 2. Relationships between the STAS and CT featuresVariableAll patients(n = 423)STAS(+)STAS(-)P Value Maximum tumor diameter (mm) 17.4 ± 6.319.3 ± 5.916.5 ± 6.2 <0.001 a
Maximum solid component diameter (mm) 10.7 ± 8.315.1 ± 7.98.6 ± 7.6 <0.001 a
CTR (%)
<0.001 078(18.4)7(5.0)71(25.2) 0< CTR ≤ 2526(6.1)4(2.8)22(7.8) 25< CTR ≤ 5073(17.3)16(11.3)57(20.2) 50< CTR ≤ 7571(16.8)18(12.8)53(18.8) 75< CTR<10043(10.2)21(14.9)22(7.8) 100132(31.2)75(53.2)57(20.2) Nodule type
<0.001 pGGO78(18.4)7(5.0)71(25.2) Part solid213(50.4)59(41.8)154(54.6) Solid132(31.2)75(53.2)57(20.2) Nodule location 0.163 RUL143(33.8)39(27.7)104(36.9) RML28(6.6)7(5.0)21(7.4) RLL89(21.0)37(26.2)52(18.4) LUL106(25.1)39(27.7)67(23.8) LLL57(13.5)38(13.5)19(13.5) Nodule Shape
0.002 Irregular222(52.5)89(63.1)133(47.2) Round to oval201(47.5)52(36.9)149(52.8) Irregular margin
0.003 Present270(63.8)104(73.8)166(58.8) Absent153(36.2)37(26.2)116(41.1) Lobulation
<0.0001 Present258(61.0)107(75.9)151(53.5) Absent165(39.0)34(24.1)131(46.5) Spiculation
<0.001 Present180(42.6)89(63.1)91(32.3) Absent243(57.4)52(36.9)191(67.7) Cavitation 0.418 Present75(17.7)28(19.9)47(16.7) Absent348(82.3)113(80.1)235(83.3) Vascular convergence
<0.001 Present368(87.0)134(95.0)234(83.0) Absent55(13)7(5)48(17) Air bronchogram
0.003 Present173(40.9)72(51.1)101(35.8) Absent250(59.1)69(48.9)181(64.2) Pleural invasion
0.002 Present258(61.0)101(71.6)157(55.7) Absent165(39.0)40(28.4)125(44.3)CTR: Consolidation tumor ratio; a: Fisher’s exact test
Fig. 4. Comparison of STAS-positive and STAS-negative features in lung nodules. (a) The clustered column chart compares the predominant pathological subtypes between the STAS-positive and STAS-negative groups. (b) The stacked bar chart illustrates the significnat differences in nodule types between the STAS-positive and STAS-negative groups. (c) The stacked bar chart shows that STAS is more frequently observed in patients with irregular nodules, irregular margins, lobulation, spiculation, vascular convergence, air bronchogram, and pleural invasion signs. **p < 0.01, **p < 0.0001, ns, p > 0.05
Multivariate logistic regression analysis
Clinically significant pathological and CT features identified through univariate analysis were further evaluated using multivariate logistic regression analysis. This multivariate analysis revealed several independent risk factors associated with STAS. Among the tumor differentiation subgroups, well-differentiated tumors were significantly correlated with STAS (p = 0.009). Lymphovascular invasion (OR = 4.677, 95% CI: 1.371–15.955, p = 0.014) and micropapillary structure (OR = 9.08, 95% CI: 5.172–15.938, p < 0.001) were also significantly associated with increased risk, whereas lepidic predominant histologic subtypes (OR = 0.069, 95% CI: 0.008–0.575, p = 0.013) served as protective factors against STAS (see Table 3). In terms of CT features, nodule shape (OR = 1.817, 95% CI: 1.106–2.986, p = 0.018), irregular margin (OR = 2.050, 95% CI: 1.218–3.449, p = 0.007), lobulation (OR = 2.235, 95% CI: 1.336–3.739, p = 0.002), and vascular convergence (OR = 5.032, 95% CI: 2.050–12.349, p < 0.001) were significantly associated with an increased risk. For the CTR, compared with CTR = 0% (reference), both CTR 75–100% (OR = 7.086, 95% CI: 2.542–19.750, p < 0.001) and CTR = 100% (OR = 11.502, 95% CI: 4.752–27.840, p < 0.001) were significantly associated with an increased risk of STAS. Other radiological features did not show statistical significance (see Table 4).
Table 3. Multivariate analysis of pathological features related to STASVariableOR95%CIP Value Tumor differentiation Well1─ 0.009 Moderate1.5420.369–6.4390.553Poor4.7620.996–22.7760.051 Lymphovascular invasion 4.6771.371–15.955 0.014
Micropapillary structure 9.085.172–15.938 <0.001
Lepidic predominant Histologic subtypes 0.0690.008–0.575 0.013
Table 4. Multivariate analysis of CT features related to STASVariableOR95%CIP Value Nodule Shape 1.8171.106–2.986 0.018
Irregular margin 2.0501.218–3.449 0.007
Lobulation 2.2351.336–3.739 0.002
Vascular convergence 5.0322.050-12.349 <0.001
CTR% 01─ <0.001 0< CTR ≤ 251.6340.412–6.4810.48525< CTR ≤ 502.1180.785–5.7120.13850< CTR ≤ 752.5330.952–6.7380.06375< CTR<1007.0862.542–19.750 <0.001 10011.5024.752–27.840 <0.001
Model development and evaluation
Based on multivariate logistic regression analysis, we recognized independent risk factors derived from the features of preoperative CT scans., including nodule shape, irregular margin, lobulation sign, vascular convergence sign, and the CTR, all of which were statistically significant. Using the ‘base’ package in R software, we randomly divided the dataset into two groups at a ratio of 0.7:0.3, employing a fixed random seed to ensure reproducibility. The 0.7 group served as the training set, while the 0.3 group was designated as the internal validation set. Subsequently, the ‘rms’ package in R was utilized to construct a nomogram model based on the significant predictors identified in the training set to predict the occurrence of STAS in stage IA LUAD. As illustrated in Fig. 5, the nomogram assigns points to variables such as nodule shape, the consolidation-to-tumor ratio (CTR%), the presence of an irregular margin, lobulation, and vascular convergence, all identifiable on preoperative CT scans. By summing these points, the total score predicts the probability of STAS positivity. In clinical practice, this nomogram serves as a practical tool to assist surgeons in tailoring their decision-making. Patients with higher predicted probabilities of STAS positivity, based on preoperative CT features, may benefit from more aggressive surgical strategies, such as lobectomy instead of sublobar resection, to mitigate the risk of recurrence. Its simplicity and user-friendly design also make it suitable for integration into routine clinical workflows, facilitating personalized treatment planning and effective communication of risk with patients.
Fig. 5. Nomogram model for predicting the occurrence of STAS in stage IA LUAD
The nomogram demonstrated high predictive accuracy in the training set, achieving an AUC of 0.812 (95% CI: 0.761–0.863). Internal validation further corroborated its robustness, yielding an AUC of 0.781 (95% CI: 0.699–0.863). These AUC values, as shown in Fig. 6a and b, suggest a strong discriminatory ability of the model in predicting the occurrence of STAS. The optimal cut-off value for the training cohort was 33.9%, with a sensitivity of 69.5%, a specificity of 80.2%, and a Youden’s Index of 0.497. For the validation cohort, the optimal cut-off value was 20.1%, with a sensitivity of 91.4%, a specificity of 53.3%, and a Youden’s Index of 0.447. The bootstrap method was employed for internal validation, and the calibration curve (Fig. 6c and d) demonstrates good alignment between predicted and actual probabilities, confirming the model’s accuracy. Furthermore, the decision curve analysis (DCA) illustrated in Fig. 7 indicates that the nomogram model provides a higher clinical net benefit across the risk threshold range of 0.1 to 0.8, underscoring its potential value in clinical practice.
Fig. 6. Performance evaluation of the nomogram model in the training set and internal validation set. ROC curves for the nomogram model for predicting stage IA LUAD STAS in the training set (a) and validation set (b). The calibration curves for evaluating the nomogram model in the training set (c) and validation set (d)
Fig. 7. Decision curve analysis of the line chart model
Discussion
This study identified key clinicopathological factors associated with STAS in stage IA LUAD, including tumor differentiation, micropapillary structure, lymphovascular invasion, and lepidic predominant subtype. STAS was more frequent in tumors with moderate to poor differentiation, and the micropapillary structure was significantly more prevalent in STAS-positive patients, consistent with previous studies [11, 24, 28–33]. Lymphovascular invasion also showed a significant correlation with STAS, highlighting its role in tumor spread [9, 13, 15]. A meta-analysis further supported that STAS is common in micropapillary subtypes but rare in lepidic subtypes, aligning with our findings [34]. In terms of molecular features, some studies have reported a significant correlation between STAS positivity and wild-type EGFR [11, 12]. However, Toyokawa et al. (2018) found no such association with EGFR mutations [16]. In our cohort, STAS-positive patients predominantly exhibited wild-type EGFR (P < 0.05), which is consistent with its association with poor prognosis in LUAD [35]. Although 71.4% of patients with ALK rearrangements were STAS-positive, the difference was not statistically significant, likely due to the limited sample size. Additionally, while Shiono et al. reported higher CEA levels in STAS-positive patients [36], our findings did not show a significant difference. Larger cohorts are needed to validate these associations.
While STAS is traditionally confirmed through postoperative pathological examination, numerous retrospective studies have explored its correlation with preoperative CT features, aiming to predict its occurrence [17, 37–40]. Given that STAS is a microscopic phenomenon beyond the spatial resolution of current CT technology, it is suggested that indirect indicators should be utilized for its prediction [17]. Studies by Toyokawa et al. and Kim et al. identified significant associations between STAS and CT features such as maximum nodule diameter, solid component proportion, and CTR, highlighting their predictive potential [16, 17, 41]. In our cohort of 423 patients with stage IA LUAD, STAS was significantly associated with the maximum diameters of both the nodule and its solid component, as well as the CTR. Notably, CTR emerged as an independent risk factor for predicting STAS occurrence, with higher CTR values correlating with an increased likelihood of STAS. Consequently, CTR, which is readily measurable by CT, may facilitate the selection of the optimal surgical strategy.
Regarding nodule type, Kim et al. reported no STAS in pure ground-glass nodules (GGNs) [17]. However, other studies have reported the presence of STAS in pure GGNs, albeit with a relatively low incidence [37, 41, 42]. In our study, 5% (7/141) of the STAS-positive patients exhibited pure GGNs, and 14.1% (20/141) had nodules where the ground-glass component predominated. These findings suggest that the choice between sublobar resection and lobectomy should not be based solely on the presence of pure GGNs but should also incorporate a comprehensive evaluation of imaging features. Consistent with Shiono et al., we found that pure solid nodules had a significantly higher STAS positivity rate compared to subsolid nodules [36]. Additionally, several CT features, such as irregular margin, lobulation, spiculation, vascular convergence, air bronchogram, and pleural invasion, were frequently observed in STAS-positive patients [38, 41, 43, 44]. Similar to these studies, our research confirms that irregular nodule shape, irregular margin, lobulation, spiculation, vascular convergence, air bronchogram, and pleural invasion are commonly seen in CT images of stage IA LUAD patients with STAS. Among these, irregular nodule shape, irregular margin, lobulation sign, and vascular convergence sign were identified as independent risk factors for STAS occurrence in stage IA LUAD. These findings highlight the utility of preoperative chest CT imaging in predicting STAS and optimizing surgical planning for stage IA LUAD patients.
The nomogram developed in this study demonstrated good predictive performance, with an AUC of 0.812 in the training cohort, indicating a notable discriminatory ability for predicting the occurrence of STAS. In recent years, several studies have explored the relationships between CT-based radiomics features and STAS in lung adenocarcinomas [45–48]. These radiomics-based nomograms have been developed to enhance diagnostic accuracy for STAS, with reported AUCs ranging from 0.630 to 0.907. However, the practical application of these tools is partially constrained by the intricate technical requirements of radiomics. Other investigations have leveraged clinical characteristics to estimate the risk of STAS [49–51]; For instance, Wang et al. established a nomogram that achieved AUCs of 0.860 in the training group and 0.919 in the validation group [50]. Their model incorporated postoperative pathological data, such as Ki-67 and PD-L1 expression, which may have contributed to its enhanced predictive accuracy for STAS. In contrast, Chen et al. developed a nomogram based on the percentage of the solid component and lobulation, achieving a C-index of 0.803, which is comparable to the diagnostic performance of our model [49]. Similarly, Yang et al. constructed a nomogram utilizing preoperative CEA levels and CT features, achieving an AUC of 0.835 [51]. Their model demonstrated a sensitivity and specificity of 83.6% and 78.2%, respectively, which are slightly higher than those of our model. This discrepancy may be attributed to their use of larger cohorts, which likely improved statistical power and reduced potential biases. Overall, while the nomogram developed in our study demonstrates relatively favorable predictive performance and potential clinical utility, future research should focus on refining its accuracy and generalizability. This can be achieved by incorporating a broader array of biomarkers and utilizing larger, multi-center cohorts to enhance statistical power and mitigate potential biases.
The clinical significance of our findings is noteworthy; however, several limitations should be acknowledged. First, as a retrospective cohort study focusing exclusively on surgically treated stage IA LUAD patients, there is an inherent risk of selection bias, which may have influenced the representativeness of the sample population. Second, the relatively short postoperative follow-up period limited the evaluation of long-term outcomes, such as disease recurrence and overall prognosis. Future studies with longer follow-up durations are necessary to further elucidate the prognostic impact of STAS. Third, the single-center design restricts the generalizability of our results, while the absence of external validation further limits their robustness. Multicenter studies with diverse patient populations and external validation using independent cohorts are crucial to improve the reliability and applicability of our findings.
Conclusion
In summary, this study analyzed the clinicopathologic and CT features associated with STAS in patients with stage IA LUAD. We identified lower tumor differentiation, non-lepidic predominant subtypes, micropapillary structure, and lymphovascular invasion as significant clinicopathologic risk factors for STAS. Additionally, CT features such as solid components, irregular shape, irregular margin, lobulation, and vascular convergence were significant predictors of STAS. On the basis of these five CT features, we developed a nomogram that demonstrates promising predictive accuracy and has the potential to guide clinical decision-making. This model may serve as a useful tool for preoperative STAS risk assessment and could assist thoracic surgeons in tailoring surgical strategies for patients with stage IA LUAD.
Electronic supplementary material
Below is the link to the electronic supplementary material.
Supplementary Material 1
Supplementary Material 2