Empowering Indonesia’s energy transition planning through long-term energy system modelling: A technoeconomic dataset
Mutiara Ramadhani Nur Irbah, Raphael Slade, Mark Howells, Neve Fields, Fernando Antonio Plazas-Niño, Emma Richardson

TL;DR
This paper provides a comprehensive open-access dataset for Indonesia's energy systems to support clean energy planning and policy analysis.
Contribution
The novel contribution is an open-access dataset for Indonesia's energy systems, harmonized and aligned with U4RIA principles.
Findings
The dataset includes historical and projected data from 2010 to 2070 on electricity demand, generation, and renewable energy potentials.
The dataset is harmonized using documented assumptions and sources from government reports, international agencies, and academic literature.
The dataset serves as a template for other countries facing similar energy transition planning challenges.
Abstract
As one of the most populous countries globally and a major emerging economy, Indonesia aims to significantly lower its carbon footprint and transform its power sector toward cleaner energy sources. To effectively plan and implement policies to achieve these goals, decision-makers require reliable, comprehensive data on Indonesia's energy systems. However, accessing energy data in Indonesia can be challenging, as is often the case in developing countries where data may be fragmented, out of date, or simply unavailable. In this regard, this data article paper presents an open-access dataset of Indonesia's energy systems to support energy modelling, policy analysis, and research, following the U4RIA goals of Ubuntu, Retrievability, Reusability, Repeatability, Reconstructability, Interoperability, and Auditability. The dataset encompasses historical and projected data from 2010 to 2070 on…
Genes, proteins, chemicals, diseases, species, mutations and cell lines named across the full text — each resolved to its canonical identifier and authoritative record.
Click any figure to enlarge with its caption.
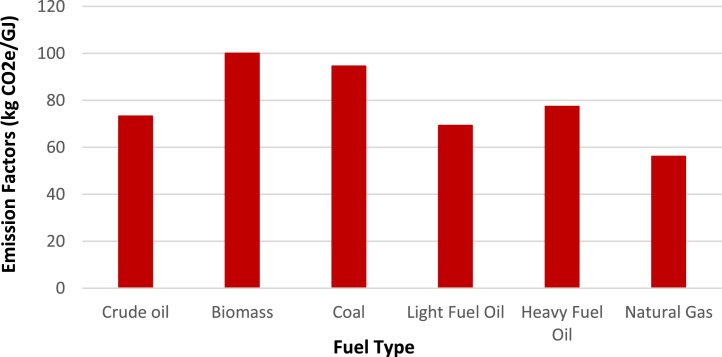 Figure 1
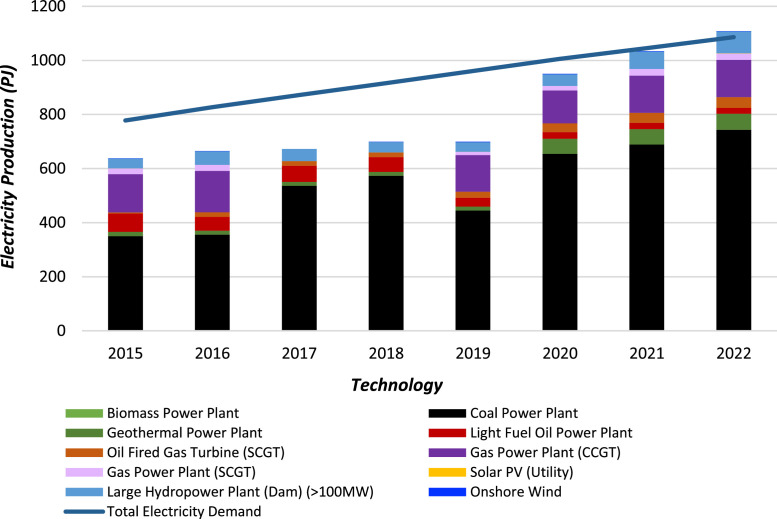 Figure 2
Peer Reviews
No public reviews on file for this paper yet. If you reviewed it on a platform where reviews are public (OpenReview, ICLR, NeurIPS, ICML), you can paste yours below so the community can read it here.
Videos
No videos yet. Explain this paper in a talk, walkthrough, or lecture? Add one.
Taxonomy
TopicsIntegrated Energy Systems Optimization · Hybrid Renewable Energy Systems · Energy and Environment Impacts
Specifications TableSubjectEngineering & Materials scienceSpecific subject areaEnergy System ModellingType of dataTables and GraphsData collectionThe data collection process involved a systematic literature review of publicly accessible sources, including scientific journals, government reports, and international agency publications. Key data were extracted from authoritative databases such as the Ministry of Energy and Mineral Resources of Indonesia and complemented by pre-existing modelling databases provided by Climate Compatible Growth. These materials are available on their respective official websites and are fully documented in the references section.Sources were selected based on relevance to Indonesia’s power sector and energy transition, with inclusion criteria covering recency (last 10 years), national relevance, and credibility. Outdated or methodologically unclear datasets were excluded. Analysis was conducted using open-source tools, including OSeMOSYS and FlexTool, to ensure transparency and reproducibility.Data source locationThe data sources are referenced within the relevant sections of this article.Data accessibilityAll the primary data sources are clearly described in the Zenodo repository.Repository name: ZenodoData identification number: 10.5281/zenodo.14536072Direct URL to data: https://zenodo.org/records/14536072Related research articleNone
Value of the Data
1
- •This database consolidates data from multiple sources into a single, harmonised, and easily accessible repository, which could save researchers significant time and effort in data gathering and preprocessing.
- •By adhering to the U4RIA principles [1], particularly reconstructability and interoperability, this dataset could allow researchers to easily integrate it with their existing models or utilise it as a foundation for new Indonesia-specific energy models, which may promote further research and collaboration.
- •As new energy data becomes available, researchers can reproduce the data processing steps to refine and expand this dataset. This is crucial in the rapidly evolving energy landscape, enabling the research community to maintain a robust, up-to-date resource. Through collaboration, researchers might continuously enhance the quality, scope, and accuracy of publicly available energy data for Indonesia.
- •While focused on Indonesia specifically, the dataset could serve as a replicable template for creating similar datasets in other developing countries facing similar energy transition challenges. This may enable cross-country comparisons, knowledge sharing, and the adoption of best practices in energy modelling and analysis.
Background
2
Amid growing global momentum toward net-zero emissions, Indonesia has committed to lowering its carbon footprint while transforming its energy systems. To successfully achieve these decarbonisation goals, developing robust evidence-based energy strategies is essential, which fundamentally relies on access to high-quality and comprehensive energy data. However, like many other low- and middle-income countries (LMICs), Indonesia faces significant obstacles in obtaining accessible energy data while also grappling with scattered and fragmented datasets [2]. This data article aims to address these challenges by introducing an open-access dataset on Indonesia’s energy systems that follows U4RIA framework principles (Ubuntu, Retrievability, Repeatability, Reconstructability, Interoperability, and Auditability) [1], thus supporting energy modelling and evidence-based policymaking. This dataset was built to feed into OSeMOSYS and FlexTool models [2,3], so can be readily employed in this context or in similar energy modelling frameworks.
Data Description
3
This article introduces a collection of datasets for Indonesia that can be employed in the OSeMOSYS and FlexTool tools to model long-term energy transition planning. It is crucial to understand that these datasets are not tied to these tools and can be utilised independently for various energy research and planning purposes. The datasets have been published publicly and can be retrieved through Zenodo at https://zenodo.org/records/14536072 [3]. The data were compiled from a variety of publicly accessible sources, including reports from the Indonesian government and international agencies, academic publications, and databases of pre-existing models. Specifically, this dataset draws on statistical data from Indonesia’s Ministry of Energy and Mineral Resources, such as Technology Data for the Indonesian Power Sector and Electricity Statistics, as well as the Indonesia Energy Outlook published by the National Energy Council. International sources include the Renewable Energy Outlook for ASEAN by the International Renewable Energy Agency (IRENA). Additional parameters were obtained from peer-reviewed publications and pre-existing techno-economic datasets available through the Climate Compatible Growth (CCG) inventory.
The dataset encompasses a wide range of information, such as electricity demand and generation, capital and fixed costs, operational lifetime, technology efficiencies, capacity factors, residual capacity, renewable energy potential, and key parameters for flexibility modelling for the years 2015 to 2050. These parameters are organised into nine categories, each representing a distinct technology used by Indonesia’s existing power generators. These categories are defined in the “Sets” sheet within the Excel file provided in the repository.
Electricity demand
3.1
The electricity demand projections are based on Paiboonsin’s pre-existing model database [4], which expanded upon the “Energy & Transport Starter Data Kits” developed by Climate Compatible Growth (CCG) [5]. As illustrated in Table 1, which shows data for key years only, the electricity demand is disaggregated into three main sectors: commercial, residential, and industrial. Across these sectors, demand is projected to grow at an annual rate of 2–5 % [4]. To access the full demand dataset for complete timeseries data if needed, users can refer to the "Demand" sheet within the Excel file available in the repository.Table 1. Total electricity demand per sector for key years (PJ).Table 1. YearIndustrialResidentialCommercialTotal Electricity Demand2015261.17323.97192.77777.912020337.55418.71249.151005.422025405.16502.58299.061206.802030512.09635.22377.981525.292035671.76833.28495.842000.872040834.241034.82615.762484.822045991.251229.59731.662952.4920501117.801386.57825.063329.43
Costs
3.2
The primary sources for capital and fixed cost data are the “Technology Data for the Indonesian Power Sector: Catalogue for Generation and Storage of Electricity” annual report by the Ministry of Energy and Mineral Resources (MEMR) of Indonesia [6] and the “National Hydrogen Strategy” published by MEMR [7]. This report covers data for various technologies, including all hydropower types, SCGT, CCGT, light fuel oil, biomass, offshore and onshore wind, geothermal, solar PV (utility), and coal for the years 2020, 2030, and 2050. Data for additional technologies not covered in the report is derived from the pre-existing model dataset [4]. The entire dataset can be accessed in the “Capital Cost” and “Fixed Cost” sheets of the Excel file in the repository (Table 2, Table 3).Table 2. Capital costs of key years (/kW/year).Table 3. Technology20152020202520302035204020452050Biomass Power Plant545452.771449.748.07546.4544.82543.2Coal Power Plant54.3754.3753.892952.752.29551.8951.48551.08Geothermal Power Plant145145145145141.375137.75134.125130.5Light Fuel Oil Power Plant9.129.129.129.129.051758.98358.915258.847Oil Fired Gas Turbine (SCGT)1818181818181818Gas Power Plant (CCGT)26.826.826.57142625.825.625.425.2Gas Power Plant (SCGT)26.526.526.271425.725.525.325.124.9Solar PV (Utility)7.57.57.36.86.6256.456.2756.1CSP with Storage120120120120120120120120Large Hydropower Plant (Dam) (>100MW)434342.42864140.2539.538.7538Medium Hydropower Plant (Dam) (10-100MW)47.847.847.228645.844.97544.1543.32542.5Small Hydropower Plant (Dam) (<10MW)60.460.459.71435857565554Onshore Wind404038.85713634.53331.530Offshore Wind118.8118.8113.37199.895.17590.5585.92581.3Nuclear Power Plant138138138138138138138138Utility-scale PV with 2 hour storage27.85518.6912.873310.79839.75448.776228.446228.12622Onshore Wind power plant with storage131.78198.654477.405269.464459.846859.388458.913758.497Light Fuel Oil Standalone Generator (1 kW)3838383838383838Solar PV (Distributed with Storage)70.0442.61637.61635.11634.47633.81633.15632.516Off-grid Hydropower64.8664.8664.8664.8664.8664.8664.8664.86PEM Electrolyser4040404040404040PEM Fuel Cell2020202020202020Pumped Hydro Storage18.718.718.718.718.718.718.718.7Electricity Transmission4.085334.085334.085334.085334.085334.085334.085334.08533Electricity Distribution2.042672.042672.042672.042672.042672.042672.042672.04267
Operational lifetime
3.3
The operational lifetime data, which indicates the typical operational lifespan of a power plant, is also sourced from the MEMR’s annual report [6], covering multiple technologies, including all types of hydropower, SCGT, CCGT, light fuel oil, biomass, offshore and onshore wind, geothermal, solar PV (utility), and coal. For the remaining technologies, data was sourced from an earlier model dataset [4]. The data is provided in the “Operational Life” sheet of the repository’s Excel file and presented in Table 4.Table 4. Operational lifetime (years).Table 4. TechnologyOperational Lifetime (years)Biomass Power Plant25Coal Power Plant30Geothermal Power Plant30Light Fuel Oil Power Plant25Oil Fired Gas Turbine (SCGT)50Gas Power Plant (CCGT)25Gas Power Plant (SCGT)25Solar PV (Utility)35CSP with Storage35Large Hydropower Plant (Dam) (>100 MW)50Medium Hydropower Plant (Dam) (10–100 MW)50Small Hydropower Plant (Dam) (<10 MW)50Onshore Wind27Offshore Wind27Nuclear Power Plant60Utility-scale PV with 2 h storage30Onshore Wind power plant with storage30Light Fuel Oil Standalone Generator (1 kW)20Solar PV (Distributed with Storage)41Off-grid Hydropower40PEM Electrolyser20PEM Fuel Cell20Pumped Hydro Storage60Electricity Transmission50Electricity Distribution70
Technology efficiencies
3.4
Technology efficiency refers to the ratio of useful energy output to the total energy input for a specific technology or process. It measures how effectively a particular technology converts input energy (such as fuel) into the desired output energy (such as electricity). The study used technology efficiency from the pre-existing model database [4] that compiles the data published by the ASEAN Centre for Energy with IRENA [8], with base-year estimates primarily from 2015. These efficiency values are applied uniformly across the entire modelling period from 2015 to 2070, with no projections or learning rates incorporated due to uncertainty regarding future technological advancements specifically in the Indonesian context. This approach ensures transparency and avoids introducing speculative assumptions into the model. The data is provided in the “Technology Efficiency” sheet of the repository’s Excel file and presented in Table 5.Table 5. Technology efficiencies.Table 5. TechnologyEfficiency (%)Biomass Power Plant38.02Coal Power Plant30.03Geothermal Power Plant10.00Light Fuel Oil Power Plant40.00Oil Fired Gas Turbine (SCGT)40.00Gas Power Plant (CCGT)55.25Gas Power Plant (SCGT)34.60Solar PV (Utility)100.00CSP with Storage100.00Large Hydropower Plant (Dam) (>100MW)100.00Medium Hydropower Plant (Dam) (10-100MW)100.00Small Hydropower Plant (Dam) (<10MW)100.00Onshore Wind100.00Offshore Wind100.00Nuclear Power Plant33.00Utility-scale PV with 2 hour storage100.00Onshore Wind power plant with storage100.00Light Fuel Oil Standalone Generator (1 kW)42.02Solar PV (Distributed with Storage)100.00Off-grid Hydropower100.00
Emission factors
3.5
The emission factor measures how much pollution a technology produces relative to its activity level, showing emissions released per unit of operation. Throughout their operational lifespan, power plants release various greenhouse gases, including nitrous oxides, methane, and carbon dioxide. For this research, these emissions are specifically measured in carbon dioxide equivalent (CO_2_e). This study used emission factors from a pre-existing model database [4] that compiles emission data documented by the IPCC [9]. The data is provided in the “CO2 Emission” sheet of the repository’s Excel file and presented in Table 6 (Fig. 1).Table 6. Emission factors.Table 6. TechnologyFuelCO_2_ Emission Factors (kg CO_2_e/GJ)Crude Oil ImportsCrude oil73.3Crude Oil ExtractionCrude oil73.3Biomass ImportsBiomass100Biomass ExtractionBiomass100Coal ImportsCoal94.6Coal ExtractionCoal94.6Light Fuel Oil ImportsLight Fuel Oil69.3Heavy Fuel Oil ImportsHeavy Fuel Oil77.4Natural Gas ImportsNatural Gas56.1Natural Gas ExtractionNatural Gas56.1Fig. 1Emission factors by fuel type.Fig 1
Capacity factor
3.6
The capacity factor indicates how effectively a power generator is utilised by comparing its actual energy production over time against its maximum potential output. Table 7 provides an overview of the capacity factor data for various power generation technologies across different timeslices, which can also be found in the “Capacity Factor & Demand” sheet of the Excel file stored in the repository. The timeslices represent specific temporal divisions used in the energy model, based on Indonesia's equatorial climate patterns: S101 represents the daytime during the dry season (November–March, 6 AM-6 PM), S102 represents the nighttime during the dry season (November–March, 6 PM-6 AM), S103 represents the daytime during the wet season (April–October, 6 AM-6 PM), and S104 represents the nighttime during the wet season (April–October, 6 PM-6 AM). This data is calculated based on assumptions and methods that are obtained from the previous model database [4].Table 7. Capacity factor.Table 7. TechnologyTimeslicesCapacity FactorBiomass Power PlantS101–S1040.7Coal Power PlantS101–S1040.75Geothermal Power PlantS101–S1040.7Light Fuel Oil Power PlantS101–S1040.25Oil Fired Gas Turbine (SCGT)S101–S1040.25Gas Power Plant (CCGT)S101–S1040.55Gas Power Plant (SCGT)S101–S1040.55Solar PV (Utility)S1010S1020.369931481S1030S1040.372241848CSP with StorageS1010.05S1020.3S1030.05S1040.3Large Hydropower Plant (Dam) (>100MW)S101–S1020.551496241S103–S1040.42004426Medium Hydropower Plant (Dam) (10-100MW)S101–S1020.551496241S103–S1040.42004426Small Hydropower Plant (Dam) (<10MW)S101–S1020.551496241S103–S1040.42004426Onshore WindS1010.034587963S1020.030465741S1030.030161232S1040.019900362Offshore WindS101–S1040.2Nuclear Power PlantS101–S1040.825Utility-scale PV with 2 hour storageS1010.061655247S1020.369931481S1030.062040308S1040.372241848Onshore Wind power plant with storageS101–S1040.034948126Light Fuel Oil Standalone Generator (1 kW)S101–S1040.4Solar PV (Distributed with Storage)S1010.061655247S1020.369931481S1030.062040308S1040.372241848Off-grid HydropowerS101–S1020.551496241S103–S1040.42004426
Residual capacity
3.7
The residual capacity parameter indicates the total installed capacity that existed before the modelling timeframe begins, representing all infrastructure and equipment already in place at the starting point of the analysis. Data on existing on-grid capacity is drawn primarily from the Global Energy Monitor’s database of Indonesian power facilities [10]. This raw data is then calculated to derive the final values, which will be described later in Section 3.5. Moreover, for off-grid technologies and the capacity of electricity transmission and distribution networks, the data is sourced from a previous model dataset [4]. The calculated residual capacity values are summarised in Table 8, with detailed data provided in the “Residual Capacity” sheet of the repository’s Excel file.Table 8. Residual capacity of key years (GW).Table 8. Technology20152020202520302035204020452050Biomass Power Plant1.741.7621.741.740000Coal Power Plant24.596635.602648.591643.346643.316638.14526.18414.648Geothermal Power Plant1.3511.9421.961.5251.5051.1670.9390.238Light Fuel Oil Power Plant6.2754.8644.9874.9874.9874.9874.9874.987Oil Fired Gas Turbine (SCGT)0.8193.1783.2073.2073.2073.2073.2073.207Gas Power Plant (CCGT)10.14612.23613.79913.79913.79913.79913.79913.799Gas Power Plant (SCGT)4.3115.3485.3485.3485.3485.3485.3485.348Solar PV (Utility)0.0090.14730.20110.20110.20110.20110.20110.2011CSP with Storage00000000Large Hydropower Plant (Dam) (>100MW)5.0795.6384.539414.539414.539414.539414.539414.53941Medium Hydropower Plant (Dam) (10-100MW)0.1510.4130.5050.5050.5050.5050.5050.505Small Hydropower Plant (Dam) (<10MW)0.030.1060.0420.0420.0420.0420.0420.042Onshore Wind0.001120.154310.010.010.01000Offshore Wind00000000Nuclear Power Plant00000000Utility-scale PV with 2 hour storage00000000Onshore Wind power plant with storage00000000Light Fuel Oil Standalone Generator (1 kW)00000000Solar PV (Distributed with Storage)0.041620.045080.044470.042870.029260.003370.002070.00207Off-grid Hydropower0.014420.014850.014850.014850.014850.012030.010250.00771PEM Electrolyser000.50.40000PEM Fuel Cell000.50.40000Pumped Hydro Storage0000.760000Electricity Transmission58.958.958.958.958.958.958.958.9Electricity Distribution58.958.958.958.958.958.958.958.9
Electricity production
3.8
Power generation data for each technology between 2015 and 2022 is obtained from MEMR’s annual report [11]. The dataset covers electricity production at the national level, encompassing major interconnected grids and large standalone systems across Indonesia. The figures include utility-scale generation from power plants operated by PLN, the state-owned electricity company, as well as independent power producers. The data is presented in Table 9 and stored in the “Electricity Production” sheet of the repository’s Excel file (Fig. 2).Table 9. Electricity production for each technology (PJ).Table 9. Technology20152016201720182019202020212022Biomass Power Plant1.65962.10241.92241.89360.78840.7020.79920.5724Coal Power Plant348.32353.74534.11571.59444.15653.89688.08742.334Geothermal Power Plant15.8114.2514.7514.4514.856.0357.2360.0372Light Fuel Oil Power Plant67.8951.6159.5254.6332.5924.2323.1221.888Oil Fired Gas Turbine (SCGT)4.4417.2317.2317.2322.1532.6937.2738.9016Gas Power Plant (CCGT)141.54152.5600135.93121.22136.71138.51Gas Power Plant (SCGT)21.2722.310011.5717.1125.1523.6052Solar PV (Utility)0.020.020.020.020.020.020.430.78383CSP with Storage00000000Large Hydropower Plant (Dam) (>100MW)36.0249.9944.7338.6235.5643.0263.980.478Onshore Wind0.01440.021600.67681.73521.70281.5661.2744Fig. 2Electricity production by technology in Indonesia (2015–2022).Fig 2
Renewable energy potential
3.9
Indonesia possesses various renewable energy sources, including solar, wind, geothermal, hydropower, and bioenergy. Data regarding both the potential and actual utilisation of these renewable resources comes from the “Indonesia Energy Outlook” annual report published by Indonesia’s National Energy Council [12]. This information is presented in Table 10 and can also be found in the “RE Supply & Potential” sheet within the repository’s Excel file.Table 10. Renewable energy potential.Table 10. Renewable EnergyPotential (GW)Realisation / Power Plant Capacity (GW)Realisation (%)Tidal60.000Geothermal23.02.3610.26 %Bioenergy57.03.135.49 %Wind155.00.150.10 %Hydropower956.697.04 %Solar3,2950.310.01 %Total3,685.012.64****0.34 %
Parameters for flexibility modelling
3.10
The data input for FlexTool is primarily organised across two key sheets: “master” and “unit_type”. The “master” sheet contains information on core parameters and settings that impact the entire model. Meanwhile, the “unit_type” sheet contains the parameters specifying all the technologies that make up the system. As this study focuses solely on the electricity grid, all the technologies considered are electricity generation units. The data used in this study is sourced from publicly accessible reports and databases [13,14]. When Indonesia-specific data is unavailable for certain inputs, the data is obtained from published academic literature [[13], [14], [15], [16], [17], [18]]. The values for the “master” sheet and “unit_type” sheet are summarised in Table 11, Table 12, respectively, and can be found in the “Key Parameters FlexTool” sheet within the repository’s Excel file.Table 11. Key parameters for the “master” sheet in FlexTool.Table 11. ParameterValueCO_2_ Cost (USD/Tonne)2Loss of Load Penalty (USD/MWh)3970Loss of Reserves Penalty (USD/MWh)1000Lack of Inertia Penalty (USD/MWh)30,000Curtailment Penalty (USD/MWh)11Lack of Capacity Penalty (USD/MWh)5000Time Modelled (Year)1Table 12Key parameters for the “unit_type” sheet in FlexTool.Table 12. TechnologyMin. Load (%)Ramp Up (p.u. per min)Ramp Down (p.u. per min)Inertia Constant (MWs/MW)Min. Uptime (hour)Min. Downtime (hour)Biomass Power Plant0.2520.0130.0133222Coal Power Plant0.430.0740.0742.6323434Gas Power Plant0.240.0840.0844.6922424Geothermal Power Plant0.4130.0330.0331.0631313Oil Fired Gas Turbine (SCGT)0.230.5530.5536.231313Solar PV (Utility)NA13133NANAHydropower Plant0.0540.1530.1532.7931313Onshore WindNA13133NANA*NA = not applicable
Experimental Design, Materials and Methods
4
This section details the sources and processing methods used for specific techno-economic parameters within the dataset. Building upon a pre-existing model dataset, the information has been updated using the most recent data from a wide range of sources. These include databases and reports from international organizations such as the International Renewable Energy Agency (IRENA), and national energy agencies such as Indonesia’s Ministry of Energy and Mineral Resources, through publications like Electricity Statistics and Technology Data for the Indonesian Power Sector, as well as the National Energy Council, through the Indonesia Energy Outlook. Academic sources include peer-reviewed literature on capacity expansion, energy storage, and grid flexibility modelling, published in journals such as Energies, Journal of Energy Storage, and Energy Strategy Reviews. Once collected, the raw data underwent a systematic process of organisation, analysis, and standardisation to meet modelling specifications.
Electricity demand and capacity factor
4.1
The raw electricity demand data is sourced from the pre-existing model dataset [4], while the capacity factor data is calculated by reducing the number of time slices from the original eight time slices to four. This reduction reflects Indonesia’s equatorial climate patterns: the dry season (November–March) and wet season (April–October), combined with daily cycles (daytime: 6 AM-6 PM and nighttime: 6 PM–6 AM). This resulted in four distinct time slices: Dry-Day (S101), Dry-Night (S102), Wet-Day (S103), and Wet-Night (S104). The methodology for reducing these time slices followed Cannone et al.’s approach [19].
Costs
4.2
The primary source for capital and fixed costs data in this study is the “Technology Data for the Indonesian Power Sector: Catalogue for Generation and Storage of Electricity” annual report by MEMR [6]. While this source document contains specific figures until 2022 and forecasts for 2030 and 2050, this study filled in the gaps for other years using the linear projections formula in Excel. These projections span from 2023 to 2070 and were calculated using a constant rate derived from the 2030 and 2050 forecasted values.
Electricity production and technology efficiency
4.3
The electricity production and technology efficiency data are not utilised in their raw form. Historical electricity production figures up through 2022 were taken from MEMR’s “Electricity Statistics of Indonesia” annual report [11], which provided the data in Gigawatt-hours (GWh). These values were then converted to Petajoules (PJ) to ensure compatibility with the unit used in the OSeMOSYS model.
Meanwhile, although technology efficiency is not utilised as a direct input for OSeMOSYS, it is used to calculate the “Input Activity Ratio” parameter, which the model does require. This ratio determines the input units needed per unit of activity for a given technology. For instance, if a natural gas power plant operates at 50 % efficiency and produces one unit of electricity, it requires two units of natural gas input (calculated as 1/50 %). Therefore, in this scenario, the Input Activity Ratio parameter in OSeMOSYS would be set to 2, representing the relationship between the natural gas input and electricity output.
Operational lifetime, renewable energy potential, and emission factors
4.4
Unlike some other parameters, some key sets were used in their original form, including operational lifetime, renewable energy potential, and emission factors. As described in Section 2, these values came from various sources and were input directly into the OSeMOSYS model. The only change made in this study is updating the data based on the most recent annual reports published by the Indonesian government.
Residual capacity
4.5
For off-grid technologies, the residual capacity data is obtained from a pre-existing model dataset, and the raw data is used directly as the model input without any adjustments. On the other hand, the primary source for data on existing on-grid technologies is the Global Energy Monitor’s database [10]. This database provides information about regional power plants in Indonesia, such as their installed capacity, commissioning dates, and projected retirement dates. The database includes both power plants that are currently in operation and those that have been decommissioned since the base year of the model.
Once the data has been collected, it undergoes data processing using the Residual Capacity Calculator workbook, which can be accessed through Zenodo via this link: https://zenodo.org/records/11475824 [20]. To determine the residual capacity for a given year and technology, the capacities of all currently operating power plants of that technology type are added together. The retirement timeline for each plant is then taken into account. Once a plant reaches its assumed retirement year, its capacity is excluded from the residual capacity calculation for that year and all subsequent years.
Limitations
This dataset has limitations, including limited data on off-grid electricity generation and power plant capacity, which results in a primary focus on accessible on-grid data with few off-grid inclusions. The reliance on open-source data requires assumptions, and generic flexibility parameters could potentially limit the model’s precision. Including other off-grid technologies and enhancing data accuracy would be beneficial for developing more robust energy modelling.
Ethics Statement
The authors of this dataset have adhered to the ethical standards for publication in Data in Brief. They affirm that the study does not include participation of human subjects, animal experiments, or data from social media platforms.
CRediT Author Statement
Mutiara Ramadhani Nur Irbah: Conceptualization, Methodology, Formal analysis, Investigation, Data curation, Writing – Original draft preparation. Raphael Slade: Supervision. Mark Howells: Supervision. Neve Fields: Supervision, Writing – Review & editing. Fernando Antonio Plazas-Niño: Project administration, Writing – Review & editing. Emma Richardson: Project administration.
U4RIA Compliance Statement
This work follows the U4RIA guidelines which provide a set of high-level goals relating to conducting energy system analyses in countries [1]. This paper was carried out involving stakeholders in the development of models, assumptions, scenarios and results (Ubuntu / Community). The authors ensure that all data, source code and results can be easily found, accessed, downloaded, and viewed (retrievability), licensed for reuse (reusability), and that the modelling process can be repeated in an automatic way (repeatability). The authors provide complete metadata for reconstructing the modelling process (reconstructability), ensuring the transfer of data, assumptions and results to other projects, analyses, and models (interoperability), and facilitating peer-review through transparency (auditability).
The reference list from the paper itself. Each links out to its DOI / PubMed record.
- 1Howells M.Quiros-Tortos J.Morrison R.Rogner H.Godínez G.Angulo J.Ramos E.Gardumi F.Hülk L.Energy system analytics and good governance -U 4RIA goals of energy modelling for policy support Res. Square 202110.21203/rs.3.rs-311311/v 1 · doi ↗
- 2Cannone C.Hoseinpoori P.Martindale L.Tennyson E.M.Gardumi F.Somavilla Croxatto L.Pye S.Mulugetta Y.Vrochidis I.Krishnamurthy S.Addressing challenges in long-term strategic energy planning in LMI Cs: learning pathways in an energy planning ecosystem Energies 162023726710.3390/en 16217267 · doi ↗
- 3Irbah M.R.N.Technoeconomic data and assumptions for energy systems modelling (O Se MOSYS and Flex Tool) in Indonesia (v 1.0)Zenodo 202410.5281/zenodo.14536072 PMC 1099789638586150 · doi ↗ · pubmed ↗
- 4Paiboonsin P.Oluleye G.Howells M.Yeganyan R.Cannone C.Patterson S.Pathways to clean energy transition in indonesia’s electricity sector with open-source energy modelling system modelling (O Se MOSYS)Energies 1720247510.3390/en 17010075 · doi ↗
- 5Allington L.Cannone C.Pappis I.Cervantes Barron K.Usher W.Pye S.Brown E.Howells M.Zachau Walker M.Ahsan A.Selected "Starter Kit" energy system modelling data for selected countries in Africa, East Asia, and South America (#CCG, 2021)Data Br.42202210802110.1016/j.dib.2022.108021 PMC 894342235341031 · doi ↗ · pubmed ↗
- 6MEMR Technology Data for the Indonesian Power Sector 2024 Directorate General of Electricity 2023 Ministry of Energy and Mineral Resources Jakarta, Indonesia Available online:https://gatrik.esdm.go.id/assets/uploads/download_index/files/c 4d 42-technology-data-for-the-indonesian-power-sector-2024-annoteret-af-kb-pdf(accessed on 28 June 2024)
- 7MEMR National Hydrogen Strategy 2023 Ministry of Energy and Mineral Resources Jakarta, Indonesia
- 8IRENA; ACE Renewable Energy Outlook for ASEAN: A R Emap Analysis; International Renewable Energy Agency (IRENA): Abu Dhabi, 20162016 ASEAN Centre for Energy (ACE)Jakarta Available online:https://www.irena.org/-/media/Files/IRENA/Agency/Publication/2016/IRENA_R Emap_ASEAN_2016_report.pdf(accessed on 28 June 2024)