Endogenous γ-Secretase Is Linked to Phagocytic Activity in Microglial Cells
Emily Williams, Mei C. Q. Houser, Sebastian Torres, Natalia Wieckiewicz, Michael Sadek, Midori Yokomizo, Masato Maesako

TL;DR
This study shows that γ-secretase activity in microglial cells is linked to their ability to phagocytose particles, suggesting a key role for this enzyme in microglial function.
Contribution
The study confirms a direct link between endogenous γ-secretase activity and phagocytic activity in microglial cells using a novel FRET-based biosensor.
Findings
BV-2 microglial cells show cell-to-cell variation in endogenous γ-secretase activity.
Lower γ-secretase activity correlates with impaired phagocytosis of E. coli bioparticles.
Reduced phagocytic activity is associated with decreased γ-secretase activity in Zymosan bioparticle experiments.
Abstract
γ-Secretase has primarily been studied in neurons, whereas increasing evidence highlights its importance in microglia. Previous research has shown that the pharmacological inhibition of γ-secretase impairs microglial phagocytic activity. In this study, we used a genetically encoded Förster resonance energy transfer (FRET)-based biosensor to record γ-secretase activity, aiming to determine if naturally occurring cell-by-cell variations in endogenous γ-secretase activity are associated with phagocytic activity. Using the Notch1 N100 Y-T biosensor, we found that the regulation of endogenous γ-secretase activity varies among individual BV-2 microglial cells. Our multiplexed time-lapse imaging revealed that the phagocytosis of E. coli bioparticles was impaired in cells with lower γ-secretase activity compared to those with higher activity. Complementary biochemical analysis, utilizing…
Genes, proteins, chemicals, diseases, species, mutations and cell lines named across the full text — each resolved to its canonical identifier and authoritative record.
Click any figure to enlarge with its caption.
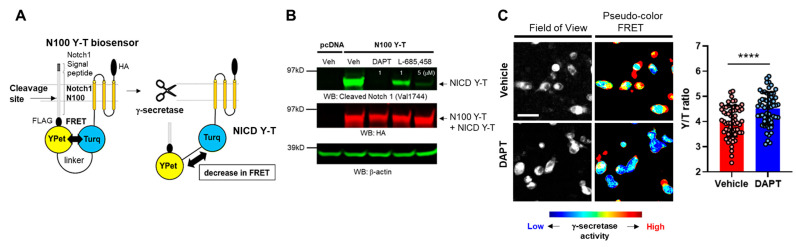 Figure 1
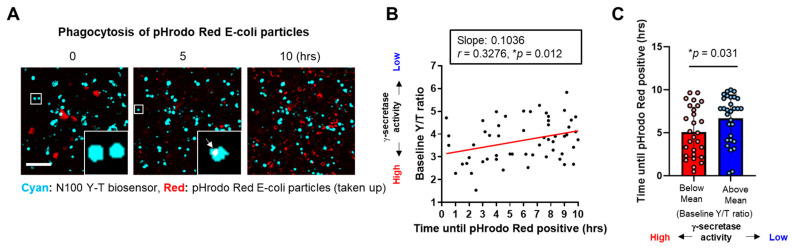 Figure 2
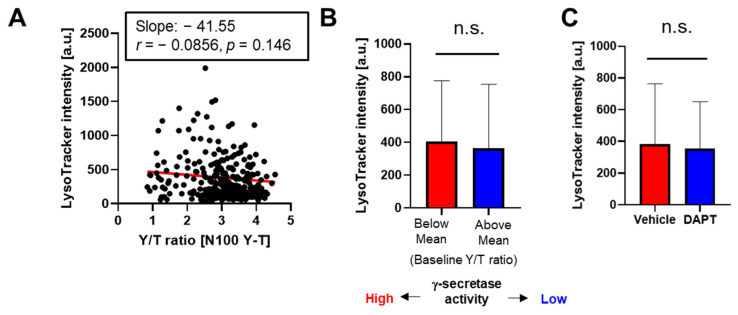 Figure 3
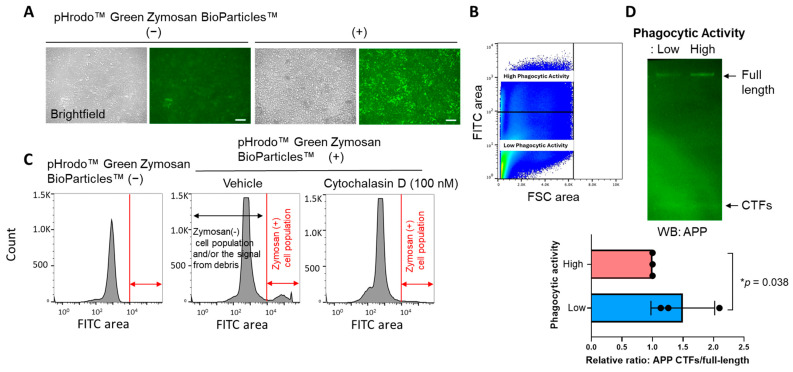 Figure 4
- —National Institute of Health
Peer Reviews
No public reviews on file for this paper yet. If you reviewed it on a platform where reviews are public (OpenReview, ICLR, NeurIPS, ICML), you can paste yours below so the community can read it here.
Videos
No videos yet. Explain this paper in a talk, walkthrough, or lecture? Add one.
Taxonomy
TopicsNeuroinflammation and Neurodegeneration Mechanisms · Adenosine and Purinergic Signaling · Neuroscience and Neuropharmacology Research
1. Introduction
Microglia are the resident macrophages of the central nervous system (CNS), and their normal function, activation, and dysfunction are tightly associated with development, aging, and brain diseases [1,2,3]. Microglia secrete cytokines and neurotropic factors that play pivotal roles in many aspects of immune responses in the CNS. Furthermore, microglia are responsible for phagocytosis, which is crucial for the removal of microbes, dead cells, and protein aggregates that could be harmful to neurons and their functions.
γ-Secretase is an enzyme complex responsible for the proteolytic processing of type I transmembrane proteins. The significance of γ-secretase is well established in neurons, particularly in the context of Notch signaling [4,5,6] and the processing of the amyloid precursor protein (APP) [7,8,9]. However, the role of γ-secretase in other cell types within the CNS remains unclear. Several studies have highlighted the involvement of γ-secretase in microglial migration and cytokine release (reviewed in [10]), while a more recent study has identified a pivotal role for γ-secretase in transcriptional regulation within microglia [11]. As described above, one of the essential functions of microglia is to phagocytose materials such as dead cells, debris, pathogens, and protein aggregates [1,2,3]. Notably, it has been reported that phagocytosis is impaired by the treatment of γ-secretase inhibitor [12], suggesting that γ-secretase is associated with phagocytic activity in microglia.
Several γ-secretase activity assays, such as the cell-free in vitro activity assay [13] and the cell-based reporter assay [14], have been previously developed; however, shortcomings in these assays do not permit an investigation of the dynamics of γ-secretase activity over time in individual cells. To better understand how endogenous γ-secretase activity is spatially and temporally regulated in live/intact cells, we recently developed Förster resonance energy transfer (FRET)-based biosensors for recording endogenous γ-secretase activity [15,16]. These biosensors have enabled us to detect that some cells exhibit higher while the others display lower γ-secretase activity, highlighting cell-by-cell heterogeneity in the regulation of endogenous γ-secretase activity. This unique capability of our biosensors has provided a new opportunity to ensure the correlation between γ-secretase and microglial phagocytic activity in more physiological settings. In this study, we aimed to address whether naturally occurring differences in endogenous γ-secretase activity define microglial phagocytic activities in individual cells.
Here, we record endogenous γ-secretase activity in BV-2 microglial cells using the Notch1 N100 YPet-mTurquoise-GL (N100 Y-T) biosensor [15]. Multiplexed time-lapse live-cell imaging revealed that phagocytic activity is impaired in the cells where endogenous γ-secretase activity is downregulated. Furthermore, we validated this finding using a complementary FACS and Western blot analysis. This new report confirms the previously identified link between γ-secretase and microglia phagocytosis and provides insights into how changes in endogenous γ-secretase activity regulate essential biological event(s) in various cell types.
2. Materials and Methods
2.1. Plasmid DNA, Antibodies, and Reagents
The plasmid encoding the Notch1 N100 Y-T biosensor was developed in a previous study [15]. An anti-APP C-terminus antibody was purchased from BioLegend (San Diego, CA, USA), anti-β-actin was from MilliporeSigma (Burlington, MA, USA), anti-cleaved Notch1 (Val1744) and anti-GAPDH antibodies were from Cell Signaling Technology, Inc (Dover, MA, USA), and anti-HA antibody was from Abcam (Cambridge, UK). γ-Secretase inhibitors DAPT and L-685,458 were purchased from Abcam and DMSO was from MilliporeSigma. pHrodo™ Red Escherichia coli (E. coli) BioParticles™, pHrodo™ Green Zymosan BioParticles™, and LysoTracker™ Deep Red were from Thermo Fisher Scientific (Waltham, MA, USA).
2.2. Cell Culture and Transfection
BV-2 cells were cultured in Opti-MEM Reduced Serum Medium (Thermo Fisher Scientific) with 5% FBS (Atlanta Biologicals Inc., Flowery Branch, GA, USA). The cells were authenticated using STR profiling and monitored for mycoplasma contamination. Lipofectamine 3000 (Thermo Fisher Scientific) was used for transient transfection according to the manufacturer’s instructions.
2.3. Confocal Microscopy and FRET
The Olympus FV3000RS Confocal Laser Scanning Microscope (Tokyo, Japan) was used for fluorescence imaging. The scope is equipped with a CO_2_/heating unit (Tokai-Hit, Fujinomiya, Japan) to maintain a suitable CO_2_ concentration and heating for live-cell imaging. Furthermore, the scope is equipped with the TruFocus Z drift compensation module to maintain focus during time-lapse imaging. A 10x/0.40NA objective was used for image acquisition.
For FRET detection, the cells expressing the N100 Y-T biosensor were excited by a laser at 405 nm, and the emission was simultaneously detected within 460–490 nm and 520–540 nm. A 520–540 nm over 460–490 nm emission ratio (i.e., Y/T ratio) was used as a readout of FRET. Pseudo-colored FRET images were generated using MATLAB version 8.4 (MathWorks, Natick, MA, USA). pHrodo™ Red E. coli BioParticles™ was excited by a laser at 561 nm, and emission was detected within 580–660 nm. A laser at 640 nm was used to excite LysoTracker™ DeepRed, and emission was detected within 670–770 nm. ImageJ version 1.54f was used to measure fluorescent intensity in regions of interest (ROIs).
2.4. Fluorescence-Activated Cell Sorting (FACS) and Western Blot
The Bio-Rad S3e (Hercules, CA, USA) or BD FACSMelody™ cell sorters (Franklin Lakes, NJ, USA) were used for cell sorting. The cells incubated with pHrodo™ Green Zymosan BioParticles™ were excited by a 488 nm laser, and the fluorescence emission was detected within 510–540 nm.
Proteins were extracted from cells using RIPA buffer (MilliporeSigma) with the Halt Protease Inhibitor Cocktail (Thermo Fisher Scientific). The protein concentration was determined using the BCA Protein Assay kit (Thermo Fisher Scientific). The samples were mixed with NuPAGE^TM^ LDS Sample Buffer and NuPAGE^TM^ Sample Reducing Agent (Thermo Fisher Scientific) and boiled for 3 min. Then, the samples were subjected to SDS-PAGE on NuPAGE^TM^ 4–12% Bis-Tris Protein gels (Thermo Fisher Scientific), followed by transfer to nitrocellulose membranes (Thermo Fisher Scientific) using the iBlot™ 2 Gel Transfer Device (Thermo Fisher Scientific). The membranes were incubated with primary and corresponding fluorophore-conjugated secondary antibodies and developed using the LI-COR Odyssey CLx scanner digital imaging system (LI-COR Biosciences, Lincoln, NE, USA).
2.5. Statistical Analysis
GraphPad Prism 9 (GraphPad Software, La Jolla, CA, USA) and Excel were used for the statistical analysis. The D’Agostino and Pearson omnibus normality test was used to examine the Gaussian distribution of the data and the variance equality. The one-sample t-test, unpaired t-test, and Mann–Whitney U test were used to compare the data. The Pearson correlation coefficient was measured to determine if γ-secretase activity correlates with phagocytic activity and/or lysosomal pH. In graphs, the mean and standard deviation (SD) were used as the center value and error bar, respectively. Three independent experiments were, at least, performed to ensure the reproducibility of the results.
3. Results
3.1. Recording Endogenous γ-Secretase Activity in Individual BV-2 Microglial Cells Using the N100 Y-T Biosensor
Pharmacological inhibition of γ-secretase is reported to impair phagocytic activity in microglial cells [12]. Here, we hypothesized that “naturally” altered endogenous γ-secretase activity is also associated with phagocytic activity in individual cells. To test the hypothesis, we employed the FRET-based Notch1 N100 Y-T biosensor, which enables recording endogenous γ-secretase activity on a cell-by-cell basis (Figure 1A) [15]. The N100 Y-T probe was transfected into BV-2 microglial cells, the cells were treated either with potent γ-secretase inhibitors DAPT (1 µM), L-685,458 (1 or 5 µM) or vehicle control for 16 hrs, and the cell lysates were subjected to Western blot. The Notch intracellular domain (NICD) Y-T fragment, which is produced from the N100 Y-T biosensor by γ-secretase cleavage, was significantly decreased by the treatment with γ-secretase inhibitors (Figure 1B), suggesting that endogenous γ-secretase successfully cleaves the N100 Y-T biosensor in BV-2 cells.
We then perform ratiometric spectral FRET analysis to determine if FRET between the donor and acceptor fluorophores within the N100 Y-T biosensor is changed due to γ-secretase cleavage. As such, BV-2 cells expressing the N100 Y-T biosensor were treated with 1 µM DAPT or vehicle control, the cells were excited by a laser at 405 nm, and emitted fluorescence from the donor (T: mTurquoise-GL) and acceptor (Y: YPet) was simultaneously detected using a confocal microscope. In image analysis, a region of interest (ROI) was generated over the entire cell, mTurquoise-GL and YPet fluorescence intensities were measured, and the average Y/T ratio was calculated for individual cells. We verified that the inhibition of the N100 Y-T biosensor cleavage by DAPT significantly increases FRET (Figure 1C), indicating that changes in FRET correlate with endogenous γ-secretase activity, and high FRET efficiency is associated with lower γ-secretase activity in BV-2 cells.
3.2. Phagocytosis Is Impaired in the BV-2 Cells with Lower γ-Secretase Activity
We next incubated BV-2 cells expressing the N100 Y-T biosensor with pHrodo™ Red E. coli BioParticles™ to perform multiplexed live-cell imaging analysis. These particles are pH-sensitive and thus non-fluorescent outside the cell but fluorescent bright red in phagosomes. In the imaging, we first conducted spectral FRET analysis to measure γ-secretase activity at the baseline on a cell-by-cell basis using the N100 Y-T biosensor, as described above. Then, we employed time-lapse live-cell imaging to track how long it took for individual cells to become positive for pHrodo™ Red E. coli BioParticles™ (Figure 2A). We discovered a statistically significant correlation between γ-secretase activity and the time to become E. coli BioParticles™-positive. Notably, cells exhibiting lower γ-secretase activity took longer to become E. coli BioParticles™-positive compared to those with higher activity (Figure 2B). We also divided the cells into two groups based on whether they were below or above the average mean of the Y/T FRET ratio at the baseline (t = 0), representing cell groups with higher or lower γ-secretase activity, respectively. We found that the cells with lower endogenous γ-secretase activity took a significantly longer time to become E. coli BioParticles™-positive compared to those with higher activity (Figure 2C).
To eliminate the possibility that lysosomal pH rather than phagocytic activity is tightly associated with γ-secretase activity in BV-2 microglial cells, we incubated the cells expressing the N100 Y-T biosensor with LysoTracker™ Deep Red that records lysosomal pH. Unlike the pHrodo™ Red E. coli BioParticles™ (Figure 2), we found no correlation between LysoTracker™ Deep Red fluorescence and the Y/T FRET ratio representing γ-secretase activity (Figure 3A). When we divided the cells into groups based on their Y/T FRET ratio, LysoTracker™ Deep Red fluorescence showed no significant difference between the two groups (Figure 3B). Furthermore, we confirmed that LysoTracker™ Deep Red fluorescence did not differ between BV-2 cells treated with γ-secretase inhibitor DAPT or those with the vehicle control (Figure 3C).
Lastly, to verify the result from the time-lapse multiplexed imaging that utilizes E. coli BioParticles™, BV-2 cells were first incubated with pHrodo™ Green Zymosan BioParticles™ for 16 hrs (Figure 4A), and then the cells were subjected to FACS to be sorted out based on the Zymosan fluorescence (Figure 4B). The numbers of Zymosan-positive cells decreased by the treatment of cytochalasin D, a potent phagocytosis inhibitor [17,18], evidencing that the fluorescence is dependent on the phagocytosis of Zymosan BioParticles™ (Figure 4C). Then, the sorted cells with distinct phagocytic activities were subjected to Western blot using an APP C-terminus antibody to assess γ-secretase activity. Strikingly, we found that APP C-terminal fragments, immediate endogenous substrates of γ-secretase, over the APP full-length ratio are significantly increased in the cells with lower phagocytic activity compared to those with higher phagocytic activity (Figure 4D). This suggests that BV-2 cells with reduced phagocytic activity exhibit lower endogenous γ-secretase activity and further supports the link between γ-secretase and microglial phagocytosis.
4. Discussion
The great importance of γ-secretase and its pivotal roles in biology and diseases have been well established; still, how γ-secretase activity is spatial and temporally regulated remains unclear. Our recent development of genetically encoded FRET-based biosensors has allowed for endogenous γ-secretase activity to be recorded over time [15], on a cell-by-cell basis [15,16,19], with subcellular resolution [20,21], not only in vitro but also in vivo [22]. Moreover, the unique capabilities of the biosensors have enabled us to detect the cell-by-cell heterogeneity in endogenous γ-secretase activity and further determine the consequences of naturally altered γ-secretase activity in individual neurons (Yokomizo et al., 2024, in revision). In the present study, we employed the Notch1 N100 Y-T biosensor [15] to record γ-secretase activity in BV-2 microglial cells (Figure 1). Our findings indicate that phagocytic activity (Figure 2 and Figure 4), but not lysosomal pH (Figure 3), is decreased in cells exhibiting lower endogenous γ-secretase activity.
The membrane-bound enzymatic complex γ-secretase is responsible for the proteolytic cleavage of various transmembrane substrates [23]. The enzyme functions at a critical intersection between various cellular pathways such as Notch [4,5,6,24] and most notably APP proteolytic processing [7,8,9], where it facilitates the development of one of the pathological hallmarks of AD. γ-Secretase does not solely function in the APP pathway; thus, γ-secretase inhibitors alone are insufficient to slow down AD progression [25,26], despite demonstrating an ability to reduce the β-amyloid concentration in the CNS [27]. Several studies have highlighted the essential roles played by γ-secretase in microglia, including the modulation of pro-inflammatory cytokine expression and release [28,29] and the regulation of microglial migration [30].
The phagocytic clearance of cell debris, pathogens, and protein aggregates is one of the core functions of microglia [1,2,3,31]. The previous literature has connected γ-secretase to phagocytic activity using a γ-secretase inhibitor [12], establishing a clear cause-and-effect relationship. However, there is limited knowledge about whether microglial phagocytosis in individual cells relies on endogenous γ-secretase activity. Hence, we utilized our FRET-based biosensor and pHrodo™ E. coli BioParticles™ in time-lapse live-cell imaging and realized a heterogeneity of γ-secretase activity on a cell-by-cell basis, which correlated to a similar heterogeneity of microglial phagocytic activity (Figure 2). This correlation was further verified by pHrodo™ Zymosan BioParticles™ adapted to flow cytometry and cell sorting. We identified that the cells demonstrating reduced γ-secretase processing of APP-CTFs were also the cells that had a lower phagocytic efficiency of Zymosan BioParticles™ (Figure 4). Of note, we visualized a decrease in fluorescence in response to a phagocytic inhibitor cytochalasin D treatment, demonstrating the reliability of Zymosan fluorescence in capturing phagocytic activity (Figure 4). We also ensured that our measurements using pHrodo™ E. coli BioParticles™ truly represented phagocytosis rather than changes in lysosomal pH (Figure 3). Altogether, this study employed two different assays (i.e., time-lapse imaging, FACS cell sorting and Western blot) and two distinct bioparticles (i.e., pHrodo™ E. coli and Zymosan BioParticles™) to validate the correlation between phagocytosis and endogenous γ-secretase activity.
Microglial phagocytic activity is regulated by γ-secretase; however, the underlying molecular mechanisms are not fully understood. The triggering receptor expressed on myeloid cells 2 (TREM2) is a type I membrane protein exclusively expressed in microglia [32] and is tightly associated with microglial phagocytic activity [33,34,35]. TREM2 undergoes the regulated sequential intramembrane proteolysis first by α-secretase(s) and then by γ-secretase [36,37,38,39]. To initiate downstream signaling upon ligand activation, TREM2 requires a complex formation with adapter proteins (e.g., DAP12) [32]. It has been reported that the inhibition of γ-secretase activity decreases TREM2-dependent phagocytosis in BV-2 cells [40]. Mechanistically, γ-secretase inhibition results in the accumulation of TREM2 C-term fragments (TREM2 CTFs), limiting the interaction of DAP12 with the functional full-length receptor and thus decreasing DAP12 phosphorylation [36]. TREM2 may, therefore, link between diminished endogenous γ-secretase activity and microglial phagocytosis. Detailed mechanistic research is necessary to establish the exact molecular link between γ-secretase and microglia phagocytosis. Furthermore, phagocytic behavior and regulating factors in BV-2 cells may differ from those of primary microglia and/or microglia in the brain in vivo; thus, validation of the findings in more physiologically relevant models is also necessary.
Lastly, the Y/T ratio from the N100 Y-T biosensor is correlated with the time until pHrodo™ E. coli BioParticles™ positivity in a statistically significant manner (Figure 2C), and its Pearson correlation coefficient (r = 0.3276) is larger than the cut-off used in biological science [41,42]. However, the correlation is mild; therefore, the possible reasons behind the non-robust correlation would be worthwhile to be discussed. First, we think it could be because microglia phagocytic activity is regulated not only by γ-secretase but also by many other factors. Second, the non-robustness could be also related to the design of our biosensor. Whereas we are confident that our FRET biosensor can sensitively record endogenous γ-secretase activity over time on a cell-by-cell basis in live cells, which are fully validated by the series of our previous publications [15,16,19,20,21,22], the exact “purity” of the correlation between the Y/T ratio and γ-secretase activity remains unclear due to the logistics behind the design of the biosensor. The FRET phenomenon relies on orientation and proximity between the donor and acceptor fluorophores. To make our biosensor more proximity-dependent, excluding the contribution of orientation and aiming to increase sensitivity, we optimized the linker length between the donor and acceptor fluorophores from 20 amino acids to 80 amino acids [15]. Yet, our recent findings using multiple different cell types in vitro and in vivo suggest that orientation still plays a role [22]. These findings are particularly important since our FRET biosensor, the N100 Y-T biosensor in this study, uses the SAGG repeat flexible linker, which randomizes the orientation between the donor and acceptor of the sensor as well as that of the biosensor cleavage product. Therefore, we expect that this randomness may create the “dirtiness” in the Y/T ratio, contributing to the appearance of a less striking correlation between the Y/T ratio and the time until pHrodo™ E. coli BioParticles™ positivity.
5. Conclusions
This study verifies a previously discovered link between γ-secretase and phagocytosis in BV-2 microglial cells. Using the N100 Y-T biosensor, we demonstrate that 1) endogenous γ-secretase activity is differently regulated in individual BV-2 cells and, while the correlation is not strong, 2) phagocytic activity is reduced in the cells with diminished endogenous γ-secretase activity. This finding is consistent with earlier research that reported impaired phagocytosis following γ-secretase inhibitor treatment [12]. This study also sheds light on the capability of genetically encoded biosensors to record endogenous γ-secretase activity with single-cell resolution, facilitating a deeper understanding of the spatiotemporal regulation of γ-secretase and its consequences in various cell types beyond neurons.
The reference list from the paper itself. Each links out to its DOI / PubMed record.
- 1Li Q. Barres B.A. Microglia and macrophages in brain homeostasis and disease Nat. Rev. Immunol.20181822524210.1038/nri.2017.12529151590 · doi ↗ · pubmed ↗
- 2Prinz M. Jung S. Priller J. Microglia Biology: One Century of Evolving Concepts Cell 201917929231110.1016/j.cell.2019.08.05331585077 · doi ↗ · pubmed ↗
- 3Pallarés-Moratalla C. Bergers G. The ins and outs of microglial cells in brain health and disease Front. Immunol.202415130508710.3389/fimmu.2024.130508738665919 PMC 11043497 · doi ↗ · pubmed ↗
- 4De Strooper B. Annaert W. Cupers P. Saftig P. Craessaerts K. Mumm J.S. Schroeter E.H. Schrijvers V. Wolfe M.S. Ray W.J. A presenilin-1-dependent gamma-secretase-like protease mediates release of Notch intracellular domain Nature 199939851852210.1038/1908310206645 · doi ↗ · pubmed ↗
- 5Costa R.M. Honjo T. Silva A.J. Learning and memory deficits in Notch mutant mice Curr. Biol.2003131348135410.1016/S 0960-9822(03)00492-512906797 · doi ↗ · pubmed ↗
- 6Alberi L. Liu S. Wang Y. Badie R. Smith-Hicks C. Wu J. Pierfelice T.J. Abazyan B. Mattson M.P. Kuhl D. Activity-induced Notch signaling in neurons requires Arc/Arg 3.1 and is essential for synaptic plasticity in hippocampal networks Neuron 20116943744410.1016/j.neuron.2011.01.00421315255 PMC 3056341 · doi ↗ · pubmed ↗
- 7De Strooper B. Saftig P. Craessaerts K. Vanderstichele H. Guhde G. Annaert W. Von Figura K. Van Leuven F. Deficiency of presenilin-1 inhibits the normal cleavage of amyloid precursor protein Nature 199839138739010.1038/349109450754 · doi ↗ · pubmed ↗
- 8Wolfe M.S. Xia W. Ostaszewski B.L. Diehl T.S. Kimberly W.T. Selkoe D.J. Two transmembrane aspartates in presenilin-1 required for presenilin endoproteolysis and gamma-secretase activity Nature 199939851351710.1038/1907710206644 · doi ↗ · pubmed ↗