Perceived supervisor support and its impact to job performance: Dataset from the hospitality industry in Vietnam
Bao Han Le, Cong Hiep Duong, Gam Thi Nguyen

TL;DR
This paper presents a dataset showing how supervisor support affects job performance in Vietnam's hospitality industry.
Contribution
The study introduces a dataset from Vietnam's hospitality sector linking supervisor support to job performance through job satisfaction and commitment.
Findings
Perceived supervisor support significantly influences job performance through job satisfaction and organizational commitment.
The dataset provides insights for improving employee performance management in Vietnam’s hospitality industry.
PLS-SEM analysis reveals the interplay between PSS, JS, OC, and JP.
Abstract
The dataset explores the intricate relationship between Perceived Supervisor Support (PSS) and Employee Job Performance (JP) within Vietnamese hospitality industry. It highlights the critical influence of Job Satisfaction (JS) and Organizational Commitment (OC) against the backdrop of the country's socialist economic structure. A structured questionnaire was circulated among travel agencies in Northern Vietnam, collecting 322 valid responses via snowball sampling. Data were rigorously analyzed using Partial least squares structural equation modeling (PLS-SEM) to clarify how PSS, JS, OC, and JP interact. The data highlights the pivotal impact of PSS, JS, and OC on enhancing JP and provides strategic insights for policy makers to improve employee performance management in the Vietnam’s hospitality industry.
Genes, proteins, chemicals, diseases, species, mutations and cell lines named across the full text — each resolved to its canonical identifier and authoritative record.
Click any figure to enlarge with its caption.
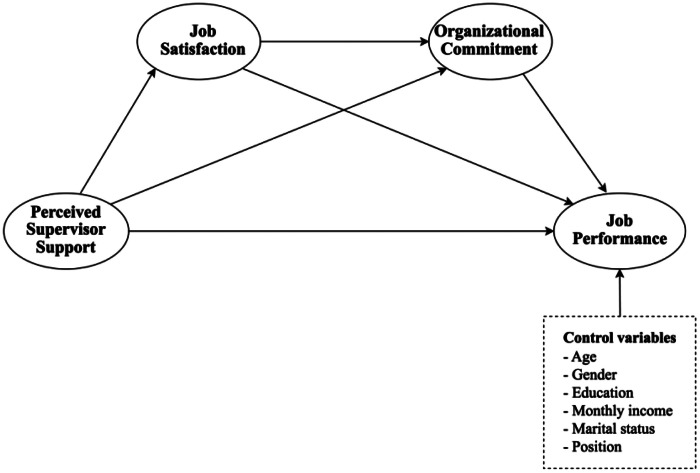 Figure 1
 Figure 2
Peer Reviews
No public reviews on file for this paper yet. If you reviewed it on a platform where reviews are public (OpenReview, ICLR, NeurIPS, ICML), you can paste yours below so the community can read it here.
Videos
No videos yet. Explain this paper in a talk, walkthrough, or lecture? Add one.
Taxonomy
TopicsJob Satisfaction and Organizational Behavior · Workplace Spirituality and Leadership · Human Resource and Talent Management
Specifications TableSubjectBusiness, Management, and Decision Science.Specific subject areaHuman Resource Management, Hospitality industry, Organizational Behaviour.Type of dataTable, Figure.Raw.Data collectionThe data was gathered directly from September 2023 to March 2024 using the snowball sampling method. Participants completed a detailed questionnaire consisting of seven demographic questions and seventeen additional questions targeting Perceived Supervisor Support (PSS), Job Performance (JP), Job Satisfaction (JS), and Organizational Commitment (OC). Only individuals currently working in the hospitality sector and aged 18 or above were considered eligible for this study. Participants were briefed on the research's objectives and importance prior to answering the survey questions. A total of 480 Vietnamese hospitality workers who met the eligibility criteria were invited to participate through a questionnaire. Ultimately, 360 responses were collected, representing a response rate of 75%. After data cleaning, 322 valid responses were analyzed.Data source locationRegion: Northern of VietnamCountry: VietnamData accessibilityRepository name: Mendeley DataData identification number: 10.17632/c5dwcxwnyj.1Direct URL to data: https://data.mendeley.com/datasets/c5dwcxwnyj/1…Related research article*.*
Value of the Data
1
- •The dataset underscores the significant impact of perceived supervisor support on job performance of employees in the hospitality industry in Vietnam, mediated by increases in organizational commitment and job satisfaction.
- •A survey investigated the impact of Perceived Supervisor Support, Job Satisfaction, and Organizational Commitment on employees' Job Performance in the hospitality industry.
- •Leaders and policy-makers in the hospitality industry can leverage the data analysis results from this study to enhance employee commitment and performance, ultimately driving customer satisfaction and business performance.
- •As one of the first surveys on the impact of PSS on JP in the hospitality industry in Vietnam, this dataset is expected to inspire collaborations with researchers from developed countries or different industry. Such partnerships will facilitate the replication of this study and allow for a comparative analysis of the results.
- •The findings from this data set reveal that perceived supervisor support significantly and positively influences job performance. This aligns with the results of a study conducted by Frear, Donsbach, Theilgard and Shanock [1] and among employees at USA government agency, and also consistent with a study in the telecommunications industry in Pakistan [2]. However, these findings inconsistent with the results of a research conducted in ten small to medium-sized industrial companies in Spain, research indicated that perceived supervisor support does not significantly impact job performance [3].
Background
2
The dataset provides a detailed examination of the relationships among PSS, JS, OC, and JP, specifically within Vietnamese hospitality industry. Prior to the Covid-19 pandemic, international tourism constituted approximately 8% of Vietnam's gross domestic product (GDP), with domestic tourism contributing roughly 4% [1]. Post-pandemic, the hospitality industry in Vietnam is undergoing a phase of recuperation. Reports for 2023 indicate that the nation will accommodate over 12.5 million international visitors and manage the influx of upwards of 108 million tourists, both domestic and international. Vietnamese tourism occupies the sixth position worldwide in terms of growth in search volumes originating from international markets [2]. The hospitality industry in Vietnam harbors substantial capacity for expansion, necessitating a framework for stable and sustainable growth. To this end, managerial staff are pivotal in directing employee efforts towards enhancing JP [3]
Data Description
3
From September 2023 to March 2024, the survey was executed in two stages. First, a pilot survey targeted 50 employees in the hospitality industry in Vietnam. This diverse group included participants from different roles and experience levels to ensure a comprehensive assessment of the clarity and relevance of the questionnaire to a wide range of employees. During the pilot phase, participants were asked to complete the questionnaire and provide feedback on the clarity of the questions and the appropriateness of the response scale. This feedback was critical in identifying any items that were ambiguous or misleading. We simplified the language of some questions that participants found difficult to understand, making them easier for employees at all levels to understand. We also made adjustments to ensure all questions were culturally appropriate and relevant to the specific context of the hospitality industry in Vietnam. Additionally, we conducted an initial analysis of the pilot data to assess the internal consistency of the questionnaire, which resulted in the lowest Cronbach's alpha and Composite reliability coefficients of 0.725 and 0.816, respectively, indicating a high level of reliability.
Second, a broader survey was conducted, accumulating 322 analyzable responses. The data are stored in two principal documents that delineate the data characteristics and its applications. Firstly, “Data-PSS-JP.csv,” includes numerical data from surveys of employees in Vietnam's hospitality industry, structured for statistical analysis and theoretical modeling and comprises 322 responses focusing on PSS, JS, OC, and JP. Secondly, “Questionnaire.docx” contains all the questions utilized in the data collection process. A total of 480 Vietnamese hotel industry employees who met the criteria were invited to participate in the survey via a questionnaire. The study population comprised full-time employees aged 18 years and above. Potential respondents were approached through both personal and professional channels. The author reached out to prospective participants via telephone to invite them to take part in the study. After receiving their consent, the survey questionnaire was administered in person. Participants were then asked to distribute the questionnaire to their colleagues across different departments within their organizations. Additionally, the author designated a representative from each company to assist with data collection and prevent duplicate responses from the same individual. Ultimately, 360 responses were collected, representing a 75% response rate. After cleaning the data by excluding incomplete responses to the questionnaire, 322 valid responses were analyzed. This survey addresses four main aspects: PSS, JS, OC, and JP, as depicted in Fig. 1.Fig. 1. Conceptual model.Fig 1
Table 1 represents the demographic characteristics of respondents, the demographic data reveals that the age group 18-25 was predominantly represented, constituting 43.17% of participants, followed by the 26-36 age group at 34.16%, and a smaller proportion above 47 years at 4.35%. The survey data shows that females were the majority, accounting for 72.67% of participants, this indicates that the majority of the labor force in Vietnam's tourism industry is female, the finding aligns with the report from [4]. In terms of marital status, 25.78% of respondents were single, while 74.22% were married. The majority of respondents were employed as workers (57.45%), with leaders comprising 23.91%, head or deputy directors 14.91%, and a minority involved in festival boards or associations at 3.73%. ComprehensivSe details of the demographic distribution are presented in Table 1.Table 1. Sample characteristis (N=322).Table 1. CodeCharacteristicsCategoriesN(%)Q1Age18-2513943.1726-3611034.1637-475918.32> 47144.35Q2GenderMale8827.33Female23472.67Q3EducationHigh school and below9328.88University/College19861.49Master and above319.63Q4Monthly incomeLess than 301-501-700134.04Q5Marital statusSingle8325.78Married23974.22Q6PositionBoard of Directors123.73Chief/Deputy Chief4814.91Leader7723.91Employee18557.45Note: 1 USD, approximately 25,000 VND during the survey period.Source(s): Authors’ own work.
Each factor in this research was meticulously adapted from prior research to align with the distinct attributes of this research. PSS was evaluated utilized a five-item scale modified from the work of Eisenberger, Stinglhamber, Vandenberghe, Sucharski and Rhoades [5]. Organizational Commitment (OC) was gauged through a fourth-item scale adapted from García-Rodríguez, Dorta-Afonso and González-De-la-Rosa [6]. Satisfaction (JS) was measured by a five-item scale based on the studies of Moqbel, Nevo and Kock [7]. Job Performance (JP) was assessed utilized a three-item scale developed from the study of Moqbel, Nevo and Kock [7]. A five-point Likert scale was used for all constructs in this research. These scale provide a comprehensive and nuanced framework for exploring the complex interactions among various factors influencing JP. Table 2 lists the specific items included in the questionnaire.Table 2. Measurement scale.Table 2. ConstructItemDescriptionSourcesPerceived supervisor support (PSS)PSS1My supervisor strongly considers my goals and valuesEisenberger, Stinglhamber, Vandenberghe, Sucharski and Rhoades [5].PSS2My supervisor cares about my well-beingPSS3My supervisor is willing to help me when I need a special favourPSS4My supervisor shows very little concern for me.PSS5My supervisor takes pride in my accomplishments at workEmployee’s job performance (JP)JP1My performance in my current job is excellentMoqbel, Nevo and Kock [7]JP2I am very satisfied with my performance in my current jobJP3I am very happy with my performance in current jobJob satisfaction (JS)JS1I am very satisfied with my current job.Moqbel, Nevo and Kock [7]JS2My present job gives me internal satisfaction.JS3My job gives me a sense of fulfillment.JS4I am very pleased with my current job.JS5I will recommend this job to a friend if it is advertised/announced.Organizational Commitment (OC)OC1This organization deserves my loyaltyGarcía-Rodríguez, Dorta-Afonso and González-De-la-Rosa [6]OC2I feel a strong sense of belonging to this organizationOC3I would be very happy to spend the rest of my career with this organizationOC4I would recommend this hotel as a place to workSource(s): Authors’ own work
Survey responses were evaluated using a 5-point Likert scale, ranging from “strongly disagree (1)” to “strongly agree (5)”, with mean scores between 4.21 and 4.33. We conducted detailed statistical analyses, which included calculating standard deviation and variance to examine response variability and distribution. Additionally, measures of skewness and kurtosis were calculated to understand the shape of the distribution. This comprehensive statistical analysis is crucial for interpreting response patterns and verifying the reliability of the measured constructs. Essential statistical metrics, including mean, standard deviation, skewness, and kurtosis, are presented in Table 3 and were analyzed using SPSS version 25Table 3Descriptive statistics of the constructs’ items.Table 3. ItemsMeanStd. DeviationSkewnessKurtosisStatisticStd. ErrorStatisticStd. ErrorOC14.240.627-0.2990.136-0.2490.271OC24.310.605-0.3590.136-0.1670.271OC34.320.602-0.3680.136-0.1620.271OC44.320.611-0.4680.1360.2540.271PSS14.280.572-0.0830.136-0.5170.271PSS24.320.612-0.5580.1360.6950.271PSS34.310.592-0.2140.136-0.6090.271PSS44.250.59-0.1210.136-0.4740.271PSS54.240.603-0.2440.136-0.0870.271JS14.30.588-0.270.136-0.0740.271JS24.330.593-0.3380.136-0.1290.271JS34.310.61-0.2930.136-0.6380.271JS44.210.5610.0180.136-0.2330.271JS54.280.581-0.1230.136-0.5250.271JP14.250.587-0.1180.136-0.480.271JP24.30.579-0.1480.136-0.5860.271JP34.280.618-0.3370.136-0.2130.271Source(s): Authors’ own work.
The following tables contain key results for evaluation purposes. Table 4, Table 5, Table 6, Table 7 include the results of a series of statistical analyses that verify convergent validity , discriminant validity and internal consistency reliability of the measurement models and the explanatory and predictive power of the structural model [[8], [9], [10], [11], [12], [13], [14], [15], [16]]. Furthermore, Fig. 2 depicts the configuration of the measurement model used in the dataset.Table 4. Reliability and convergent validity.Table 4. ItemsOuter loadingVIFCACRAVEPSS10.7661.6760.8210.8750.583PSS20.7621.655PSS30.7271.479PSS40.7991.765PSS50.7641.555JP10.8031.4390.7520.8580.669JP20.8161.519JP30.8341.599JS10.7911.7090.8220.8750.584JS20.7591.571JS30.7711.656JS40.7701.658JS50.7301.504OC10.7591.4800.7830.8600.606OC20.7791.534OC30.7801.580OC40.7951.561Source(s): Authors’ own work.Table 5. Discriminant validity with Fornell-Larcker Criterion and HTMT Ratio.Table 5. Fornell-Larcker criterionJPJSOCPSSJP0.818JS0.3480.764OC0.3980.3290.778PSS0.4080.3720.4260.764Heterotrait-Monotrait Ratio (HTMT)JPJSOCPSSJPJS0.442OC0.5170.408PSS0.5180.4530.526Source(s): Authors’ own work.Table 6. Path analysis.Table 6. Pathsf-squareDirect effectsIndirect effectsTotal effectsPSS -> JP0.0600.2400.412PSS -> JS0.1610.3720.372PSS -> OC0.1360.3530.426JS -> JP0.0350.1770.226JS -> OC0.0430.1970.197OC -> JP0.0660.2490.249Age->JP0.1060.106Marital status->JP-0.100-0.100*PSS -> JS -> JP0.066PSS -> OC -> JP0.088PSS -> JS -> OC -> JP0.018**∗ p < 0.05; ∗∗ p < 0.01; ∗∗∗ p < 0.001.Source(s): Authors’ own work.Table 7. Structural model explanatory and predictive power.Table 7. ConstructsR^2^Q^2^PSSJP0.2700.158JS0.1380.078OC0.2150.123Source(s): Authors’ own work.Fig. 2. The PLS-SEM result.Fig 2
Experimental Design, Materials and Methods
4
This study employed a quantitative methodology, building on previous research. Data was gathered using a structured survey questionnaire. Initially, a pilot test with 50 participants was conducted to assess the survey's structure and content. Based on the feedback from this initial phase, the survey questions in the Vietnamese version and the format of the questionnaire have been refined to enhance their effectiveness for the main data collection. The pilot participants reported clear understanding of the questionnaire items. The finalized questionnaire is divided into five sections: Demographics, PSS, JS, OC, and JP.
The questionnaire comprises two distinct sections: the first section solicits demographic data from the respondents, whereas the second section probes into principal variables under investigation. This includes the PSS and JS using five specific questions. OC is gauged through four items, and JP is assessed with three items. Responses were elicited on a five-point Likert scale, extending from “strongly disagree (1)” to “strongly agree (5).”
A meticulous in-person survey was conducted among employees in the hospitality sector of Northern Vietnam, a region notable for hosting three of the eight UNESCO World Heritage sites [17]. Following the data collection, a detailed review ensured the accuracy of the gathered data. The dataset was subjected to rigorous analysis utilizing SPSS version 25 and SmartPLS 3.2.9, ensuring that the AVE, CR, and CA adhered to recommended thresholds. The AVE analysis confirmed that a substantial part of the variance in the constructs is explained by their respective latent variables, not by measurement error, thereby establishing convergent validity. Multicollinearity was examined using the VIF, which verified that the constructs were distinct and not excessively intercorrelated. Additionally, discriminant validity was examined through the Fornell-Larcker criterion and the Heterotrait-Monotrait (HTMT) ratio technique. The study culminated in the creation of a PLS-SEM model that was used to test the hypotheses and clarify the correlations among the constructs involved in the research.
Limitations
Our study examining PSS and JP within the Vietnamese hospitality industry has several limitations. First, the cultural nuances of Vietnam, with their emphasis on hierarchical respect and collective well-being, may uniquely influence employees’ perceptions of supervisory support, potentially differing from other cultural or industry contexts where individualism and self-direction are more prevalent. Additionally, the rapidly growing economic context but relatively low wage structure in Vietnam’s hospitality industry may bias perceptions of job satisfaction and performance relative to industries in more developed economies or industries such as dairy industry, canning industry, and bread, cake, and pastry idustry. These context-specific factors may limit the generalizability of our findings to other contexts or industries without further contextual adjustment or comparative research.
Ethics Statement
Participants were fully informed about the research aims and scope before participating, and their informed agreement was obtained. They remain anonymous, with no possibility of being contacted. Approval from the Institutional Review Board (IRB) was not required for this research. Participation was entirely voluntary, and the survey's cover letter guaranteed participant confidentiality, stating that participation implied consent. The study excluded juveniles and adhered to the principles of the Helsinki Declaration. To ensure security, all data collected is anonymized, personally identifiable information is removed, and a unique code replaces any identifying information, maintaining the privacy and security of all participant adhered to ethical research standards.
Credit Author Statement
Bao Han Le: Conceptualization, Supervision, Methodology, Software, Data curation, Investigation, review & editing; Cong Hiep Duong: Conceptualization, Methodology, Software, Validation, Formal analysis, Visualization; Gam Thi Nguyen: Conceptualization, Methodology, Software, Data curation, Investigation, Original draft preparation, Writing.
The reference list from the paper itself. Each links out to its DOI / PubMed record.
- 1Frear K.A.Donsbach J.Theilgard N.Shanock L.R.Supported supervisors are more supportive, but why? A multilevel study of mechanisms and outcomes J. Bus. Psychol.3312018556910.1007/s 10869-016-9485-2 · doi ↗
- 2Zeb A.Bin Othayman M.Goh G.G.G.Shah S.A.A.Exploring the mediating role of psychological factors in the relationship between supervisor support and job performance J. Model. Manag.201202516318110.1108/JM 2-07-2023-0137 · doi ↗
- 3Ángeles López-Cabarcos M.Vázquez-Rodríguez P.Quiñoá-Piñeiro L.M.An approach to employees’ job performance through work environmental variables and leadership behaviours J. Bus. Res.140202236136910.1016/j.jbusres.2021.11.006 · doi ↗
- 4HANU The Current Status of Vietnam’s Tourism Industry 2022 https://lab-movie.hanu.edu.vn/en/publications/overview-of-travel-and-tourism-agencies-industry/
- 5Eisenberger R.Stinglhamber F.Vandenberghe C.Sucharski I.L.Rhoades L.Perceived supervisor support: contributions to perceived organizational support and employee retention J. Appl. Psychol.873200256510.1037/0021-9010.87.3.56512090614 · doi ↗ · pubmed ↗
- 6García-Rodríguez F.J.Dorta-Afonso D.González-De-la-Rosa M.Hospitality diversity management and job satisfaction: the mediating role of organizational commitment across individual differences Int. J. Hosp. Manag.912020102698
- 7Moqbel M.Nevo S.Kock N.Organizational members’ use of social networking sites and job performance: an exploratory study Inf. Technol. People 263201324026410.1108/ITP-10-2012-0110 · doi ↗
- 8Hair J.F.Joe M.Sarstedt Hopkins L.Kuppelwieser V.G.Partial least squares structural equation modeling (PLS-SEM) an emerging tool in business research Eur. Bus. Rev.262201410612110.1108/EBR-10-2013-0128 · doi ↗