Soil microbiome analysis of cultivated tomato ( Solanum lycopersicum ) plants
Nicolas L. Cerioni, Harrison L. Uhl, Mara A. Welty, Jacob J. Adler

TL;DR
This study compares the soil microbiome of healthy and unhealthy tomato plants, finding that a specific beneficial genus, Sphingomonas, is more abundant in healthy plants.
Contribution
The study identifies Sphingomonas as a potentially beneficial genus for tomato plant health.
Findings
No significant differences in overall bacterial biodiversity were found between healthy and unhealthy tomato plants.
The genus Sphingomonas and its phylum Proteobacteria were significantly more abundant in soil from healthy tomato plants.
The study suggests further research is needed to understand the benefits of Sphingomonas for tomato plants.
Abstract
Microbial biodiversity is critical to tomato plant health. The symbiotic relationship between tomato plants and their soil microbiome influences the plants’ ability to absorb nutrients and adapt to environmental stresses. This study compared the soil microbiome between tomato plants appearing healthy versus those appearing unhealthy. There were no significant differences in overall bacterial biodiversity between the conditions. However, a specific beneficial genus ( Sphingomonas ) and its phylum Proteobacteria (Pseudomonadota) were found at significantly higher amounts in healthy plants’ soil compared to unhealthy plants’ soil. Our findings show the need for further examination of the benefits of Sphingomonas for tomato plants.
Genes, proteins, chemicals, diseases, species, mutations and cell lines named across the full text — each resolved to its canonical identifier and authoritative record.
Click any figure to enlarge with its caption.
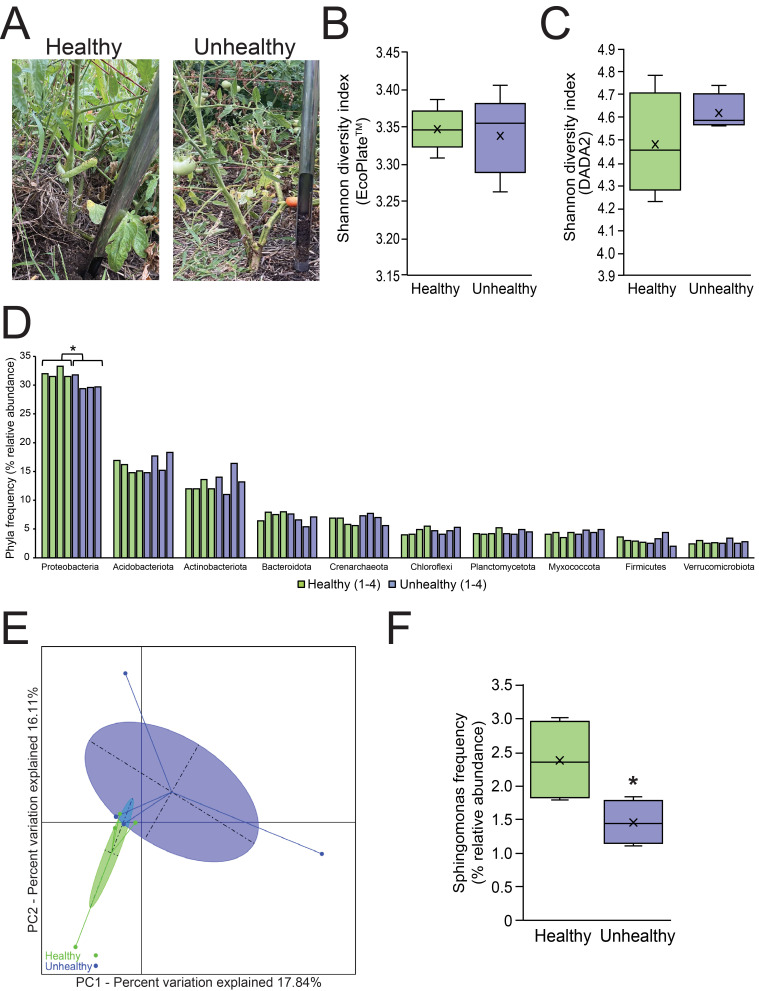 Figure 1
|
|
|
|
|
Soil Samples |
Not Applicable |
Not Applicable |
|
DI Water |
Not Applicable |
Not Applicable |
|
pH Meter |
Orion Star |
A211 |
|
Drying Oven |
Baxter |
DX-41 |
|
EcoPlate |
Biolog |
1506 |
|
ZymoBIOMICS Kit |
Zymo Research |
D4300 |
|
BIOSPEC Nano |
Shimadzu |
206-26300-42 |
|
PCR Machine |
BIO-RAD |
T100 Thermal Cycler |
|
repliQa HiFi ToughMix |
Quantabio |
95200-025 |
|
Primer Forward sIDTP5_515F |
Earth Microbiome Project |
|
|
Primer Reverse sIDTP7_806R |
Earth Microbiome Project |
|
|
IDT xGen™ Amplicon UDI primers |
Integrated DNA Technologies |
Part numbers: 10009846, 10009851, 10009852, and 10009853 |
|
AMPure |
Beckman Coulter |
A63880 |
|
PhiX |
Illumina |
FC-110-3001 |
|
MiniSeq Sequencer |
Illumina |
Not Applicable |
|
Nephele |
National Institutes of Health |
|
Peer Reviews
No public reviews on file for this paper yet. If you reviewed it on a platform where reviews are public (OpenReview, ICLR, NeurIPS, ICML), you can paste yours below so the community can read it here.
Videos
No videos yet. Explain this paper in a talk, walkthrough, or lecture? Add one.
Taxonomy
TopicsAgricultural Development and Management · Agricultural Science and Fertilization · Banana Cultivation and Research
Description
Soil microbial biodiversity is a principal factor in the health and the growth of plants (Tilak et al., 2005). Tomato plants require a diverse and unique presence of microbial organisms and nutrients to optimize the growth of fruit (Bona et al., 2017). Certain factors such as soil pH, moisture content, physical composition, and microbial presence all play a role in supporting plants in their growth (Usharani KV et al., 2019). Depending upon the bacteria taxa present in the soil, increased microbial biodiversity can be beneficial to the plants' health and growth (H. Liu et al., 2017; Saleem et al., 2019).
Here we examined the soil microbial biodiversity of tomato plants grown in soil at a local urban community garden collected on the same day towards the end of the growing season ( Figure 1A ). Plants that held a true green with little to no wilt and had attributions, such as tomato stems, that showed the production of fruit were our healthy samples. Plants that showed wilted leaves, and had brown/tan leaves, with discolorations were considered our unhealthy samples. Visualization alone is not ideal for categorizing plant phenotype as many different variables could contribute to this phenotype. To combat this possible bias, we only utilized plants in the same area of the garden. Further, we had three independent researchers verify the identification of phenotype prior to soil collection. In this study, we wanted to see if the soil microbiome or soil properties were altered when comparing the two associated tomato plant soil phenotypes.
We first examined the soil's pH, moisture content, and overall composition and texture as these have been shown to influence plant health and soil microbial biodiversity (Garbeva et al., 2004; Griffiths et al., 2011; Lange et al., 2014). The mean average pH (+/- standard deviation) of the healthy tomato plant soil (7.82 +/- 0.50) and unhealthy tomato plant soil (7.87 +/- 0.34) were not significantly different (p-value = 0.81). Although both pH readings were slightly higher than the ideal range for tomato plants (pH = 6.2-6.8) for sufficient fruit growth and plant health (Bangera et al., 2023).
Ground conditions need to maintain a certain moisture content for proper plant growth (Seneviratne et al., 2010). Tomato plants grow most efficiently in a soil moisture of 41-80% (Bangera et al 2023). By locking the moisture into the soil, tomato plants can adequately absorb the water needed to maintain life (J. Liu et al., 2019). The mean average soil moisture content (+/- standard deviation) of the healthy tomato plant soil (23.0 +/- 10.0%) and unhealthy soil condition (19.9 +/- 8.8%) were not significantly different (p-value = 0.52). While these moisture content values were lower than recommended, this can likely be attributed to the study occurring during the end of a growing season under drought-like conditions.
The soil composition is another key factor that helps determine soil biodiversity (Garbeva et al., 2004). Therefore, the soil's physical composition was examined and appeared via eye and texture to consist of the same clay soil for both phenotypes. No differences were observed. Overall, there does not appear to be a difference in the three physical characteristics of soil that were examined in our study.
We then examined the functional biodiversity of the soil sites using an EcoPlate ^TM^ . The EcoPlate ^ TM^ detects active metabolism of specific carbon course utilization by heterotrophic bacteria in the soil samples (Stefanowicz, 2006). This carbon source utilization data was used to calculate the Shannon diversity index, richness, and evenness of the two soil conditions as described in (Németh et al., 2021). The mean average (+/- standard deviation) Shannon diversity index value of healthy tomato plant soil (3.35 +/- 0.03) and unhealthy tomato plant soil (3.34 +/- 0.05) were not significantly different (p-value = 0.71) ( Figure 1B ). The mean average richness value of healthy tomato plant soil (29.29 +/- 0.76) and unhealthy tomato plant soil (29.43 +/- 1.51) were also not significantly different (p-value = 0.83). Finally, the mean average evenness value of healthy tomato plant soil (0.99 +/- 0.0033) and unhealthy tomato plant soil (0.99 +/- 0.0053) were also not significantly different (p-value = 0.14). Further, there were no observable overall differences in the utilization of five different carbon source categories (amino acids, amines, carbohydrates, carboxylic acids, and polymers) by the soil microbes between the two soil conditions. Samples were taken during drought-like conditions, which could play a contributing role to the lack of variation in functional biodiversity in the soil samples.
Finally, bacterial biodiversity was examined in the soil samples by extracting genomic DNA (gDNA) from the soil and then using a previously described two-staged PCR amplification protocol (Naqib et al., 2018) to specifically isolate 16S ribosomal RNA (rRNA). These amplicons were then sequenced and FASTQ files were generated. See methodology for details. DADA2 (Callahan et al., 2016) and QIIME 2.0 (Bolyen et al., 2019) downstream analyses were performed on the FASTQ files using the platform Nephele (NIH). The QIIME 2.0 analysis produced taxa bar plots (barplot.qzv) of the taxonomies of the samples.
The alpha diversity measures of Shannon diversity index, richness, and evenness came from the DADA2 pipeline and showed similar trends to those of the EcoPlate ^TM^ results. The average (+/- standard deviation) Shannon diversity index of healthy tomato plant soil (4.48 +/- 0.23) and unhealthy tomato plant soil (4.62 +/- 0.08) were not significantly different (p-value = 0.20) ( Figure 1C ). The average richness of healthy tomato plant soil (135.75 +/- 24.81) and unhealthy tomato plant soil (135.75 +/- 12.50) were also not significantly different (p-value = 0.15). Finally, the mean average evenness value of healthy tomato plant soil (0.91 +/- 0.01) and unhealthy tomato plant soil (0.92 +/- 0.005) were also not significantly different (p-value = 0.53).
The top 10 most abundant phyla based upon the percent relative abundance determined via the QIIME 2.0 pipeline were displayed ( Figure 1D ). The percent relative abundance of most phyla displayed no major differences between the soil conditions for the samples. Interestingly, Proteobacteria (Pseudomonadota) was the only top 10 phylum that showed significantly higher frequency in healthy tomato soil versus unhealthy (p-value = 0.03). This phylum contains 9 unique bacteria taxa shown to play significant roles in tomato plant health and will be described here later.
The rarefaction curves from the DADA2 pipeline indicate that our conditions were sampled evenly. The two conditions were then examined for beta diversity ( Figure 1E ). The adonis test with 999 permutations using relative abundance demonstrated no significant difference between the healthy and unhealthy tomato plant soil conditions (p-value = 0.43). These results are consistent with our Shannon diversity indices ( Figure 1B and 1C) and the phyla taxonomic analysis ( Figure 1D ) and suggest that both types of tomato plants have similar overall microbial community structure in the soil.
The overall taxonomy counts (otu_summary_table.txt) were searched in the DADA2 pipeline for specific bacteria taxa that were of interest because of their reported beneficial or harmful effects on the tomato plant. The following beneficial bacteria were searched based upon previous reports: *Paenibacillus polymyxa * (Zhou et al., 2021) , Paenibacillus *xylanexedens * (Zhou et al., 2021) , Bacillus *velezensis * (Zhou et al., 2021) , Bacillus *endophyticus * (Zhou et al., 2021) , Bacilluscabrialesii (Zhou et al., 2021), Bacillus subtilis (Raji & Thangavelu, 2021; Zhou et al., 2021) , Bacillus cereus (Raji & Thangavelu, 2021), Bacillus licheniformis (Raji & Thangavelu, 2021), Burkholderia cenocepacia (Raji & Thangavelu, 2021), and *Sphingomonas * (Khan et al., 2014). The following harmful bacteria were searched based upon previous reports: Xanthomonas *campestri * (El-Hendawy et al., 2005), Pseudomonas *syringae * (Zhao et al., 2003), Clavibacter *michiganensis * (Nandi et al., 2018), and Ralstonia *solanacearum * (Brown & Allen, 2004). Interestingly, all the researched beneficial and harmful bacteria belong to three phyla: Firmicutes (Bacillota) (10 taxa), Proteobacteria (Pseudomonadota) (9 taxa), and Actinobacteriota (Actinomycetota) (1 taxa). Most of these bacteria were not present in the DADA2 analyses. One genus that was present in our soil samples was Sphingomonas. Interestingly, there was a significantly higher percent relative abundance of the Sphingomonas in the healthy tomato plant soil compared with the unhealthy tomato plant soil (p-value < 0.05) ( Figure 1F ). A similar trend was observed in the QIIME 2.0 analysis of the *Sphingomonas * percent relative abundance. The other genera found in the soil samples — *Pseudomonas and Bacillus * — showed no statistical differences in their percent relative abundance between the two soil conditions based on the DADA2 pipeline analysis.
Sphingomonas is a bacteria that, when present in the soil of tomato plants, produces gibberellins and indole 3-acetic acid, plant growth regulators that can increase the tomato plant growth (Khan et al., 2014). The effect that the presence of Sphingomonas can have on tomato plant growth is significant. The Khan et al. study showed that tomato plants treated with *Sphingomonas * increased their shoot length and dry weight and also the root dry weight (Khan et al., 2014). In our study, Sphingomonas counts were found at a higher frequency in the healthy tomato plant soil condition compared with the unhealthy plant soil condition ( Figure 1F ). Interestingly, *Sphingomonas * belongs to the phyla Proteobacteria (Pseudomonadota), the only top 10 phyla by relative abundance to have a significant difference between healthy and unhealthy soil conditions. Previous work with tomato plants have demonstrated Proteobacteria enrichment in treatments designed to promote healthy soil and tomato plant growth (Liao et al., 2021; Sun et al., 2022). Further, increased Proteobacteria in soil can suppress pathogens and diseases like those that cause tomato wilt (Raaijmakers et al., 2009; Toyoda, 1988). This research seems to point to an importance for the Proteobacteria phylum in terms of overall health of tomato plants. It may be interesting to research this phylum further for other genera that may be beneficial or unique for these healthy tomato plants.
Together, this work indicates that the bacterial genus, Sphingomonas , and its phylum, Proteobacteria, could be playing a role in the health of tomato plants possibly by increasing the number of plant growth regulators in the plant. Future research should examine if there is a direct connection between the health of tomato plants and Sphingomonas in the soil microbiome. Larger amounts of the Sphingomonas bacteria in tomato plant soil could lead to more growth and increased yields in tomato plants. This points to a possible direction for future care for tomato growers.
Methods
Soil Collection
The soil was collected at the Erie Street Community Sharing Garden run by the local nonprofit GrowLocal ^TM ^ in Lafayette, IN, USA on the same day in September 2023. Two different soil corers were used for the two different soil conditions: healthy and unhealthy tomato plant soil; the soil was collected near the base of the stem with a soil depth of approximately 6 inches. The unhealthy tomato plant condition was characterized as the last row of tomato plants in the garden. It contained withered tomato plants with leaves that were tan in color and less fruit than the healthy tomato plants. The healthy tomato plant condition was characterized by their green color, more plentiful fruit, and greater number of leaves. Samples were taken from seven different unique sites for each soil condition.
Soil Property Tests
The pH of the soil conditions was determined using a pH meter. Approximately 3 grams of soil were diluted in 12 milliliters of deionized water and vortexed before the reading were obtained via a pH meter. The soil content moisture was determined by measuring the mass of approximately 1 gram of soil which was set in a laboratory oven at 110 °C for 1 week. The soil moisture content was determined via the formula soil moisture = (dry soil weight – wet soil weight) / (dry soil weight) X 100. The conditions were compared for seven unique samples for each condition. An unpaired assuming unequal variance ttest was used to compare the conditions.
Functional Biodiversity
Functional biodiversity was determined using a carbon source utilization assay with EcoPlate ^TM^ (Biolog, 1506) via the manufacturer's directions. The delta absorbance at 595 nm (Day 7-Day 0) was calculated after removing background absorbance. Delta absorbance readings over the 0.25 threshold were considered a positive read. The number of unique carbon source positive reads were used to calculate the richness (S) values. Shannon Index values (H) were calculated via the formula H = −Σ [p i × ln(p i )]. The calculated p i = the ratio of delta absorbance for one carbon source divided by the total delta absorbance for all carbon sources. Evenness (E) was calculated with the formula E = H/lnS. Carbon source utilization efficiency was calculated via sum of the positive reads for each carbon source divided by the total positive reads of carbon sources for that condition. H, S, and E values were compared for the two conditions via an unpaired assuming unequal variance ttest.
16S rRNA Sequencing Analysis
Genomic DNA (gDNA) was extracted from soil samples using the ZymoBIOMICS ^TM ^ DNA Miniprep Kit (Zymo Research, D4300) according to the manufacturer's directions. Spectrophotometry was used to determine the concentration and the 260/280 and 260/230 nm ratios of the gDNA using a BIOSPEC Nano (Shimadzu, 206-26300-42). Four gDNA samples of both healthy tomato plant soil and unhealthy tomato plant soil that met spectrophotometry standards were PCR amplified with primers sIDTP5_515F and sIDTP7_806R (modified from the primer set employed by the Earth Microbiome Project (EMP; CTACACGACGCTCTTCCGATCT GTGYCAGCMGCCGCGGTAA and CAGACGTGTGCTCTTCCGATCT GGACTACNVGGGTWTCTAAT, respectively – underlined regions represent linker sequences) targeting the V4 region of microbial small subunit ribosomal RNA genes. Amplicons were generated using a two-stage PCR amplification protocol like that described previously (Naqib et al., 2018). The primers contained 5’ common sequence tags (sIDTP5 and sIDTP7) that match 3’ sequences present in IDT xGen™ Amplicon UDI primers (part numbers: 10009846, 10009851, 10009852, and 10009853). First stage PCR amplifications were performed in 10 microliter reactions in 96-well plates, using repliQa HiFi ToughMix (Quantabio). Genomic DNA input was 1 microliter per reaction. PCR conditions were 98 °C for 2 minutes, followed by 28 cycles of 98 °C for 10 seconds, 52 °C for 1 second and 68 °C for 1 second. Subsequently, a second PCR amplification was performed in 10 microliter reactions in 96-well plates using repliQa HiFi ToughMix. Each well received a separate primer pair containing unique dual indices (i.e., from the IDT xGen™ amplicon UDI primer sets). One microliter of PCR product from the first stage amplification was used as template for the 2 ^nd^ stage, without cleanup. Two microliters of primer were used per reaction. Cycling conditions were 98 °C for 2 minutes, followed by 8 cycles of 98 °C for 10 seconds, 60 °C for 1 second and 68 °C for 1 second. Libraries were pooled, purified using a 0.6X AMPure (Beckman-Coulter) cleanup, and sequenced with a 10 % phiX spike-in on an Illumina Miniseq sequencer employing a mid-output flow cell (2x154 paired-end reads). Library preparation, pooling, and sequencing were performed at the Genomics and Microbiome Core Facility (GMCF) at Rush University. These paired-end FASTQ files were then merged to create one FASTQ file. Pre-processing quality control was run on the FASTQ files via Nephele (Weber et al., 2018). Then DADA2 (Callahan et al., 2016) and QIIME 2.0 (Bolyen et al., 2019) downstream analyses were performed. QIIME 2.0 produced taxa barplots (barplot.qzv) of the taxonomies of the samples with counts above the sampling depth. DADA2 produced an otu_summary_table.txt, which provides summaries of the sequence variant counts by sample used to calculate the percent relative abundance based upon total feature counts. Richness (S) and Shannon index (H) were obtained from the DADA2 pipeline. Evenness (E) was calculated with the formula E = H/lnS.
A taxonomic table of the top 10 most abundant phyla was created from the QIIME 2.0 analysis (Bolyen et al., 2019), which was used to derive the percent relative abundance using the generated feature count percentage. The percent relative abundance was compared between the four samples per condition using an unpaired two-sided t-test assuming unequal variance with a p-value threshold set at 0.05.
For beta diversity analysis, the 16S rRNA FASTQ sequence files were analyzed using packages in R version 4.3.3 (R Core Team, 2024). A table of operational taxonomic unit (OTU) data was pulled from the non-rarefied BIOM file produced by the DADA2 analysis (Callahan et al., 2016) using phyloseq using the ‘otu_table’ function (McMurdie & Holmes, 2013). Community beta diversity using relative abundance data was assessed using the ‘adonis’ function from the ‘vegan’ package with a Bray–Curtis dissimilarity index matrix and 999 permutations with an p-value threshold set at 0.05. The ‘betadiper’ function in the ‘vegan’ (Dixon, 2003) package was used to determine group homogeneity. The generalized Unifrac was visualized using principle coordinate analysis ordination (PCoA).
Reagents
**: **
The reference list from the paper itself. Each links out to its DOI / PubMed record.
- 1Bolyen Evan Rideout Jai Ram Dillon Matthew R. Bokulich Nicholas A. Abnet Christian C. Al-Ghalith Gabriel A. Alexander Harriet Alm Eric J. Arumugam Manimozhiyan Asnicar Francesco Bai Yang Bisanz Jordan E. Bittinger Kyle Brejnrod Asker Brislawn Colin J. Brown C. Titus Callahan Benjamin J. Caraballo-Rodríguez Andrés Mauricio Chase John Cope Emily K. Da Silva Ricardo Diener Christian Dorrestein Pieter C. Douglas Gavin M. Durall Daniel M. Duvallet Claire Edwardson Christian F. Ernst Madeleine Estaki Mehrbod Fouquier Jennifer Gaug · doi ↗ · pubmed ↗
- 2Bona Elisa Cantamessa Simone Massa Nadia Manassero Paola Marsano Francesco Copetta Andrea Lingua Guido D’Agostino Giovanni Gamalero Elisa Berta Graziella 2016818 Arbuscular mycorrhizal fungi and plant growth-promoting pseudomonads improve yield, quality and nutritional value of tomato: a field study Mycorrhiza 2710940-636011110.1007/s 00572-016-0727-y 27539491 · doi ↗ · pubmed ↗
- 3Brown Darby G. Allen Caitilyn 2004812 Ralstonia solanacearum genes induced during growth in tomato: an inside view of bacterial wilt Molecular Microbiology 5360950-382X 1641166010.1111/j.1365-2958.2004.04237.x 15341645 · doi ↗ · pubmed ↗
- 4Callahan Benjamin J Mc Murdie Paul J Rosen Michael J Han Andrew W Johnson Amy Jo A Holmes Susan P 2016523 DADA 2: High-resolution sample inference from Illumina amplicon data Nature Methods 1371548-709158158310.1038/nmeth.386927214047 PMC 4927377 · doi ↗ · pubmed ↗
- 5Dixon Philip 200349 VEGAN, a package of R functions for community ecology Journal of Vegetation Science 1461100-923392793010.1111/j.1654-1103.2003.tb 02228.x · doi ↗
- 6El-Hendawy Hoda H. Osman Mohamed E. Sorour Noha M. 2005101 Biological control of bacterial spot of tomato caused by Xanthomonas campestris pv. vesicatoria by Rahnella aquatilis Microbiological Research 16040944-501334335210.1016/j.micres.2005.02.00816255138 · doi ↗ · pubmed ↗
- 7Garbeva P. van Veen J.A. van Elsas J.D. 200491 MICROBIAL DIVERSITY IN SOIL: Selection of Microbial Populations by Plant and Soil Type and Implications for Disease Suppressiveness Annual Review of Phytopathology 4210066-428624327010.1146/annurev.phyto.42.012604.13545515283667 · doi ↗ · pubmed ↗
- 8Griffiths Robert I. Thomson Bruce C. James Phillip Bell Thomas Bailey Mark Whiteley Andrew S. 2011420 The bacterial biogeography of British soils Environmental Microbiology 1361462-29121642165410.1111/j.1462-2920.2011.02480.x 21507180 · doi ↗ · pubmed ↗