U wave mimicking long QT interval: the role of lead selection, repeated electrocardiograms, and premature atrial complexes
Fawzi Kerkouri, Florent Le Ven, Sarah Kerkouri, Jacques Mansourati

Abstract
Genes, proteins, chemicals, diseases, species, mutations and cell lines named across the full text — each resolved to its canonical identifier and authoritative record.
Click any figure to enlarge with its caption.
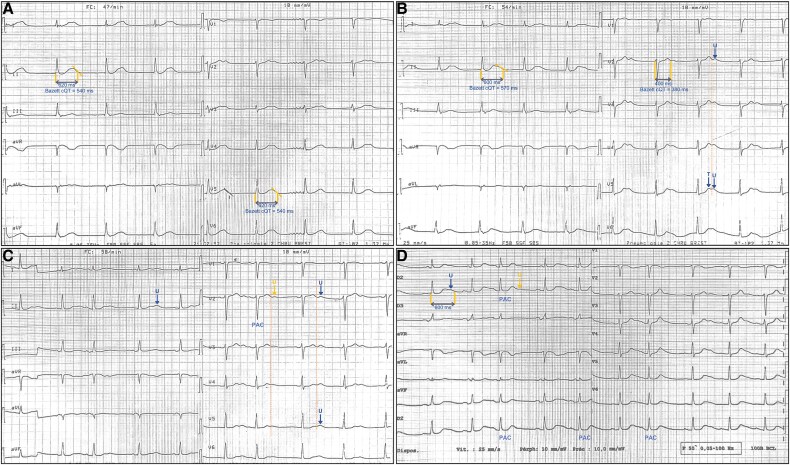 Figure 1
Peer Reviews
No public reviews on file for this paper yet. If you reviewed it on a platform where reviews are public (OpenReview, ICLR, NeurIPS, ICML), you can paste yours below so the community can read it here.
Videos
No videos yet. Explain this paper in a talk, walkthrough, or lecture? Add one.
Taxonomy
TopicsCardiac electrophysiology and arrhythmias · ECG Monitoring and Analysis · Ion channel regulation and function
Case presentation
A 78-year-old woman with hypertension, paroxysmal atrial fibrillation treated by amiodarone (200 mg/day), and idiopathic pulmonary hypertension was admitted for cardiac decompensation. Her baseline electrocardiogram (ECG) showed sinus dysfunction and an apparently prolonged corrected QT (QTc) interval (540 ms) in leads V5 and DII (Figure 1A), without electrolyte disturbances or ischaemia. To determine if this represented true QT prolongation or false prolongation due to U-T wave fusion,^1^ repeated ECGs at varying heart rates were performed. At 54/min, a double wave appeared in V5, suggesting a possible U wave causing false QT prolongation (Figure 1B). At 58/min, the second wave amplitude exceeded the first and notably decreased following premature atrial complexes (PACs). This cycle length variation supports its identification as a U wave rather than a bifid T wave (Figure 1C).^2^ At 62/min after mild exercise, the second wave amplitude further diminished, particularly after PACs, reinforcing its identification as a U wave (Figure 1D). As recommended leads (V5/II) showed persistent U-T wave fusion,^3^ measuring QT interval in these leads would erroneously suggest QT prolongation. Therefore, QT interval was accurately assessed in lead V2, where T and U waves were clearly separated, confirming a normal QT interval of 400 ms.
(A) Baseline ECG at 47/min showing prolonged QT interval in DII/V5. (B) At 54/min, a double wave appeared in V5, suggesting potential U wave fusion. (C) At 58/min, the second wave’s amplitude varied with heart rate and premature atrial complexes, while the T wave remained unchanged, supporting its identification as a U wave. (D) At 62/min, the second wave amplitude decreased, further reduced by premature atrial complexes, confirming the U wave’s sensitivity to cycle length. QT interval was measured in V2, where T and U waves were clearly separated.
The reference list from the paper itself. Each links out to its DOI / PubMed record.
- 1Garson A . How to measure the QT interval–what is normal? Am J Cardiol 1993;72:14B–16B.8256749 10.1016/0002-9149(93)90034-a · doi ↗ · pubmed ↗
- 2Postema PG, Wilde AAM. The measurement of the QT interval. Curr Cardiol Rev 2014;10:287–294.24827793 10.2174/1573403 X 10666140514103612 PMC 4040880 · doi ↗ · pubmed ↗
- 3Tisdale JE, Chung MK, Campbell KB, Hammadah M, Joglar JA, Leclerc J, et al Drug-induced arrhythmias: a scientific statement from the American Heart Association. Circulation 2020;142:e 214–e 233.32929996 10.1161/CIR.0000000000000905 · doi ↗ · pubmed ↗