High expression of THY1 is a prognostic marker for gastric Cancer: Deciphering its transcriptional regulation as a component of the Epithelial–mesenchymal transition
Paulo Rohan, Everton Cruz dos Santos, Pedro Leite Azevedo, Jessica Oliveira da Conceição, Eliana Abdelhay, Renata Binato

TL;DR
High THY1 levels in gastric cancer are linked to poor outcomes, and the study identifies TWIST1 and SNAI2 as key regulators of THY1, connecting it to cancer progression processes.
Contribution
The study identifies TWIST1 and SNAI2 as direct regulators of THY1 and links THY1 to epithelial–mesenchymal transition in gastric cancer.
Findings
THY1 is regulated by six transcription factors, including TWIST1 and SNAI2, which bind directly to its promoter.
THY1 is functionally connected to epithelial–mesenchymal transition and tumor progression in gastric cancer.
A framework for analyzing transcriptional regulation of cancer biomarkers was established using bioinformatics and experiments.
Abstract
Gastric cancer (GC) remains one of the leading causes of cancer-related mortality worldwide, with high molecular heterogeneity contributing to its poor prognosis. Among potential biomarkers, THY1 is associated with aggressive tumor behavior and poor patient outcomes. However, the transcriptional mechanisms governing THY1 expression in GC remain largely unexplored. This study aimed to systematically investigate the upstream regulatory landscape of THY1 and its role in tumor progression. By integrating multicohort transcriptomic data (n = 945), we inferred consensus transcriptional regulatory networks (TRNs) and identified six putative transcription factors (PRRX1, TWIST1, SNAI2, MEIS3, VENTX, and EGR2) as robust regulators of THY1. The functional enrichment analysis revealed that these regulators are involved in the epithelial–mesenchymal transition (EMT) and extracellular matrix…
Genes, proteins, chemicals, diseases, species, mutations and cell lines named across the full text — each resolved to its canonical identifier and authoritative record.
Click any figure to enlarge with its caption.
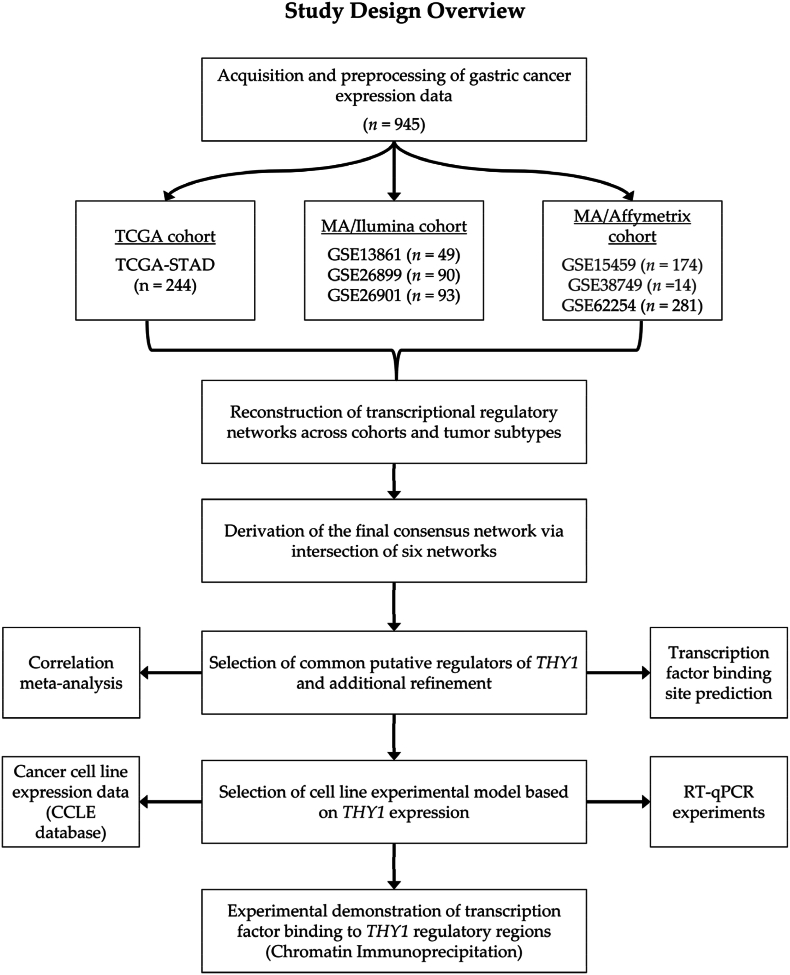 Figure 1
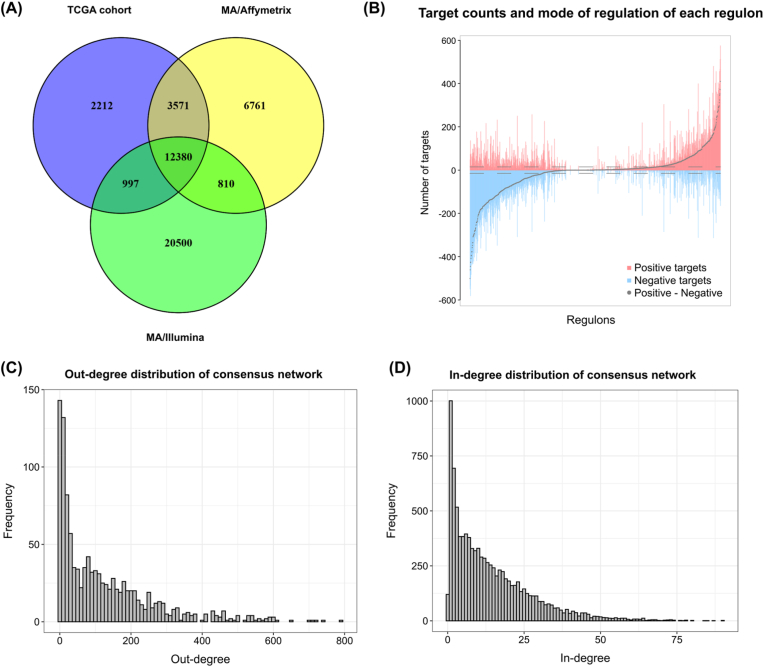 Figure 2
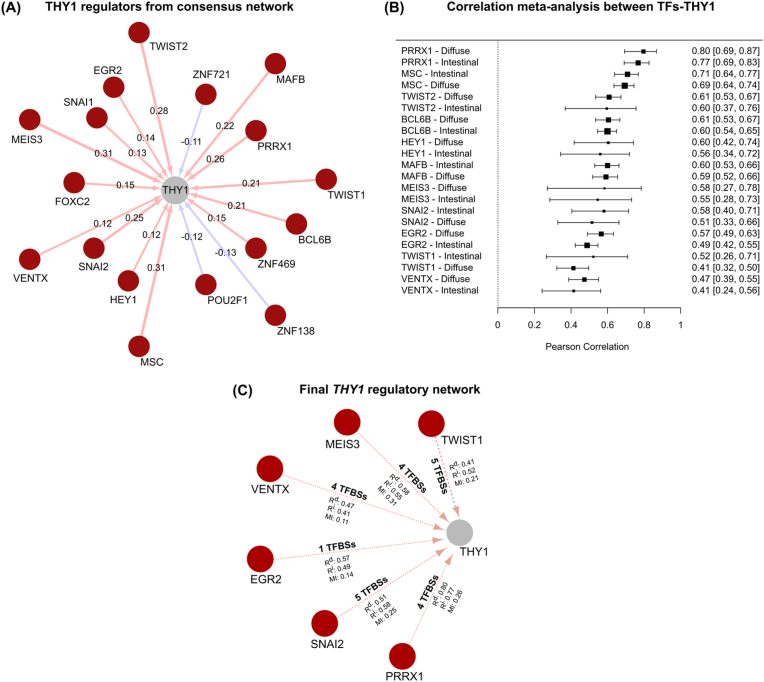 Figure 3
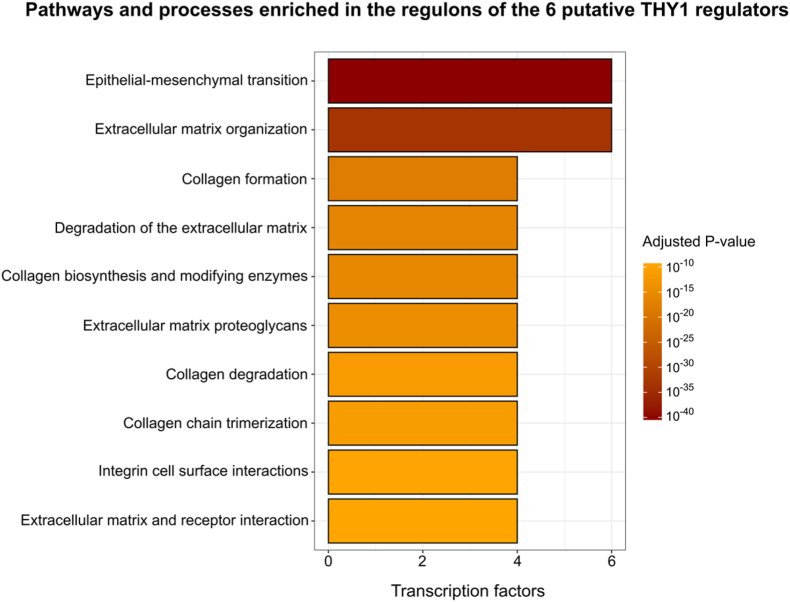 Figure 4
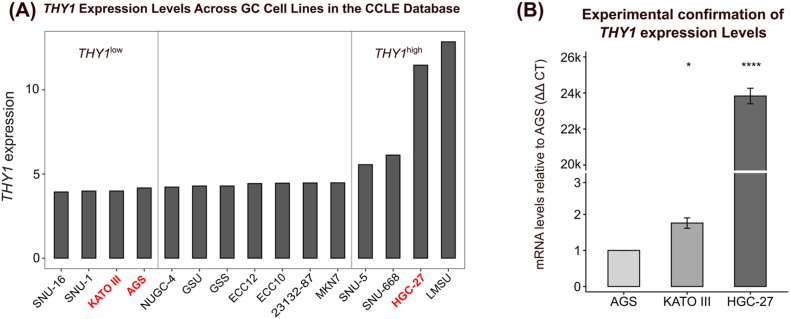 Figure 5
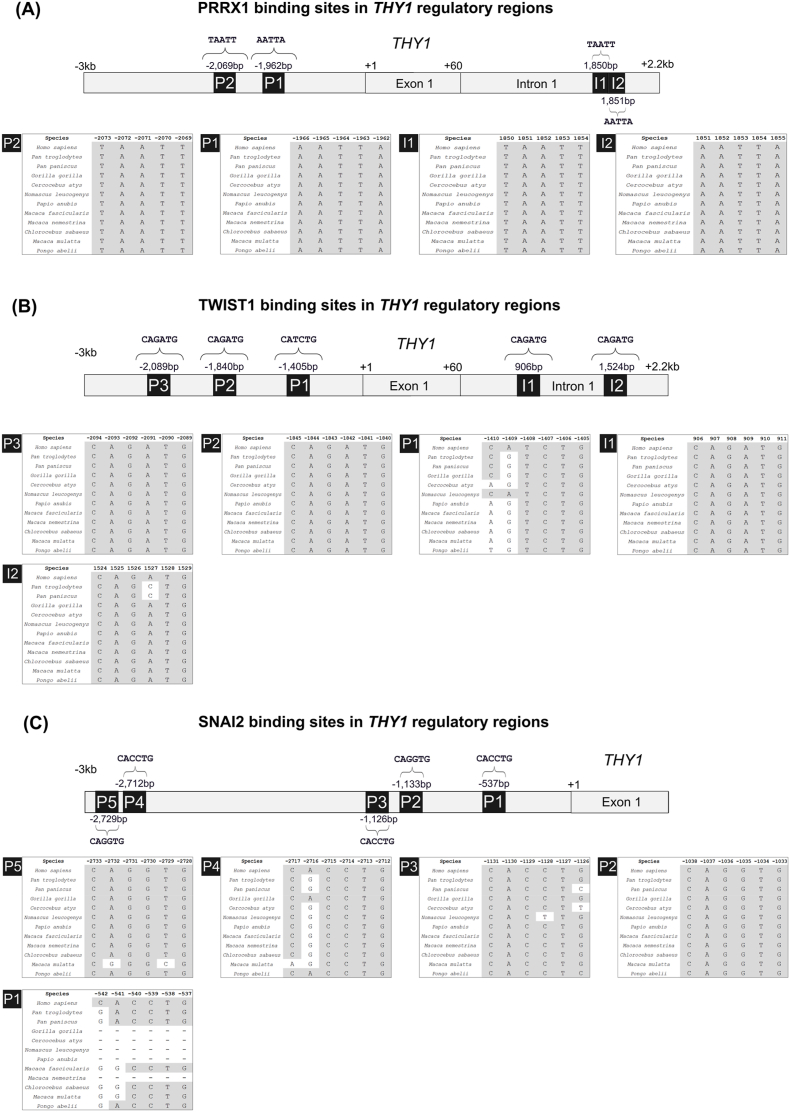 Figure 6
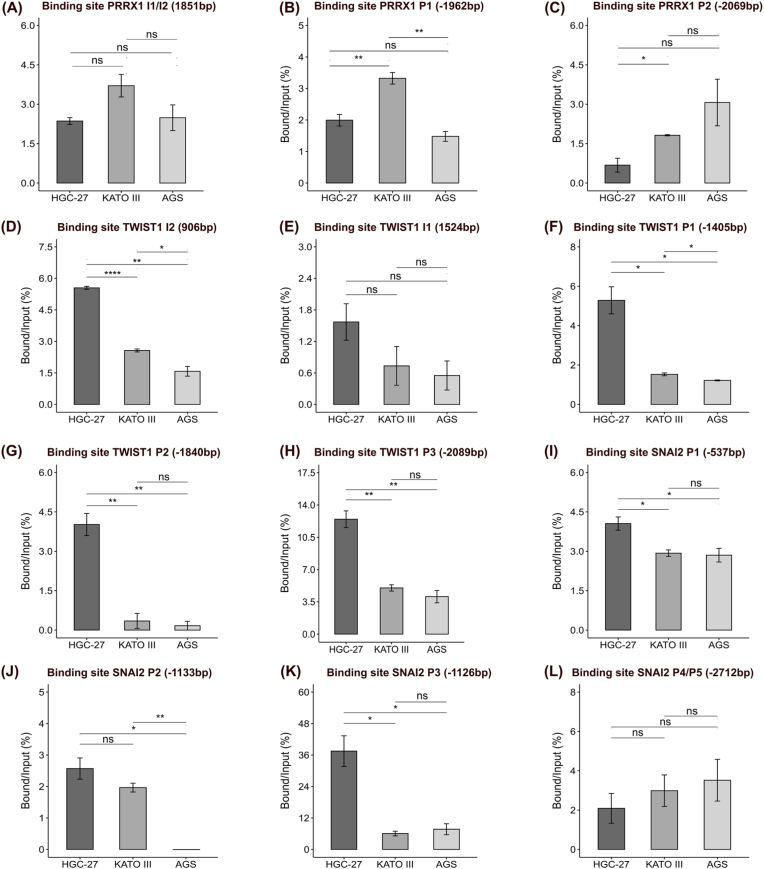 Figure 7
Peer Reviews
No public reviews on file for this paper yet. If you reviewed it on a platform where reviews are public (OpenReview, ICLR, NeurIPS, ICML), you can paste yours below so the community can read it here.
Videos
No videos yet. Explain this paper in a talk, walkthrough, or lecture? Add one.
Taxonomy
TopicsGenetic factors in colorectal cancer · Cancer Cells and Metastasis · Cancer-related molecular mechanisms research
Introduction
1
Gastric cancer (GC) is a highly heterogeneous and aggressive malignancy and is the fifth leading cause of cancer-related death worldwide [1]. Despite advances in diagnostic techniques and therapeutic strategies, the prognosis of GC remains poor, with a five-year survival rate of less than 10 % in patients with advanced disease, which represents the majority of diagnosed cases [2,3]. One of the major challenges in improving patient outcomes is the molecular heterogeneity of GC, which influences tumor behavior, therapy resistance, and disease progression [4]. At the histological level, adenocarcinoma is the predominant type of GC, accounting for 95 % of all cases, and is divided into two main subtypes according to Lauren's classification—intestinal (IGC) and diffuse GC (DGC)—each exhibiting distinct etiological, epidemiological, and genetic characteristics [5,6]. To address this complexity, molecular subtyping and biomarker discovery have become key strategies for refining patient classification and identifying subgroups with distinct prognostic and therapeutic profiles [7]. Among potential biomarkers, THY1 has emerged as a strong candidate because of its association with tumor aggressiveness and poor prognosis of GC [[8], [9], [10], [11], [12]]. However, the regulatory mechanisms governing THY1 expression remain poorly understood, limiting our ability to determine its precise role in GC progression.
THY1, also known as CD90, is a glycosylphosphatidylinositol (GPI)-anchored cell surface glycoprotein that plays critical roles in cell adhesion, migration, and differentiation [[13], [14], [15]]. It is broadly expressed in neurons, thymocytes, fibroblasts, mesenchymal stem cells, and endothelial cells, where it modulates cell–cell and cell–matrix interactions through integrin-mediated signaling [[15], [16], [17]]. In cancer, particularly in carcinomas, THY1 has a context-dependent role, acting as either a tumor suppressor or a promoter of tumor progression, depending on cellular and microenvironmental factors [[18], [19], [20], [21]]. In hepatocellular and renal carcinomas, THY1 expression has been linked to cancer stem-like properties, enhanced invasiveness, and poor prognosis [18,19]. Similarly, in GC, high THY1 expression correlates with aggressive tumor behavior, increased metastatic potential, and worse patient outcomes [[8], [9], [10], [11], [12]]. Additionally, THY1-expressing gastric cancer cells exhibit mesenchymal traits, increased adhesion to the extracellular matrix (ECM), and increased proliferative and migratory potential, facilitating tumor invasion and dissemination [[22], [23], [24]]. Moreover, THY1-positive GC tumor cells have been shown to resist conventional chemotherapy, reinforcing their roles in tumor progression and therapy resistance [25].
Despite its emerging role as a prognostic biomarker, the upstream regulatory mechanisms controlling THY1 expression in GC remain largely unexplored. Previous studies have reported evolutionary divergence in the regulatory elements of THY1 between humans and model organisms, complicating the development of models that accurately reflect human THY1 regulation [26]. Furthermore, THY1 expression is governed by distinct regulatory regions that vary across tissues, with deletions of these regions selectively abrogating expression in some tissues while sparing others [[27], [28], [29]]. Given this context-dependent regulatory complexity and its strong association with tumor aggressiveness, understanding the transcriptional regulation of THY1 is essential for elucidating the molecular programs that drive invasion, metastasis, and therapy resistance. However, the precise mechanisms that control THY1 expression in gastric cancer remain unclear. What triggers its upregulation in aggressive tumors, and what transcription factors dictate its expression? Addressing these questions is crucial for elucidating the role of THY1 in tumor progression.
We systematically investigated the transcriptional regulation of THY1 in GC using a multicohort integrative approach that combines computational modeling with experimental validation to address this challenge. Given the context-dependent nature of THY1 expression and its established association with the EMT and tumor progression [12], we hypothesized that THY1 is embedded within a transcriptional program that governs invasion and metastasis in GC. We inferred transcriptional regulatory networks (TRNs) across independent cohorts and identified candidate regulators that are consistently associated with THY1 expression to test this hypothesis. We refined these findings by performing a correlation meta-analysis and predicting transcription factor-binding sites, allowing us to prioritize six putative transcriptional regulators of THY1. Finally, we validated these regulatory interactions by combining conservation analyses with chromatin immunoprecipitation (ChIP) assays, providing experimental evidence supporting the role of TWIST1 and SNAI2 as potential key regulators of THY1 expression in gastric cancer cells. Together, our findings reveal the transcriptional network that could govern THY1 expression, support a mechanistic link between THY1 and the EMT, and provide a biological rationale for its association with a poor prognosis. By integrating in silico predictions with experimental validation, this study provides a framework for dissecting the regulatory landscapes of key prognostic markers in cancer.
Materials and methods
2
Data acquisition
2.1
Datasets comprising a total of 945 GC samples, including both RNA-seq and microarray data, along with their corresponding clinical information, were obtained from the Genomic Data Commons (GDC) portal and the Gene Expression Omnibus (GEO) database [[30], [31], [32]]. Data retrieval was performed using R version 4.4.2 (https://www.r-project.org/, accessed on January 10, 2025); R software, RRID:SCR_001905) along with Bioconductor (version 3.20 (http://www.bioconductor.org/, accessed on January 14, 2025); Bioconductor, RRID:SCR_006442), and the following packages were used: TCGAbiolinks (version 2.34.0; TCGAbiolinks, RRID:SCR_017683) for TCGA data and GEOquery (version 2.74.0; GEOquery, RRID:SCR_000146) for the GEO data [[33], [34], [35], [36]].
Among the 945 samples, 244 were from TCGA-STAD study, while the remaining 701 were derived from the following GEO studies: GSE13861 (n = 49), GSE15459 (n = 174), GSE26899 (n = 90), GSE26901 (n = 93), GSE38749 (n = 14), and GSE62254 (n = 281). Among these studies, GSE13861 used the Illumina HumanWG-6 v3.0 Expression BeadChip, and GSE26899 and GSE26901 used the Illumina HumanHT-12 V3.0 Expression BeadChip. GSE15459, GSE38749, and GSE62254 employed the Affymetrix Human Genome U133 Plus 2.0 Array. The data were then grouped into three main cohorts: TCGA (n = 244), MA/Illumina (GSE13861, GSE26899, and GSE26901; n = 232), and MA/Affymetrix (GSE15459, GSE38749, and GSE62254; n = 469), where MA stands for microarray. The design and workflow of this study are shown in Fig. 1.Fig. 1. Study design**.** A total of 945 gastric cancer (GC) samples, including both RNA-seq and microarray data, were retrieved along with their corresponding clinical information. These datasets were grouped into three main cohorts: TCGA (n = 244), MA/Illumina (n = 232, combining GSE13861, GSE26899, and GSE26901), and MA/Affymetrix (n = 469, combining GSE15459, GSE38749, and GSE62254). Transcriptional regulatory networks (TRNs) were reconstructed for each tumor subtype (intestinal and diffuse) within each cohort. A final consensus network was derived by intersecting six subtype-specific TRNs across the cohorts. From this consensus network, common putative regulators of THY1 were identified and refined using a correlation meta-analysis and transcription factor binding site predictions. The gastric cancer cell line expression data from the Cancer Cell Line Encyclopedia (CCLE) database were subsequently analyzed to select representative cell lines with high (THY1^high^) and low (THY1^low^) THY1 expression. The selected cell lines were validated using RT‒qPCR, and a robust experimental model was established. Chromatin immunoprecipitation (ChIP) assays coupled with quantitative PCR (ChIP‒qPCR) were performed to assess the binding of transcription factors to THY1 regulatory regions.Fig. 1
Preprocessing and normalization
2.2
For TCGA cohort, we used the median-of-ratios (MRM) method and variance stabilizing transformation (VST) from the DESeq2 package (version 1.46.0; DESeq2, RRID:SCR_015687) to normalize the data [37]. For the microarray data, quantile normalization was applied to the MA/Illumina datasets, whereas the robust multichip average (RMA) method was employed for the MA/Affymetrix cohort using the limma package (version 3.62.2; limma, RRID:SCR_010943) [38]. Batch effect correction for the MA/Affymetrix and MA/Illumina datasets was performed using the sva package (version 3.20.0; sva, RRID:SCR_012836) [39].
Reconstruction of transcriptional regulatory networks
2.3
After normalization, we first identified the set of genes common to all three cohorts by constructing a Venn diagram. Next, we stratified each cohort into intestinal and diffuse subtypes to account for potential biases arising from different tumor subtypes. TRNs were then reconstructed for each subtype in each cohort using the RTN package (version 2.30.0) and the Algorithm for the Reconstruction of Accurate Cellular Networks (ARACne) [40,41].
We relied on the annotations available in the Animal Transcription Factor Database (AnimalTFDB) to identify transcription factors (TFs) [42,43]. We performed 1000 permutations to evaluate the statistical significance of the inferred regulatory interactions, applying a cutoff adjusted p value < 3.28 × 10^−7^. A bootstrap analysis with 1000 iterations was subsequently performed to assess the robustness of these interactions. A data processing inequality (DPI) algorithm was finally applied to remove indirect interactions.
Networks were constructed separately for each subtype in each of the three cohorts, and only the regulatory interactions common to all subtypes and cohorts were retained for downstream analyses. This approach minimized the influence of tumor subtype heterogeneity on the final set of regulatory relationships. Additionally, the generated networks were visualized using Cytoscape software (version 3.10.2; Cytoscape, RRID:SCR_003032) [44].
Correlation meta-analysis
2.4
Using the reconstructed TRNs, we first selected regulatory relationships involving the THY1 gene. The Pearson correlation test was then performed between THY1 and each of its predicted regulators in every cohort and subtype. The metafor package (version 4.6–0) was used to combine these correlations into a single estimate [45]. Specifically, each Pearson correlation coefficient was converted into an effect size via Fisher's z-transformation, and a random-effects model was subsequently fitted to obtain the pooled correlation coefficient and its confidence interval.
Transcription factor binding site prediction
2.5
We first retrieved the putative promoter region of the THY1 gene from the Ensembl canonical transcript ENST00000284240.10 to identify potential binding sites for THY1 regulators [46]. A 3-kb window upstream of the transcription start site was designated the putative promoter. Additionally, we obtained the first intron of THY1 (2186 bp), which is known in the literature to be a regulatory region [27]. Next, we obtained the position weight matrices (PWMs) for the predicted THY1 regulators from the JASPAR2024 package (version 0.99.6) [47]. Using these PWMs, we employed the Biostrings package (version 2.74.1; Biostrings, RRID:SCR_016949) to scan for corresponding binding sites within the 3-kb promoter region or the intron, applying a minimum score threshold of 85 % [48]. Only canonical binding sites meeting this threshold were extracted and considered for further analyses. The following consensus binding sites were used: MSC (MA0665.1; forward: AACAGCTGTT, reverse: AACAGCTGTT), SNAI2 (MA0745.3; forward: CACCTG, reverse: CAGGTG), TWIST1 (MA1123.3; forward: CATCTG, reverse: CAGATG), PRRX1 (MA0716.2; forward: TAATT, reverse: AATTA), EGR2 (MA0472.2; forward: CGCCCACGC, reverse: GCGTGGGCG), HEY1 (MA0823.1; forward: CACGTG, reverse: CACGTG), BCL6B (MA0731.1; forward: AATTCCTAGAAAGCA, reverse: TGCTTTCTAGGAATT), and MEIS3 (MA0775.2; forward: TGTCA, reverse: TGACA). For VENTX (MA0724.1), where a well-established consensus sequence was not observed, we used only the minimum score threshold of 85 %.
Transcription factor binding site conservation
2.6
We retrieved the 3-kb region upstream of the THY1 transcription start site and the first intron for the following species evaluate the conservation of the canonical binding sites for the selected transcription factors: Homo sapiens (GCA_000001405.29), Pan troglodytes (GCA_000001515.5), Pan paniscus (GCA_000258655.2), Gorilla gorilla (GCA_000151905.3), Cercocebus atys (GCA_000955945.1), Nomascus leucogenys (GCA_000146795.3), Papio anubis (GCA_008728515.1), Macaca fascicularis (GCA_011100615.1), Macaca nemestrina (GCA_000956065.1), Chlorocebus sabaeus (GCA_000409795.2), Macaca mulatta (GCA_003339765.3), and Pongo abelii (GCA_002880775.3). The sequences were obtained from the Ensembl genome browser (46). The sequences from these species were aligned using Molecular Evolutionary Genetics Analysis software (MEGA, version 11, RRID:SCR_000667) [49]. The ClustalW algorithm was employed for multiple sequence alignment, and the conservation across the evaluated species and the human genome was visualized [50].
Gene ontology and pathway analyses
2.7
For each TF predicted to regulate THY1, we extracted the corresponding regulon (i.e., the set of genes inferred to be regulated by that TF) and subjected it to an overrepresentation analysis (ORA) using the clusterProfiler package (version 4.14.4; clusterProfiler, RRID:SCR_016884) [51]. Enrichment was assessed at a statistical threshold of p ≤ 0.05. Gene sets were obtained from the Molecular Signatures Database using the msigdbr package (version 7.5.1; msigdbr, RRID:SCR_022870) [52]. We focused on Gene Ontology Biological Processes (GOBPs), hallmark signatures of specific biological states, and curated collections from the Kyoto Encyclopedia of Genes and Genomes (KEGG), WikiPathways, and Reactome [[53], [54], [55], [56], [57]].
Acquisition of publicly available data for gastric cancer cell lines
2.8
We retrieved RNA-seq data from the Cancer Cell Line Encyclopedia (CCLE) to evaluate THY1 expression levels in gastric cancer cell lines [58]. Cell lines lacking information on diffuse or intestinal subtypes were excluded. As with the patient samples, the data were normalized using the median-of-ratios (MRM) method and variance stabilizing transformation (VST) from the DESeq2 package (version 1.46.0; DESeq2, RRID:SCR_015687) [37].
Cell lines
2.9
The HGC-27 (diffuse type) and AGS (intestinal type) cell lines, authenticated by the Cell Bank of Rio de Janeiro (BCRJ), were cultured in DMEM (GIBCO Life Technologies, Carlsbad, CA, USA), whereas the KATO III (diffuse type) cell line, also authenticated by BCRJ, was cultured in IMDM (GIBCO Life Technologies, Carlsbad, CA, USA). The medium of HGC-27 and AGS cells was supplemented with 10 % fetal bovine serum (FBS; HyClone, USA), whereas the medium of KATO III cells were supplemented with 20 % FBS. All the cell lines were cultured in the presence of 100 IU/mL penicillin, 100 μg/mL streptomycin (Invitrogen, CA, USA), and 2 mM l-glutamine (Invitrogen, CA, USA).
Quantitative PCR (RT-qPCR)
2.10
For RT‒qPCR analyses, 2 μg of mRNA was treated with amplification-grade DNase I (Invitrogen, CA, USA) and reverse-transcribed using Superscript III Reverse Transcriptase® (Invitrogen, CA, USA). Each reaction contained 5 μL of SYBR Green PCR Master Mix® (Applied Biosystems, CA, USA), 2.5 μL of cDNA (corresponding to 10 ng of cDNA), and 2 μM of each primer. The reactions were performed in a Rotor-Gene 6000 thermocycler (Corbett, Australia). The cycling program consisted of a preincubation step at 95 °C for 5 min, followed by 45 cycles of 95 °C for 15 s and 62 °C for 40 s. A dissociation (melting) curve analysis confirmed that all the primers generated specific products with comparable amplification efficiencies. The relative fold change in expression was calculated using the 2^−ΔΔCt^ method, as described by Livak and Schmittgen [59]. Each sample was analyzed in triplicate, and B2M and GAPDH were used as internal reference genes. The primers used in this study are shown in Table 1.Table 1. List of primers designed and used in this study.Table 1. NameSequence 5' — 3′StrandSize (bp)TargetTHY-1-FATCGCTCTCCTGCTAACAGTCFoward21THY1THY-1-RCTCGTACTGGATGGGTGAACTReverse21THY1THY1PX_I1_FCTGCATAGCAACGTGAATGTATCFoward23PRRX1 I1/I2 siteTHY1PX_I1_RGGGCTGAGGCTTCGTATTTReverse19PRRX1 I1/I2 siteTHY1PX_P1_FGCTTGGCAGACACAGAATTGFoward20PRRX1 P1 siteTHY1PX_P1_RAGTGTTGCTGGGTGGAAGReverse18PRRX1 P1 siteTHY1PX_P2_FACTCCGATCCTATCCACAGTAAFoward22PRRX1 P2 siteTHY1PX_P2_RTGTGTCTGCCAAGCAAGATReverse19PRRX1 P2 siteTHY1TW_I1_FGGATGGCGAGTGACTTAGFoward18TWIST1 I1 siteTHY1TW_I1_RTCTCTCTGAATCTTACATACCCReverse22TWIST1 I1 siteTHY1TW_I2_FCCGCACAACATCTCAAACAAGFoward21TWIST1 I2 siteTHY1TW_I2_RACAATCAATGCTCTCTCTGTCCReverse22TWIST1 I2 siteTHY1TW_P1_FAAATGCCCTAGAAACCTCTGFoward20TWIST1 P1 siteTHY1TW_P1_RAAGTGGGAGGAGATTCGCTTGGReverse20TWIST1 P1 siteTHY1TW_P2_FAGTGGGAAACGGAGCATCFoward18TWIST1 P2 siteTHY1TW_P2_RGCTTCTGTCTGCCTCTTCATReverse20TWIST1 P2 siteTHY1TW_P3_FACTCCGATCCTATCCACAGTAAFoward22TWIST1 P3 siteTHY1TW_P3_RTGTGTCTGCCAAGCAAGATReverse19TWIST1 P3 siteTHY1SN_P1_FCTGGGTGCTCTGGAATAGATGFoward21SNAI2 P1 siteTHY1SN_P1_RTCTGAAAGGAAGCTGGTTGGReverse20SNAI2 P1 siteTHY1SN_P2_FGAGTGAGAGAAAGTCATCAGCACFoward23SNAI2 P2 siteTHY1SN_P2_RACTGAGTCGAGGCCAACTReverse18SNAI2 P2 siteTHY1SN_P3_FCATAAAGAGGCTGGCAGGAFoward19SNAI2 P3 siteTHY1SN_P3_RTCCTGATAACCCACCGATTGReverse20SNAI2 P3 siteTHY1SN_P4_FGCCTCAAGTCCCAGCTATAAAFoward21SNAI2 P4/P5 siteTHY1SN_P4_RAGGATTACTTGAGCCCAGGAReverse20SNAI2 P4/P5 site
Chromatin immunoprecipitation (ChIP) assays
2.11
We verified the potential binding of TWIST1, PRRX1 and SNAI2 to the THY1 promoter region by using the SimpleChIP Enzymatic Chromatin IP Kit (Magnetic Beads) (Cell Signaling Technology, MA, USA) to perform ChIP assays according to the manufacturer's instructions. Briefly, chromatin from the HGC-27, AGS, and KATO III cell lines—which was previously prepared and digested with micrococcal nuclease—was incubated with 2 μg of either a TWIST1 antibody (sc-81417, Santa Cruz Biotechnology, TX, USA), a PRRX1 antibody (sc-293386, Santa Cruz Biotechnology, TX, USA), a SNAI2 antibody (#9585, Cell Signaling Technology, MA, USA) or a negative immunoprecipitation control consisting of a normal anti-IgG rabbit antibody (#2729, Cell Signaling Technology, MA, USA). In parallel, a 4 % fraction of each chromatin preparation was set aside as the input. The immunoprecipitated DNA was subsequently analyzed by qPCR for predicted binding sites using the primers described in the previous section. The percentage of input (% input) was calculated by normalizing the Ct values from the immunoprecipitated samples to the corresponding input sample. This normalization approach enabled the quantification of relative enrichment at each site across different conditions. For comparative analyses, we tested the significance of differences in % input values among the three cell lines using the Kruskal–Wallis test. When statistically significant differences were identified, we performed pairwise Mann–Whitney U tests, followed by Benjamini–Hochberg correction for multiple comparisons, to determine which specific pairs showed significant differences. These analyses were conducted independently for each predicted binding site.
Statistical analysis
2.12
All the statistical analyses were performed using R software (version 4.4.2, https://www.r-project.org/, accessed on January 10, 2025; R software, RRID:SCR_001905) [33]. For numeric variables, Student's t-test was applied when the data followed a normal distribution, whereas the Mann–Whitney U test was used for nonnormally distributed data. For comparisons involving categorical variables, Fisher's exact test was employed, as appropriate. p values ≤ 0.05 were considered statistically significant. When multiple comparisons were needed, the Benjamini–Hochberg method was used to adjust p values, and adjusted p values ≤ 0.05 were deemed statistically significant.
Results
3
Clinical and molecular characteristics of the cohorts
3.1
We collected gene expression data from 945 gastric cancer samples to delineate the regulatory landscape of gastric cancer and situate THY1 within this context. We selected datasets spanning different gene expression platforms (RNA-seq and microarrays) and diverse clinicopathological characteristics to ensure robust and generalizable findings. After data acquisition, the samples were organized into three study cohorts based on the measurement methodology: TCGA cohort (n = 244, TCGA-STAD), the MA/Affymetrix cohort (n = 469, GSE15459, GSE38749, and GSE62254), and the MA/Illumina cohort (n = 232, GSE13861, GSE26899, and GSE26901).
This three-cohort design was chosen to minimize biases that could arise from relying on a single dataset or gene expression technology. By segregating the microarray data into Illumina and Affymetrix groups, we accounted for platform-specific differences in probe design and normalization pipelines. Moreover, incorporating multiple GSE studies within each microarray-based cohort reduced potential study-specific biases and strengthened the overall reliability of our analyses. All subsequent steps of the study were performed on these three cohorts. The main clinical and pathological features of the patients are described in detail in Table 2.Table 2. Clinicopathological and demographic characteristics of the study cohorts.Table 2. CharacteristicsTCGA cohort, N = 244aMA/Affymetrix Cohort, N = 469aMA/Illumina Cohort, N = 232aSexFemale88 (36 %)165 (35 %)68 (29 %)Male156 (64 %)304 (65 %)164 (71 %) Age67 (35–90)64 (23–92)59 (28–83) Tumor topologyAntrum99 (42 %)142 (52.4 %)121 (52.1 %)Body/Fundus95 (40 %)102 (37.6 %)95 (41 %)Cardia44 (18 %)27 (10 %)11 (4.7 %) Lauren ClassDiffuse64 (26 %)220 (47 %)72 (31 %)Intestinal180 (74 %)249 (53 %)160 (69 %) Pathological StageI30 (13 %)56 (11.9 %)52 (22 %)II102 (44.1 %)117 (25 %)41 (18 %)III85 (36.8 %)167 (35.6 %)78 (34 %)IV14 (6.1 %)129 (27.5 %)61 (26 %)an (%); median (min —max). In this table, unavailable values have been omitted; therefore, percentage values have been calculated relative to the available data.
Comprehensive transcriptional network analysis
3.2
We retained only those genes present across all the transcriptomic platforms in our three cohorts to ensure consistency and robustness in reconstructing the TRNs, yielding a final set of 12,380 genes (Fig. 2A). Among these genes, 1230 were annotated as transcription factors according to the AnimalTFDB and were thus designated potential regulators within the networks. Regulatory interactions were inferred via mutual information for each tumor subtype (diffuse and intestinal) in each cohort, resulting in six separate networks. After performing a permutation analysis with 1000 iterations in each network, we filtered out interactions with an adjusted p value below 3.28 × 10^−7^. We then conducted a bootstrap analysis (1000 iterations) and applied a data processing inequality (DPI) algorithm to remove indirect relationships. Next, we intersected the six resulting networks, retaining only those regulatory interactions that were consistent across all subtypes and cohorts. The final consensus network contained 9493 inferred targets, encompassing 134,997 regulatory connections and 1230 regulons (each consisting of a transcription factor and its predicted targets). For each regulatory connection, the mutual information value in the consensus network represents the average mutual information value across the individual networks. Specifically, 842 regulons included more than 15 inferred targets and were therefore considered more reliable. Of these, 797 presented more than 15 positively or negatively regulated targets, and 539 were classified as “balanced” regulons, each exhibiting at least 15 putative positive and 15 putative negative targets (Fig. 2B).Fig. 2. Transcriptional network construction and structural patterns. (A) Venn diagram showing the overlapping genes detected across the three cohorts' transcriptomic platforms. The central intersection of 12,380 genes represents those retained for network reconstruction. (B) For each regulon in the final consensus network, the numbers of positively regulated targets (red) and negatively regulated targets (blue) are plotted. The gray dots indicate the differences between the number of positive and negative targets (positive–negative). Each bar on the x-axis corresponds to a single regulon, whereas the y-axis shows the number of targets. The dashed horizontal lines mark the threshold of 15 targets. (C) Histogram depicting the out-degree distribution of transcription factors in the final consensus network. The x-axis shows the out-degree values (i.e., how many targets each TF regulates), and the y-axis indicates the frequency of each degree value. (D) Histogram illustrating the in-degree distribution of target genes in the final consensus network. The x-axis shows the in-degree values (i.e., how many TFs regulate each gene), and the y-axis indicates the frequency of each degree value.Fig. 2
We observed that the out-degree distribution followed a skewed pattern typical of biological networks, with a median of 87.5 and a maximum of 793 predicted targets per TF (Fig. 2C). Similarly, the in-degree distribution also showed a skewed profile, with a median of 10 and a maximum of 90 predicted regulators per target (Fig. 2D). In addition, the network exhibited a scale-free-like topology, as indicated by the Kolmogorov–Smirnov test for adequacy to a power-law distribution for both the out-degree (p = 0.07) and in-degree (p = 0.06) profiles. This pattern underscores a hierarchical regulatory structure characteristic of biological networks, with a few key transcription factors acting as major hubs. These hubs are putative master regulators based on their high connectivity and conserved presence across datasets, a hallmark of key regulatory nodes in biological networks. Moreover, the comprehensive construction of the transcriptional network provided a global framework to identify potential master regulators, setting the stage for targeted analyses of THY1 and its regulatory landscape.
Comprehensive refinement identifies six transcription factors as robust regulators of THY1 expression through network inference and binding site prediction
3.3
Building on the comprehensive transcriptional network described above, we next focused on identifying and refining the subset of putative regulators targeting THY1. A total of 17 regulators were identified in the consensus network, including 14 predicted positive regulators and 3 negative regulators. According to the absolute values of mutual information, the top 10 regulators were MEIS3 (0.313), MSC (0.306), TWIST2 (0.281), PRRX1 (0.262), SNAI2 (0.252), MAFB (0.220), BCL6B (0.212), TWIST1 (0.212), ZNF469 (0.153), and FOXC2 (0.151), as summarized in Table 3. A network representation of these regulators is shown in Fig. 3A.Table 3. Putative regulators of the THY1 gene in the consensus transcriptional network.Table 3. Transcription FactorDescriptionTargetWeightaMEIS3Meis homeobox 3THY10.313MSCmusculinTHY10.306TWIST2twist family bHLH transcription factor 2THY10.281PRRX1paired related homeobox 1THY10.262SNAI2snail family transcriptional repressor 2THY10.252MAFBMAF bZIP transcription factor BTHY10.220BCL6BBCL6B transcription repressorTHY10.212TWIST1twist family bHLH transcription factor 1THY10.212ZNF469zinc finger protein 469THY10.153FOXC2forkhead box C2THY10.151EGR2early growth response 2THY10.137SNAI1snail family transcriptional repressor 1THY10.133HEY1hes related family bHLH transcription factor with YRPW motif 1THY10.123VENTXVENT homeoboxTHY10.115ZNF721zinc finger protein 721THY1−0.112POU2F1POU class 2 homeobox 1THY1−0.123ZNF138zinc finger protein 138THY1−0.132aThe weight represents the mutual information value, while the sign indicates the predicted mode of action based on Pearson's correlation coefficient between the regulator and its targets.Fig. 3. Identification and refinement of putative THY1 regulators. (A) Network representation of putative THY1 regulators derived from the final consensus network. Transcription factors (TFs) are shown in dark red, and THY1 is shown in gray. Light red edges indicate predicted positive regulation, whereas blue edges indicate predicted negative regulation. The numerical values on the edges represent the mutual information (MI), and the width of each edge is scaled according to the absolute MI value. (B) Forest plot illustrating the Pearson correlation meta-analysis between each TF and THY1 in the intestinal and diffuse subtypes. TFs are listed in descending order of aggregated correlation magnitude. Only TF–THY1 correlations meeting the significance threshold (p < 0.05) and |R| > 0.4 are displayed. The x-axis shows the combined correlation coefficient obtained using a random-effects model, and the dotted vertical line indicates R = 0. Each TF is listed for both subtypes, with black squares representing the combined correlation estimate and horizontal lines denoting the 95 % confidence interval. The corresponding numeric values (aggregate correlation and 95 % confidence interval) are shown on the right. (C) Network representation of the final regulatory network of THY1 after all refinement steps. TFs are shown in dark red, and THY1 is shown in gray. The number of transcription factor binding sites (TFBSs) for each regulator is indicated on the edge connecting the TF to THY1. Additionally, the numeric values on each edge represent the combined correlation estimates for the diffuse subtype (R^d^) and the intestinal subtype (R^i^), as well as the mutual information (MI) between the TF and THY1.Fig. 3
We performed a Pearson correlation meta-analysis between THY1 and each of the 17 putative regulators, considering both tumor subtypes (diffuse and intestinal) across the three cohorts, to obtain deeper insights into these candidate regulators. For each transcription factor (TF)–THY1–subtype combination, correlation coefficients were calculated for the three cohorts and then aggregated using a random-effects model, resulting in a total of 34 meta-analyses (17 TFs × 2 subtypes). We applied a significance threshold (p < 0.05) and a minimum absolute correlation (|R| > 0.4) for both subtypes, retaining only those TFs that met these criteria in both subtypes. This filtering step yielded 11 TFs, corresponding to 22 relevant meta-analyses (11 TFs × 2 subtypes). Overall, the 11 TFs that satisfied these criteria, listed in descending order of correlation magnitude, were PRRX1, MSC, TWIST2, BCL6B, HEY1, MAFB, MEIS3, SNAI2, EGR2, TWIST1, and VENTX (Fig. 3B).
We searched for consensus binding sites for these transcription factors within the THY1 promoter region (3 kb upstream of the transcription start site) and the first intron (2186 bp) to refine this list further and strengthen the evidence for their regulatory roles. Consensus binding site motifs were obtained from the JASPAR database. Regulators for which no binding site data were available, such as MAFB and TWIST2, were excluded from this analysis. For the remaining nine regulators, we scanned the designated regulatory regions for binding sites using a minimum score threshold of 85 % and retained only canonical binding sites when this information was available.
As a result, six of the nine evaluated regulators had binding sites within the THY1 regulatory regions that met our criteria. SNAI2 had five sites (all in the promoter), TWIST1 had five sites (three in the promoter and two in the intron), PRRX1 had four binding sites (two in the promoter and two in the intron), MEIS3 had four sites (all in the promoter), VENTX had four sites (two in the promoter and two in the intron), and EGR2 had one site (in the promoter). These findings provide robust evidence for the potential direct regulatory effects of these transcription factors on THY1, forming the final regulatory network of THY1 (Fig. 3C).
This integrative approach underscores the robustness of our methodology, which combines statistical correlations with mechanistic predictions to pinpoint transcription factors likely to directly regulate THY1 expression. By incorporating both network-level insights and the regulatory sequence analysis, we provide a multifaceted view of the regulatory framework surrounding THY1. The refined list of six transcription factors provides a robust foundation for exploring the biological roles of these regulators in gastric cancer. We next examined the functional relevance of these factors through an enrichment analysis of their regulons to gain additional insights.
The functional enrichment analysis highlights THY1 as part of a transcriptional program driving the EMT and ECM remodeling in gastric cancer
3.4
Building on the identification of six transcription factors (TFs) as robust putative regulators of THY1, we sought to explore the biological pathways and processes associated with their regulons. These regulons, defined as the sets of genes inferred to be regulated by each TF in the global consensus network, varied in size. Specifically, the regulon sizes for the six putative regulators were as follows: EGR2 (374 targets), VENTX (358 targets), MEIS3 (279 targets), PRRX1 (178 targets), SNAI2 (120 targets), and TWIST1 (92 targets).
For the functional enrichment analysis of these regulons, we used a reference collection of gene sets from the GOBP, Hallmarks, KEGG, WikiPathways, and Reactome databases. Pathways and processes with a corrected p value ≤ 0.05 were considered significantly enriched. The results revealed that the epithelial–mesenchymal transition (EMT) was the most significantly enriched process (p = 3.3 × 10^−41^) and was present in the regulons of all six TFs (Fig. 4). Similarly, extracellular matrix organization was another highly enriched process shared across all six regulons. Additionally, several other processes related to extracellular matrix (ECM) remodeling or cell–matrix interactions were among the top 10 enriched pathways. These processes included collagen formation, degradation of the extracellular matrix, collagen biosynthesis and modifying enzymes, extracellular matrix proteoglycans, collagen degradation, collagen chain trimerization, integrin cell surface interactions, and extracellular matrix–receptor interactions.Fig. 4. Pathways and biological processes enriched in the regulons of the six putative THY1 regulators. The x-axis represents the number of transcription factors whose regulons were significantly enriched for the evaluated signaling pathways and biological processes. The y-axis lists the names of the enriched processes, which are organized in descending order of significance, with the most significant process appearing at the top. The color gradient corresponds to the adjusted p value (Benjamini–Hochberg correction), with orange indicating higher values and dark red representing lower and more significant values.Fig. 4
These findings support the hypothesis that THY1 may be an integral component of the epithelial-mesenchymal transition transcriptional program in the context of gastric cancer. The six inferred regulators orchestrate key pathways involved in ECM remodeling and cell–matrix interactions, processes fundamental for tumor progression and metastasis. These insights guided the selection of experimental models to further validate the regulatory interactions predicted in silico.
Converging evidence from public data and experimental studies highlights the heterogeneity of THY1 expression in gastric cancer cell lines
3.5
Given the robust bioinformatic evidence supporting the regulation of THY1 as a component of an EMT transcriptional program in gastric cancer, we next sought to establish an experimental model to validate the regulation of THY1 by its putative transcriptional regulators. We first examined publicly available gene expression data from gastric cancer cell lines to determine whether the heterogeneity of THY1 expression observed in patients’ tumors is also reflected in these in vitro models and to translate the bioinformatic findings into experimental evidence.
After obtaining RNA-seq data for gastric cancer cell lines from the CCLE database, we filtered the dataset to include only cell lines with available histological subtype information (diffuse or intestinal), resulting in 15 cell lines being evaluated. The data were preprocessed and normalized with the same procedure used for patients’ RNA-seq samples in previous analyses. The cell lines were subsequently ranked by THY1 expression levels and categorized into quartiles, with the lower quartile designated THY1^low^ and the upper quartile designated THY1^high^. This analysis revealed substantial heterogeneity in THY1 expression across the evaluated cell lines (Fig. 5A).Fig. 5. Heterogeneity in THY1 expression in gastric cancer cell lines. (A) Bar graph showing the expression levels of THY1 across gastric cancer cell lines based on CCLE data. The cell lines are arranged from the lowest to the highest THY1 expression levels. The vertical gray lines indicate the lower and upper quartiles of expression, defining the THY1^low^ and THY1^high^ groups, respectively. The cell lines highlighted in red were selected for experimental validation because of their availability in our laboratory. The expression levels are reported as variance-stabilized transformation (VST) values. (B) Bar graph comparing the relative THY1 mRNA expression levels among the HGC-27, KATO III, and AGS cell lines, as determined by RT‒qPCR. A break in the y-axis was introduced to visualize differences across cell lines with distinct expression levels better. All the experiments were conducted in triplicate, and the AGS cell line was used as a reference for comparison. The data are shown as the means ± standard deviations. ns: not significant, ∗p < 0.05, ∗∗p < 0.01, ∗∗∗p < 0.001, and ∗∗∗∗p < 0.0001.Fig. 5
Given the lack of replicates for individual cell lines in the CCLE dataset, which limits the statistical power, and to confirm the trends observed in the public data, we selected representative cell lines from the THY1^high^ and THY1^low^ groups that were available in our laboratory: KATO III and AGS cells for the THY1^low^ group and HGC-27 cells for the THY1^high^ group. Each cell line was cultured in triplicate to ensure robust experimental validation, and RT‒qPCR was performed to measure THY1 expression, with AGS (low expression in the public dataset) used as the reference cell line. Consistent with the RNA-seq results, the HGC-27 cell line exhibited significantly higher expression of THY1 than AGS cells (p < 0.001, Fig. 5B).
These findings confirm the heterogeneity of THY1 expression in gastric cancer cell lines, mirroring the patterns observed in patients’ tumors. By integrating public data with internally performed experiments, we established a robust model for investigating the transcriptional regulation of THY1, ensuring the translational relevance of our bioinformatic predictions.
Experimental evidence supporting TWIST1 and SNAI2 as central regulators of THY1 expression in gastric cancer
3.6
Having established an experimental model of gastric cancer cell lines with high and low THY1 expression, we next aimed to validate the direct regulation of THY1 by its putative transcriptional regulators. Among the six robustly identified regulators, PRRX1, TWIST1, and SNAI2 were selected for experimental validation based on their strong bioinformatic evidence, including the number of predicted binding sites within the THY1 regulatory regions. We assessed the conservation of their binding sites across closely related species to further prioritize these regulators, as conservation in noncoding regions often reflects functional importance.
The conservation analysis revealed varying levels of conservation for the predicted binding sites of PRRX1, TWIST1, and SNAI2. For PRRX1, four binding sites were identified (two in the promoter and two in the intron), all of which were 100 % conserved across the evaluated species (Fig. 6A). TWIST1 exhibited five predicted binding sites (three in the promoter and two in the intron), three of which (I1, P2, and P3) were fully conserved across all the species (Fig. 6B). However, I2 displayed divergence in two species, and P1 showed variability at one position in seven species and at another position in 10 species. For SNAI2, all five predicted binding sites were located in the promoter region, but only P2 demonstrated complete conservation across species (Fig. 6C). P1, located in a region with alignment gaps, exhibited divergence in five species at certain positions and in all 11 species at another position. P3, P4, and P5 showed varying levels of divergence, with P5 displaying the highest conservation among these sites.Fig. 6. Conservation of PRRX1, TWIST1, and SNAI2 binding sites in THY1 regulatory regions. The figure shows the location and conservation of transcription factor binding sites within the THY1 regulatory regions for PRRX1 (A), TWIST1 (B), and SNAI2 (C). At the top of each panel, a schematic representation of the THY1 gene is shown, where +1 marks the transcription start site, and the 3-kb upstream region is defined as the promoter. The first intron begins after the end of exon 1 (+60). Binding sites are labeled with their respective names, and their positions relative to the transcription start site are indicated. Below each schematic, alignment tables show the conservation of binding sites across the evaluated species. Conserved nucleotides are highlighted in gray, whereas nonconserved nucleotides are highlighted in white. The species names are listed on the left, and the nucleotide positions relative to the human sequence are shown above each alignment. The schematics of the gene structure, regulatory regions, and binding site positions are illustrative and not drawn to scale.Fig. 6
Following the conservation analysis, we performed ChIP assays for PRRX1, TWIST1, and SNAI2 in the HGC-27 (THY1^high^), AGS, and KATO III (THY1^low^) cell lines. Primers were designed for the binding site. ChIP‒qPCR was then conducted to assess binding activity. The percent input values were calculated, and the values of the IgG control were subtracted to normalize the results.
The analysis of PRRX1 binding revealed significant but minor differences at specific sites. While the I1/I2 site showed no significant variation across cell lines (Fig. 7A), the P1 site was significantly enriched in KATO III cells relative to the other cell lines, and the P2 site was significantly enriched in KATO III cells compared with HGC-27 cells (Fig. 7B). However, these differences were considerably small (a maximum difference of 1.84 percentage points for P1 and 1.14 for P2), suggesting that while PRRX1 may bind these regions, the magnitude of these differences implies a limited impact on differential THY1 expression in these cell lines. TWIST1 showed greater variability in binding activity across sites and cell lines. Compared with the other cell lines, HGC-27 cells exhibited significantly greater binding at the TWIST1 I2 site (Fig. 7D). However, at the TWIST1 I1 site (Fig. 7E), no significant differences in binding were observed. Furthermore, at the TWIST1 P1 and P2 sites (Fig. 7F and G), significantly higher binding activity was observed in HGC-27 cells than in both AGS and KATO III cells (p < 0.05). Finally, the TWIST1 P3 site (Fig. 7H) showed the greatest difference in binding, with significantly higher activity observed in HGC-27 cells (12.5 % input) than in KATO III (5.01 %) and AGS (4.06 %), representing an approximately 2.5-fold increase over KATO III and a 3.1-fold increase over AGS (150–210 % relative increase; p < 0.05). Interestingly, the TWIST1 P2 and P3 binding sites, which were 100 % conserved across all the analyzed species (Fig. 6B), also demonstrated significant binding activity in HGC-27 cells, suggesting their functional importance in regulating THY1 expression. Conversely, the P1 site, which diverged across multiple species, still exhibited differential binding, highlighting the complexity of THY1 regulatory interactions. SNAI2, like TWIST1, showed significant variability in binding activity across different sites and cell lines. At the SNAI2 P1 site (Fig. 7I), significantly higher binding activity was observed in HGC-27 cells than in both AGS and KATO III cells (p < 0.05), whereas at the SNAI2 P2 site (Fig. 7J), higher binding activity was observed in HGC-27 and KATO III cells than in AGS cells. Additionally, the SNAI2 P3 site (Fig. 7K) presented the greatest difference in binding among all the sites evaluated, with significantly higher activity observed in HGC-27 cells (37.5 % input) than in both KATO III (6.05 %) and AGS (7.71 %) corresponding to a 6.2-fold increase over KATO III and a 4.9-fold increase over AGS (>500 % relative increase; p < 0.05). Finally, at the SNAI2 P4/P5 site (Fig. 7L), no significant difference was observed. This co-occurrence of high TWIST1 and SNAI2 binding in HGC-27 cells raises the possibility of coordinated regulation by these two transcription factors. Moreover, additional functional assays are needed to establish this relationship.Fig. 7. Chromatin immunoprecipitation analysis of PRRX1, TWIST1 and SNAI2 binding sites in THY1 regulatory regions across gastric cancer cell lines. The bar graphs represent the bound/input (%) values for each binding site evaluated. The y-axis indicates the percentage of DNA recovered (bound) relative to the input DNA, and the x-axis shows the cell lines analyzed: HGC-27 (THY1^high^), Kato III, and AGS (both THY1^low^). The title of each panel specifies the transcription factor, the binding site name, and its position within the THY1 regulatory regions. (A–C) correspond to PRRX1 binding sites, (D–H) correspond to TWIST1 binding sites, and (I–L) correspond to SNAI2 binding sites. The error bars represent the standard deviations of three replicates. Statistical significance was determined using pairwise Mann‒Whitney U tests with p value correction. For each bound/input (%) analysis, the bound/input (%) value of the control IgG was subtracted from the value of each cell line. The data are shown as the means ± standard deviations. ns: not significant, ∗p < 0.05, ∗∗p < 0.01, ∗∗∗p < 0.001, and ∗∗∗∗p < 0.0001.Fig. 7
Overall, these results suggest that TWIST1 and SNAI2 likely play prominent roles in the regulation of THY1 expression in the studied gastric cancer cell lines, with specific binding sites (I2, P1, P2, and P3 for TWIST1 and P1, P2, and P3 for SNAI2) in the THY1 regulatory regions contributing to its differential expression. In contrast, PRRX1 binding, while present, showed less pronounced differences between the cell lines, suggesting a potentially less direct or less impactful role. Together, these findings provide experimental evidence supporting TWIST1 and SNAI2 as direct regulators of THY1, integrating bioinformatic predictions and experimental insights into a cohesive model of THY1 transcriptional regulation in the context of gastric cancer.
Discussion
4
This study comprehensively integrated diverse transcriptomic datasets spanning multiple gene expression platforms and clinical characteristics to construct a robust transcriptional regulatory network in gastric cancer. Focusing on the THY1 gene, a known marker of a poor prognosis for patients with gastric cancer, we employed a rigorous multistep refinement process [[8], [9], [10], [11], [12]]. This approach narrowed the 1230 TFs in the network to six putative regulators of THY1: PRRX1, TWIST1, SNAI2, MEIS3, VENTX, and EGR2. By combining consensus network construction, robust correlation meta-analyses, and in silico TFBS predictions, we ensured consistency across platforms, histological subtypes, and cohorts. These findings underscore the robustness of the inferred regulatory relationships and provide a strong foundation for understanding the complex regulation of THY1. TRNs play a critical role in orchestrating gene expression programs, particularly in cancer, where they govern processes linked to tumor progression and the prognosis [60,61]. While previous studies have explored TRNs in gastric cancer, they have largely focused on broad regulatory changes rather than dissecting the regulation of specific genes. In this context, Xu et al. (2016) identified 70 TFs with altered activity that regulate approximately 566 target genes, elucidating pathways involved in gastric tumorigenesis [62]. Similarly, Yu et al. (2022) described the use of transcriptional networks to identify experimentally testable regulatory mechanisms [63]. However, studies that focus specifically on elucidating the regulatory landscape of key prognostic genes such as THY1 remain scarce. Moreover, many network inference studies rely on single datasets or transcriptomic platforms, limiting their generalizability across tumor contexts. By integrating multiple datasets and platforms, our study not only addresses these limitations but also highlights the potential of such approaches to identify robust and biologically meaningful regulatory mechanisms. This methodological rigor is particularly critical in understanding the transcriptional complexity of genes such as THY1, whose expression is highly context dependent and associated with aggressive tumor phenotypes.
Building on the identification of six robust regulators of THY1, our functional enrichment analysis of their regulons revealed that all six transcription factors orchestrate gene expression patterns associated with the epithelial–mesenchymal transition (EMT) and extracellular matrix (ECM) organization. The EMT is a fundamental biological process in which epithelial cells acquire mesenchymal characteristics, lose their cell–cell adhesion ability and gain migratory and invasive capabilities [64]. In cancer, this process is widely recognized as a key driver of tumor progression and metastasis [65]. Similarly, ECM organization plays a critical role in establishing a tumor-permissive microenvironment, facilitating not only tumorigenesis but also invasion and metastatic spread [66]. These processes are intricately linked, as ECM-derived signals are crucial for initiating and sustaining the EMT during tumor progression, whereas the EMT process itself drives ECM remodeling to support tumor progression [67,68]. Consistent with these findings, several of the putative THY1 regulators identified in this study, including PRRX1, SNAI2, TWIST1, and MEIS3, have previously been implicated in regulating the EMT and ECM remodeling in cancer [[69], [70], [71], [72], [73]]. Notably, our group has also shown in prior work that the EMT and matrix remodeling are hallmark processes characterizing gastric tumors with high THY1 expression [12]. Similarly, Xue et al. (2011) showed that gastric cancer stem cells expressing THY1 exhibit mesenchymal features and high expression of EMT markers such as TWIST1 [74]. Additionally, THY1 itself has been described as a regulator of cell–matrix interactions, reinforcing its role in modulating the tumor microenvironment [75]. Taken together, these findings suggest that THY1 is not merely a biomarker of the EMT process but may also be an integral component of the EMT transcriptional program in gastric cancer. This dual role as both a marker of and a potential participant in the EMT may offer a biological explanation for the association between high THY1 expression and a poor prognosis for patients with gastric tumors.
We investigated the regulation of THY1 expression by its putative transcriptional regulators in gastric cancer cell lines to translate our bioinformatic predictions into experimental evidence. Among the six identified regulators, PRRX1, TWIST1, and SNAI2 were prioritized for our experiments based on their robust bioinformatic data and strong associations with EMT pathways. After confirming the THY1 expression pattern in cell lines—HGC-27 (THY1^high^) and KATO III and AGS (THY1^low^)—we integrated conservation analyses of binding sites with chromatin immunoprecipitation assays to assess direct regulatory interactions. Our findings revealed that TWIST1 and SNAI2 play prominent roles as direct regulators of THY1, with significant binding activity observed in the HGC-27 cell line, whereas PRRX1 exhibited less pronounced differences across the evaluated cell lines, suggesting a potential role in the basal regulation of THY1. Prior studies have highlighted the evolutionary divergence of THY1 regulatory elements between humans and model organisms, complicating the development of in vivo models that accurately reflect human THY1 regulation [26]. Moreover, THY1 expression is governed by distinct regulatory regions that vary across tissues, with the deletions of these regions selectively impacting expression in some tissues while sparing others [[27], [28], [29]]. These findings underscore the importance of identifying THY1 regulators in the specific context of gastric cancer. Although the transcriptional regulation of THY1 in cancer remains largely unexplored, Lu et al. (2014) identified a population of breast cancer stem cells characterized by high THY1 expression and EMT properties, indicating that the induction of both TWIST1 and SNAI2 in breast cell lines upregulated THY1 expression [76]. This result aligns with our findings, as the HGC-27 cell line, which exhibits high THY1 expression and significant TWIST1 and SNAI2 binding at its promoter, has also been reported to display cancer stem cell characteristics [22,77]. Similarly, Jiang et al. (2011) reported that cancer stem cells expressing THY1 can resist conventional treatments and reestablish the tumor hierarchy [25]. These findings address a key question in the context of gastric cancer: what activates THY1 expression in aggressive tumors, and what does this activation signify biologically? By identifying TWIST1 and SNAI2 as potential direct regulators of THY1 and linking them to the EMT transcriptional program, we provide a foundational step toward answering this question. These findings not only provide insights into the mechanisms that may govern THY1 expression but also support a potential connection between its role as a prognostic marker and its involvement in tumor progression and the EMT, paving the way for further research into its biological and clinical significance.
In another aspect of THY1 regulation in the context of gastric cancer, recent studies have also proposed complementary hypotheses involving distal regulatory elements. Notably, data from Razavi-Mohseni et al. (2024) showed a Mes-like enhancer located approximately 10 kb upstream of the THY1 promoter, marked by strong ATAC-seq signal in LMSU cells, one of the gastric cancer lines with high THY1 expression and mesenchymal characteristics [78]. This enhancer is part of a CTCF-defined chromatin loop that includes the THY1 promoter and has been shown to be bound by transcription factors such as JUN and RUNX2 in other cell types, suggesting a potential role for enhancer–promoter interactions in THY1 regulation [79]. While our study focused on proximal promoter and intronic regions to identify transcriptional regulators, these findings underscore the regulatory complexity of THY1 and the possibility that distal enhancers cooperate with promoter-bound TFs to drive its expression. Importantly, although our regulatory network was inferred from transcriptomic data in patient cohorts, not chromatin accessibility profile, some of the regulators highlighted in the enhancer study, such as TWIST1 and SNAI2, also emerged as key players in our analysis, suggesting convergence across regulatory layers. Furthermore, multiple regulatory mechanisms, potentially involving various transcription factors such as JUN and RUNX2, may act in combination to control THY1 expression, which aligns with its well-recognized context-dependent behavior. Our findings provide a transcriptional framework that can be further explored in the context of enhancer activity. This enhancer-based regulatory model presents a relevant complementary mechanism for the integration of transcriptomic and epigenomic data to fully elucidate the multilayered regulation of THY1 in gastric cancer.
While our study provides novel insights into the transcriptional regulation of THY1 in gastric cancer, several limitations should be acknowledged. Although the integration of bioinformatic predictions with experimental evidence strengthens the validity of our findings, the study is inherently limited by the in vitro nature of the experimental models. Gastric cancer is a highly heterogeneous disease, and the regulation of THY1 expression may vary depending on the tumor microenvironment or additional epigenetic factors not addressed in this study. Furthermore, while we showed that TWIST1 and SNAI2 are potential direct regulators of THY1, the precise dynamics of this interaction under different conditions, as well as potential coregulatory mechanisms, merit further exploration. Despite these limitations, our work represents a critical step toward deciphering the transcriptional complexity of THY1, particularly in the context of gastric cancer. This study is among the first to systematically delineate the regulatory network governing THY1 expression, identifying robust candidate regulators through rigorous bioinformatic and experimental analyses. By integrating a high-dimensional data analysis with experimental validation, we highlight the synergy between bioinformatics and benchwork in uncovering testable and biologically relevant mechanisms. Ultimately, our findings enhance the understanding of THY1 as a key player in the EMT and gastric cancer progression, providing a potential biological explanation for its association with a poor prognosis. Furthermore, this approach provides a framework for investigating the regulatory landscapes of other prognostic markers in cancer, paving the way for the development of targeted therapeutic strategies.
Conclusions
5
In this study, we systematically delineated the transcriptional regulatory landscape of THY1 in gastric cancer by identifying six robust putative regulators—PRRX1, TWIST1, SNAI2, MEIS3, VENTX, and EGR2—through an integrative multicohort approach. The functional enrichment analysis revealed that these regulators could orchestrate transcriptional programs associated with the epithelial–mesenchymal transition (EMT) and extracellular matrix (ECM) remodeling, supporting the hypothesis that THY1 is not only a marker but also potentially an integral component of the EMT transcriptional program. This study provides experimental evidence of TWIST1 and SNAI2 binding to the THY1 regulatory regions in a gastric cancer cell line with high THY1 expression, supporting the hypothesis that these transcription factors may act as key regulators of THY1 expression in this context. These findings suggest a mechanistic link between THY1 expression and EMT-driven transcriptional regulation, offering a biological explanation for the association of high THY1 expression with a poor prognosis for gastric cancer patients. Our work represents a crucial step in elucidating the transcriptional complexity of THY1 and underscores the power of integrating bioinformatic predictions with experimental validation to elucidate fundamental regulatory mechanisms in tumor biology.
CRediT authorship contribution statement
Paulo Rohan: Writing – review & editing, Writing – original draft, Visualization, Validation, Software, Methodology, Investigation, Formal analysis, Data curation, Conceptualization. Everton Cruz dos Santos: Writing – review & editing, Writing – original draft, Visualization, Validation, Methodology, Investigation, Formal analysis. Pedro Leite Azevedo: Writing – review & editing, Writing – original draft, Visualization, Validation, Methodology, Investigation, Formal analysis. Jessica Oliveira da Conceição: Writing – review & editing, Writing – original draft, Visualization, Validation, Methodology, Investigation, Formal analysis. Eliana Abdelhay: Writing – review & editing, Writing – original draft, Supervision, Resources, Project administration, Funding acquisition, Conceptualization. Renata Binato: Writing – review & editing, Writing – original draft, Supervision, Resources, Project administration, Funding acquisition, Conceptualization.
Ethical approval and consent to participate
Not applicable.
Consent for publication
Not applicable.
Data availability statement
The raw data can be obtained from online databases, including TCGA database (https://portal.gdc.cancer.gov/) under study abbreviation TCGA-STAD and the GEO database (http://www.ncbi.nlm.nih.gov/geo) using the following accession numbers: [GSE13861](GSE13861), [GSE15459](GSE15459), [GSE26899](GSE26899), [GSE26901](GSE26901), [GSE38749](GSE38749) and [GSE62254](GSE62254).
Funding
This work was supported by a grant from the 10.13039/501100004586Fundação de Amparo à Pesquisa do Estado do Rio de Janeiro (FAPERJ) [grant number SEI-260003/001147/2020].
Declaration of competing interest
The authors declare that they have no known competing financial interests or personal relationships that could have appeared to influence the work reported in this paper.
The reference list from the paper itself. Each links out to its DOI / PubMed record.
- 1Bray F.Laversanne M.Sung H.Ferlay J.Siegel R.L.Soerjomataram I.Global cancer statistics 2022: GLOBOCAN estimates of incidence and mortality worldwide for 36 cancers in 185 countries CA Cancer J. Clin.74320242292633857275110.3322/caac.21834 · doi ↗ · pubmed ↗
- 2Li Y.Feng A.Zheng S.Chen C.Lyu J.Recent estimates and predictions of 5-year survival in patients with gastric cancer: a model-based period analysis Cancer Control 2920221073274822109922710.1177/10732748221099227 PMC 906704135499497 · doi ↗ · pubmed ↗
- 3Necula L.Matei L.Dragu D.Neagu A.I.Mambet C.Nedeianu S.Recent advances in gastric cancer early diagnosis World J. Gastroenterol.2517 May 2019202920443111413110.3748/wjg.v 25.i 17.2029 PMC 6506585 · doi ↗ · pubmed ↗
- 4Gullo I.Carneiro F.Oliveira C.Almeida G.M.Heterogeneity in gastric cancer: from pure morphology to molecular classifications Pathobiology 851–2201850632861842010.1159/000473881 · doi ↗ · pubmed ↗
- 5Kumar R.K.Raj S.S.Shankar E.M.Ganapathy E.Ebrahim A.S.Farooq S.M.Gastric carcinoma: a review on epidemiology, current surgical and chemotherapeutic options [internet]Gastric Carcinoma - New Insights into Current Management 2013 Intech Open
- 6Lauren P.The two histological main types of gastric carcinoma: diffuse and SO-called intestinal-type carcinoma. AN attempt at a histo-clinical classification Acta Pathol. Microbiol. Scand.64196531491432067510.1111/apm.1965.64.1.31 · doi ↗ · pubmed ↗
- 7Bass A.J.Thorsson V.Shmulevich I.Reynolds S.M.Miller M.Bernard B.Comprehensive molecular characterization of gastric adenocarcinoma Nature 5137517 September 20142022092507931710.1038/nature 13480 PMC 4170219 · doi ↗ · pubmed ↗
- 8Binato R.Santos E.C.Boroni M.Demachki S.Assumpção P.Abdelhay E.A common molecular signature of intestinal-type gastric carcinoma indicates processes related to gastric carcinogenesis Oncotarget 97January 2018735973712948411610.18632/oncotarget.23670 PMC 5800908 · doi ↗ · pubmed ↗