Impact of clinically diagnosed liver cirrhosis in patients with intrahepatic cholangiocarcinoma treated with systemic chemotherapy: a subgroup analysis of JCOG1113
Mao Okada, Eiichiro Suzuki, Chigusa Morizane, Gakuto Ogawa, Yusuke Sano, Hiroshi Imaoka, Satoshi Kobayashi, Masafumi Ikeda, Naohiro Okano, Haruo Miwa, Akiko Todaka, Satoshi Shimizu, Nobumasa Mizuno, Sohei Satoi, Keiji Sano, Kazutoshi Tobimatsu, Akio Katanuma, Kenkichi Masutomi

TL;DR
This study found that liver cirrhosis does not significantly affect the safety or effectiveness of chemotherapy in patients with intrahepatic cholangiocarcinoma.
Contribution
The study provides new evidence on the safety and efficacy of chemotherapy in ICC patients with clinically diagnosed liver cirrhosis.
Findings
Median overall survival was 13.7 months in non-LC and 19.0 months in LC patients.
No significant differences in adverse events or progression-free survival were observed between the groups.
Chemotherapy appears safe and effective for ICC patients with clinically diagnosed liver cirrhosis.
Abstract
The JCOG1113, a multicenter, randomized phase III trial in patients with advanced/recurrent biliary tract cancer showed the non-inferiority of gemcitabine plus S-1 to gemcitabine plus cisplatin. Although liver cirrhosis (LC) is a known risk factor for intrahepatic cholangiocarcinoma (ICC), few reports focus on the efficacy and safety of chemotherapy in ICC patients with LC. We performed a subgroup analysis of ICC patients enrolled in the JCOG1113. The presence or absence of LC was evaluated based on clinical factors such as radiographic findings, medical history, laboratory data, and physical examination at enrollment. We evaluated differences in the safety and efficacy of chemotherapy according to the presence or absence of clinically diagnosed LC. Of the 94 eligible patients with ICC, 10 were clinically diagnosed with LC. In the non-LC/clinically diagnosed LC group, grade 3 or 4…
Genes, proteins, chemicals, diseases, species, mutations and cell lines named across the full text — each resolved to its canonical identifier and authoritative record.
Click any figure to enlarge with its caption.
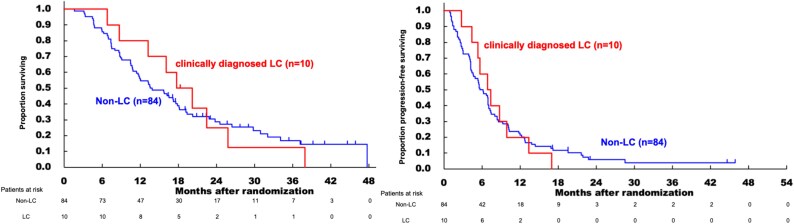 Figure 1
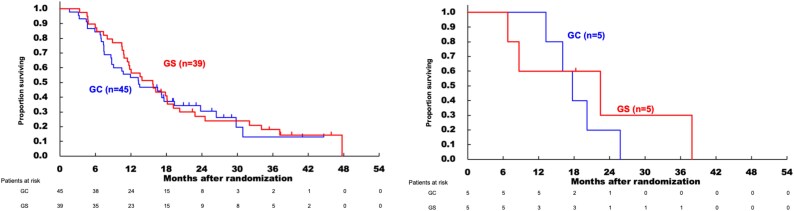 Figure 2
| CT findings characteristic of liver cirrhosis |
|
|---|---|
| Morphological change | 53 (56.4) |
| Parenchymal coarsening | 88 (93.6) |
| Blunt edge | 74 (78.7) |
| Irregular surface | 86 (91.5) |
| Varices, collaterals or splenomegaly | 81 (86.2) |
| Ascites | 75 (79.8) |
| Clinical diagnosis of liver cirrhosis | 84 (89.4) |
| Non-LC | Clinically diagnosed LC | Total | |||||
|---|---|---|---|---|---|---|---|
| GC | GS | Total | GC | GS | Total |
| |
|
|
|
|
|
|
| ||
| Age | |||||||
| Median | 67 | 66 | 67 | 66 | 68 | 67 | 67 |
| Range | 50–77 | 45–78 | 45–78 | 56–72 | 46–73 | 46–73 | 45–78 |
| Sex | |||||||
| Male (%) | 26 (57.8) | 22 (56.4) | 48 (57.1) | 5 (100.0) | 3 (60.0) | 8 (80.0) | 56 (59.6) |
| Female (%) | 19 (42.2) | 17 (43.6) | 36 (42.9) | 0 (0.0) | 2 (40.0) | 2 (20.0) | 38 (40.4) |
| PS | |||||||
| 0 | 32 (71.1) | 24 (61.5) | 56 (66.7) | 4 (80.0) | 5 (100.0) | 9 (90.0) | 65 (69.1) |
| 1 | 13 (28.9) | 15 (38.5) | 28 (33.3) | 1 (20.0) | 0 (0.0) | 1 (10.0) | 29 (30.9) |
| Biliary drainage | |||||||
| No (%) | 32 (71.1) | 29 (74.4) | 61 (72.6) | 4 (80.0) | 5 (100.0) | 9 (90.0) | 70 (74.5) |
| Yes (%) | 13 (28.9) | 10 (25.6) | 23 (27.4) | 1 (20.0) | 0 (0.0) | 1 (10.0) | 24 (25.5) |
| Reason of unresectable | |||||||
| Locally advanced (%) | 10 (22.2) | 8 (20.5) | 18 (21.4) | 1 (20.0) | 0 (0.0) | 1 (10.0) | 19 (20.2) |
| Metastasis (%) | 27 (60.0) | 26 (66.7) | 53 (63.1) | 3 (60.0) | 5 (100.0) | 8 (80.0) | 61 (64.9) |
| Recurrence (%) | 8 (17.8) | 5 (12.8) | 13 (15.5) | 1 (20.0) | 0 (0.0) | 1 (10.0) | 14 (14.9) |
| HBs antigen | |||||||
| Negative (%) | 43 (95.6) | 39 (100.0) | 82 (97.6) | 5 (100.0) | 5 (100.0) | 10 (100.0) | 92 (97.9) |
| Positive (%) | 2 (4.4) | 0 (0.0) | 2 (2.4) | 0 (0.0) | 0 (0.0) | 0 (0.0) | 2 (2.1) |
| HCV antibody | |||||||
| Negative (%) | 42 (93.3) | 38 (97.4) | 80 (95.2) | 5 (100.0) | 5 (100.0) | 10 (100.0) | 90 (95.7) |
| Positive (%) | 2 (4.4) | 1 (2.6) | 3 (3.6) | 0 (0.0) | 0 (0.0) | 0 (0.0) | 3 (3.2) |
| Not evaluated (%) | 1 (2.2) | 0 (0.0) | 1 (1.2) | 0 (0.0) | 0 (0.0) | 0 (0.0) | 1 (1.1) |
| Heavy alcohol consumption | |||||||
| No (%) | 39 (86.7) | 35 (89.7) | 74 (88.1) | 3 (60.0) | 5 (100.0) | 8 (80.0) | 82 (87.2) |
| Yes (%) | 6 (13.3) | 4 (10.3) | 10 (11.9) | 2 (40.0) | 0 (0.0) | 2 (20.0) | 12 (12.8) |
| Child–Pugh score (%) | |||||||
| 5 | 15 (33.3) | 19 (48.7) | 34 (40.5) | 3 (60.0) | 2 (40.0) | 5 (50.0) | 39 (41.5) |
| 6 | 15 (33.3) | 11 (28.2) | 26 (31.0) | 0 (0.0) | 2 (40.0) | 2 (20.0) | 28 (29.8) |
| 7 | 4 (8.9) | 3 (7.7) | 7 (8.3) | 1 (20.0) | 0 (0.0) | 1 (10.0) | 8 (8.5) |
| 8 | 4 (8.9) | 1 (2.6) | 5 (6.0) | 0 (0.0) | 0 (0.0) | 0 (0.0) | 5 (5.3) |
| 9 | 2 (4.4) | 1 (2.6) | 3 (3.6) | 0 (0.0) | 0 (0.0) | 0 (0.0) | 3 (3.2) |
| 10 | 0 (0.0) | 1 (2.6) | 1 (1.2) | 1 (20.0) | 0 (0.0) | 1 (10.0) | 2 (2.1) |
| Not evaluated | 5 (11.1) | 3 (7.7) | 8 (9.5) | 0 (0.0) | 1 (20.0) | 1 (10.0) | 9 (9.6) |
| White blood cell count (103/μl) | |||||||
| Median (Range) | 6300 | 6800 | 6495 | 6200 | 6100 | 6150 | 6250 |
| Neutrophil count (103/μl) |
| ||||||
| Median (Range) | 4510 (2430–14 407) | 4449 (1770–14 328) | 4479.5 (1770–14 407) | 4150 (3320–4520) | 3772 (3206–5140) | 4070 (3206–5140) | 4417.5 (3900–18 000) |
| Hemoglobin (g/dl) | |||||||
| Median (Range) | 12.3 | 12.7 | 12.5 | 12.0 | 12.6 | 12.3 | 12.5 |
| Platelet count (104/μl) | |||||||
| Median (Range) | 21.7 | 20.9 | 21.2 | 19.1 | 17.4 | 18.3 | 21.0 |
| Creatinine (mg/dl) | |||||||
| Median (Range) | 0.68 | 0.66 | 0.68 | 0.77 | 0.80 | 0.78 | 0.68 |
| Total bilirubin (mg/dl) |
| ||||||
| Median (Range) | 0.70 | 0.70 | 0.70 | 0.70 | 0.80 | 0.75 | 0.7 |
| Prothrombin time (%) |
|
|
|
|
|
|
|
| Median (Range) | 87.5 | 90.5 | 89.0 | 84 | 98.5 | 88.0 | 89 |
| Non-LC | Clinically diagnosed LC | Total | |||||
|---|---|---|---|---|---|---|---|
| GC | GS | Total | GC | GS | Total |
| |
|
|
|
|
|
|
| ||
| Percent planned dose administered of gemcitabine (%) |
| ||||||
| Median (Range) | 81.3 | 87.5 | 83.3 | 75.0 | 82.5 | 78.8 | 83.3 |
| Percent planned dose administered of S-1 (%) |
|
|
| ||||
| Median (Range) | — | 88.5 | 88.5 | — | 75.0 | 75.0 | 87.4 |
| Percent planned dose administered of cisplatin (%) |
|
|
|
| |||
| Median (Range) | 83.3 | — | 83.3 | 65.0 | — | 65.0 | 83.3 |
| Number of courses administered | |||||||
| ≤8 courses | 26 | 18 | 44 | 1 | 2 | 3 | 47 |
| 9 courses ≤ | 19 | 21 | 40 | 4 | 3 | 7 | 47 |
| Reason for discontinuation of treatment | |||||||
| Continued | 2 | 2 | 0 | 0 | 0 | 2 | |
| Disease progression | 34 | 32 | 66 | 5 | 5 | 10 | 76 |
| Adverse event | 7 | 3 | 10 | 0 | 0 | 0 | 10 |
| Patient refusal related to adverse events | 3 | 1 | 4 | 0 | 0 | 0 | 4 |
| Patient refusal not related to adverse events | 1 | 0 | 1 | 0 | 0 | 0 | 1 |
| others | 0 | 1 | 1 | 0 | 0 | 0 | 1 |
| Non-LC | Clinically diagnosed LC | |||||||||||
|---|---|---|---|---|---|---|---|---|---|---|---|---|
| GC | GS | Total | GC | GS | Total | |||||||
| Grade | Grade | Grade | Grade | Grade | Grade | Grade | Grade | Grade | Grade | Grade | Grade | |
| White blood cell decreased | 34 (75.6) | 14 (31.1) | 29 (74.4) | 6 (15.4) | 63 (75) | 20 (23.8) | 5 (100) | 1 (20) | 5 (100) | 1 (20) | 10 (100) | 2 (20) |
| Anemia | 44 (97.8) | 11 (24.4) | 38 (97.4) | 2 (5.1) | 82 (97.6) | 13 (15.5) | 5 (100) | 0 (0) | 5 (100) | 0 (0) | 10 (100) | 0 (0) |
| Thrombocytopenia | 38 (84.4) | 8 (17.8) | 31 (79.5) | 2 (5.1) | 69 (82.1) | 10 (11.9) | 5 (100) | 2 (40) | 4 (80) | 2 (40) | 9 (90) | 4 (40) |
| Neutropenia | 37 (82.2) | 25 (55.6) | 32 (82.1) | 18 (46.2) | 69 (82.1) | 43 (51.2) | 5 (100) | 3 (60) | 5 (100) | 3 (60) | 100 (100) | 6 (60) |
| Hyperbilirubinemia | 12 (26.7) | 2 (4.4) | 14 (35.9) | 3 (7.7) | 26 (31) | 5 (6) | 1 (20) | 0 (0) | 2 (40) | 0 (0) | 3 (30) | 0 (0) |
| Elevated ALP | 40 (88.9) | 7 (15.6) | 31 (79.5) | 2 (5.1) | 71 (84.5) | 9 (10.7) | 4 (80) | 0 (0) | 4 (80) | 0 (0) | 8 (80) | 0 (0) |
| Elevated AST | 38 (84.4) | 6 (13.3) | 35 (89.7) | 0 (0) | 73 (86.9) | 6 (7.1) | 2 (40) | 0 (0) | 4 (80) | 1 (20) | 6 (60) | 1 (20) |
| Elevated ALT | 34 (75.6) | 3 (6.7) | 30 (76.9) | 3 (7.7) | 64 (76.2) | 6 (7.1) | 2 (40) | 0 (0) | 5 (100) | 1 (20) | 7 (70) | 1 (20) |
| Increased creatinine | 14 (31.1) | 1 (2.2) | 5 (12.8) | 0 (0) | 19 (22.6) | 1 (1.2) | 2 (40) | 0 (0) | 2 (40) | 0 (0) | 4 (40) | 0 (0) |
| Febrile neutropenia | 1 (2.2) | 1 (2.2) | 0 (0) | 0 (0) | 1 (1.2) | 1 (1.2) | 0 (0) | 0 (0) | 0 (0) | 0 (0) | 0 (0) | 0 (0) |
| Diarrhea | 10 (22.2) | 1 (2.2) | 10 (25.6) | 1 (2.6) | 20 (23.8) | 2 (2.4) | 0 (0) | 0 (0) | 0 (0) | 0 (0) | 0 (0) | 0 (0) |
| Mucositis | 6 (13.3) | 0 (0) | 14 (35.9) | 0 (0) | 20 (23.8) | 0 (0) | 0 (0) | 0 (0) | 1 (20) | 0 (0) | 1 (10) | 0 (0) |
| Rash | 7 (15.6) | 0 (0) | 10 (25.6) | 3 (7.7) | 17 (20.2) | 3 (3.6) | 1 (20) | 0 (0) | 2 (40) | 1 (20) | 3 (30) | 1 (10) |
| Biliary tract infection | 6 (13.3) | 6 (13.3) | 3 (7.7) | 3 (7.7) | 9 (10.7) | 9 (10.7) | 0 (0) | 0 (0) | 1 (20) | 1 (20) | 1 (10) | 1 (10) |
| Fatigue | 22 (48.9) | 22 (48.9) | 13 (33.3) | 0 (0) | 35 (41.7) | 0 (0) | 2 (40) | 0 (0) | 2 (40) | 0 (0) | 4 (40) | 0 (0) |
| Fever | 12 (26.7) | 0 (0) | 9 (23.1) | 1 (2.6) | 21 (25) | 1 (1.2) | 0 (0) | 0 (0) | 2 (40) | 0 (0) | 2 (20) | 0 (0) |
| Alopecia | 5 (11.1) | − − | 5 (12.8) | − − | 10 (11.9) | − − | 2 (40) | − − | 0 (0) | − − | 2 (20) | − − |
| Skin hyperpigmentation | 0 (0) | − − | 7 (17.9) | − − | 7 (8.3) | − − | 0 (0) | − − | 1 (20) | − − | 1 (10) | − − |
| Nausea | 19 (42.2) | 1 (2.2) | 11 (28.2) | 0 (0) | 30 (35.7) | 1 (1.2) | 0 (0) | 0 (0) | 0 (0) | 0 (0) | 0 (0) | 0 (0) |
| Vomiting | 4 (8.9) | 1 (2.2) | 3 (7.9) | 0 (0) | 7 (8.3) | 1 (1.2) | 1 (20) | 0 (0) | 0 (0) | 0 (0) | 1 (10) | 0 (0) |
| Appetite loss | 18 (40) | 3 (6.7) | 13 (33.3) | 3 (7.7) | 31 (36.9) | 6 (7.1) | 0 (0) | 0 (0) | 1 (20) | 1 (20) | 1 (10) | 1 (10) |
| Dysgeusia | 2 (2.2) | − − | 6 (15.4) | − − | 8 (9.5) | − − | 0 (0) | − − | 1 (20) | − − | 1 (10) | − − |
| Peripheral motor neuropathy | 0 (0) | 0 (0) | 1 (2.6) | 0 (0) | 1 (1.2) | 0 (0) | 0 (0) | 0 (0) | 0 (0) | 0 (0) | 0 (0) | 0 (0) |
| Non-LC | Clinically diagnosed LC | |||||
|---|---|---|---|---|---|---|
| GC | GS | Total | GC | GS | Total | |
| All grades | 45 | 39 | 84 | 5 | 5 | 10 |
| ≥ Grade 2 | 36 | 24 | 60 | 2 | 4 | 6 |
| ≥ Grade 3 | 18 | 14 | 32 | 0 | 3 | 3 |
| ≥ Grade 4 | 1 | 0 | 1 | 0 | 0 | 0 |
| Neutropenia | Febrile neutropenia | |||
|---|---|---|---|---|
| ≥Grade 3 | Grade 4 | ≥Grade 3 | Grade 4 | |
| Morphological change | ||||
| No | 40/81 (49.4%) | 8/81 (9.9%) | 1/81 (1.2%) | 1/81 (1.2%) |
| Yes | 9/13 (69.2%) | 3/13 (23.1%) | 0/13 (0.0%) | 0/13 (0.0%) |
| Parenchymal abnormalities | ||||
| No | 46/88 (52.3%) | 10/88 (11.4%) | 1/88 (1.1%) | 1/88 (1.1%) |
| Yes | 3/6 (50.0%) | 1/6 (16.7%) | 0/6 (0.0%) | 0/6 (0.0%) |
| Blunt edge | ||||
| No | 39/74 (52.7%) | 7/74 (9.5%) | 0/74 (0.0%) | 0/74 (0.0%) |
| Yes | 10/20 (50.0%) | 4/20 (20.0%) | 1/20 (5.0%) | 1/20 (5.0%) |
| Irregular surface | ||||
| No | 45/86 (52.3%) | 10/86 (11.6%) | 1/86 (1.2%) | 1/86 (1.2%) |
| Yes | 4/8 (50.0%) | 1/8 (12.5%) | 0/8 (0.0%) | 0/8 (0.0%) |
| Varices, collaterals or splenomegaly | ||||
| No | 42/81 (51.9%) | 10/81 (12.3%) | 0/81 (0.0%) | 0/81 (0.0%) |
| Yes | 7/13 (53.8%) | 1/13 (7.7%) | 1/13 (7.7%) | 1/13 (7.7%) |
| Ascites | ||||
| No | 41/75 (54.7%) | 11/75 (14.7%) | 1/75 (1.3%) | 1/75 (1.3%) |
| Yes | 8/19 (42.1%) | 0/19 (0.0%) | 0/19 (0.0%) | 0/19 (0.0%) |
| Total number of variables | ||||
| 0 | 29/51 (56.9%) | 7/51 (13.7%) | 0/51 (0.0%) | 0/51 (0.0%) |
| 1 | 9/21 (42.9%) | 0/21 (0.0%) | 0/21 (0.0%) | 0/21 (0.0%) |
| 2 or 3 | 7/18 (38.9%) | 3/18 (16.7%) | 1/18 (5.6%) | 1/18 (5.6%) |
| 4 or 5 | 4/4 (100.0%) | 1/4 (25.0%) | 0/4 (0.0%) | 0/4 (0.0%) |
| All | 0/0 | 0/0 | 0/0 | 0/0 |
| Non-LC | Clinically diagnosed LC | |
|---|---|---|
| GC (%) | 11/43 (25.6) | 2/5 (40) |
| GS (%) | 13/37 (35.1) | 0/5 (0.0) |
| Total (%) | 24/80 (30.0) | 2/10 (20.0) |
- —National Cancer Center Research and Development Funds
- —Japan Agency for Medical Research and Development10.13039/100009619
- —Clinical Cancer Research
- —Ministry of Health, Labour, and Welfare of Japan
Peer Reviews
No public reviews on file for this paper yet. If you reviewed it on a platform where reviews are public (OpenReview, ICLR, NeurIPS, ICML), you can paste yours below so the community can read it here.
Videos
No videos yet. Explain this paper in a talk, walkthrough, or lecture? Add one.
Taxonomy
TopicsCholangiocarcinoma and Gallbladder Cancer Studies · Gallbladder and Bile Duct Disorders · Hepatocellular Carcinoma Treatment and Prognosis
Introduction
Biliary tract cancer (BTC) is one of the cancers with a poor prognosis and is often diagnosed at an advanced stage. Intrahepatic cholangiocarcinoma (ICC) is classified as a primary liver cancer according to the Union for International Cancer Control (UICC) classification, but systemic chemotherapy for advanced or recurrent cases is administered according to BTC. The majority of primary liver cancers are hepatocellular carcinoma (HCC) (75%–85%), and ICC has been reported to be 10%–15% [1]. Risk factors for ICC are reported to include hepatitis B (HBV) [2] and hepatitis C (HCV) [2,3], liver cirrhosis (LC) from any cause, primary sclerosing cholangitis, liver flukes, metabolic syndrome, and alcohol intake [2–9]. According to a follow-up survey report by the Liver Cancer Study Group in Japan [10], 5.8% of the patients with ICC were positive for the HBs antigen, and 12.8% were positive for the HCV virus antibody.
Gemcitabine plus cisplatin (GC) is one of the standard international treatment regimens for advanced or recurrent BTC [11]. JCOG1113, a randomized phase III trial conducted by the Japan Clinical Oncology Group (JCOG) Hepatobiliary and Pancreatic Oncology Study Group in Japan, confirmed that gemcitabine plus S-1 (GS) is non-inferior to GC as first-line chemotherapy for unresectable or recurrent BTC including ICC, extrahepatic cholangiocarcinoma, gallbladder cancer, and ampulla of Vater. JCOG1113 enrolled 354 patients from May 2013 to March 2016 and showed that GS was non-inferior to GC in overall survival (OS) (median OS, GC 13.4 months, GS 15.1 months; hazard ratio [HR] 0.945; 90% confidence interval [CI] 0.78**–**1.15; P = .046 for non-inferiority) and was well tolerated [12]. The results of the JCOG1113 have made GS a treatment option for chemotherapy in unresectable or recurrent BTC.
Some anticancer drugs used in BTC, such as gemcitabine and S-1, are metabolized in the liver. With regard to the application of these anticancer drugs in patients with LC, adverse events (AEs) might increase due to impaired drug metabolism from hepatic dysfunction [13–15]. In addition, there are concerns regarding the severity of myelosuppression due to pancytopenia induced by LC [16], and anticancer drugs can cause liver damage [17]. Several previous reports have considered whether the dosage of anticancer drugs should be reduced in patients with liver dysfunction [18–20]. However, few clinical reports have elucidated such concerns or evaluated the safety and efficacy of systemic chemotherapy in patients with ICC having LC. Thus, it is important to assess the effect of LC on chemotherapy safety in patients with ICC.
In the present study, we analyzed the safety and efficacy of systemic chemotherapy in patients with ICC enrolled in JCOG1113 [12] by the presence or absence of clinically diagnosed LC.
Patients and methods
Study setting of JCOG1113
The main eligibility criteria of JCOG1113 were as follows: histologically proven BTC, unresectable or recurrent disease, age 20–79 years, Eastern Cooperative Oncology Group performance status score 0 or 1, ability to take oral intake, no prior therapy for BTC except for surgery or biliary drainage, no prior chemotherapy or radiation therapy, and adequate function of major organs such as platelet count >100 × 10 [9]/l, aspartate aminotransferase and alanine aminotransferase concentration ≤ 100 U/L (150 U/l in biliary drainage cases), and total bilirubin ≤2.0 mg/dl (3.0 mg/dl in biliary drainage cases) [12]. The GC arm received gemcitabine (1000 mg/m^2^) and cisplatin (25 mg/m^2^) on days 1 and 8, which was repeated every 3 weeks. Cisplatin was administered up to 16 times (400 mg/m^2^) unless the patient met the termination criteria. In the GS arm, gemcitabine (1000 mg/m^2^) was administered on days 1 and 8, and S-1 was administered orally twice daily [60 mg/day for body surface area (BSA) < 1.25 m^2^, 80 mg/day for BSA 1.25–1.50 m^2^, and 100 mg/day for BSA ≥ 1.50 m^2^] on days 1–14 and repeated every 3 weeks. In both arms, the protocol treatment was continued until disease progression, unacceptable toxicity, or patient refusal was observed [14]. Written informed consent was obtained at the time of registration for the JCOG1113. The study protocol was approved by the institutional review board of each participating institution.
The subgroup analyses complied with the ethical standards of the World Medical Association (Declaration of Helsinki). The JCOG1113 was registered at UMIN Clinical Trials Registry, number UMIN000010667.
Design of this subgroup analysis
This was a subgroup analysis of the JCOG1113. We used the clinical information and laboratory data at the time of enrollment in the JCOG1113.
Although a definitive diagnosis of LC requires a pathological diagnosis, the JCOG1113 did not obtain pathological information on non-tumor liver tissues. Therefore, LC-related clinical factors were obtained based on radiological findings, clinical history, laboratory data, and physical findings at the time of enrollment. Radiological findings were evaluated based on factors [21,22] such as morphological changes (atrophy or enlargement considered characteristic of LC) in the liver, except for changes caused by the tumor, coarsening of the liver parenchyma, blunting of the liver edge, irregular surface of the liver, and development of hepatic collateral blood vessels, splenomegaly, varices, or ascites. The diagnosis of LC by imaging was made by individual local physicians. Since a diagnostic radiology central review was not conducted in JCOG1113, the present subgroup analysis also did not include a diagnostic radiology central review of LC, as it relied on clinical information collected in the primary study. Based on these data, the physician comprehensively determined whether each patient had clinically diagnosed LC and noted it in the case report forms.
The Child–Pugh score was originally developed to assess the prognosis of patients with LC and portal hypertension undergoing surgery for variceal bleeding [23,24]. It is widely used to assess the liver function in patients with LC. The score was not intended to evaluate liver function in non-LC patients or distinguish between LC and non-LC patients; however, in this study, the Child–Pugh score was also assessed in non-LC patients for the purpose of simplified and consistent evaluation of liver function as a reference data.
Endpoints and statistical analysis
This study evaluated the percentage of planned doses and number of courses administered, AEs, and efficacy. AEs were reported according to the Common Terminology Criteria for Adverse Events (CTCAE) version 4.0 in the JCOG1113. Regarding the evaluation of efficacy, OS was defined as the time from the date of study enrollment to the date of death from any cause or the last follow-up date. Progression-free survival (PFS) was defined as the time from the date of study enrollment to the date of documented disease progression or death. The response rate (RR) was analyzed in patients with measurable lesions. It was defined as the percentage of patients with a complete or partial response according to the Response Evaluation Criteria in Solid Tumors version 1.1.
OS and PFS were estimated using the Kaplan–Meier method. HRs and corresponding 95% CIs were estimated using the Cox regression hazard model. Statistical analyses were performed using SAS software version 9.4. All statistical analyses were performed at the JCOG Data Center.
Results
Patients
Ninety-four patients with ICC were enrolled in the JCOG1113, and all were included in this analysis. Of the 94 patients, 84 were classified as non-LC, and 10 were clinically diagnosed with LC (Table 1). Patient backgrounds are shown in Table 2. The proportion of patients with a history of heavy alcohol consumption (average daily intake of ≥60 g of pure ethanol) was higher in the clinically diagnosed LC group than in those without (20.0% vs. 11.9%). Regarding the hepatitis virus, no patients were positive for HBV (HBs antigen or HBV DNA) or HCV antibody in the clinically diagnosed LC group, whereas 2.4% were HBV-positive, and 3.6% were HCV antibody-positive in the non-LC group. The number of patients with Child–Pugh score ≥8 was 9 (10.7%) in non-LC group and 1 (10.0%) in the clinically diagnosed LC group. The number of patients with a history of biliary drainage was 23 (27.4%) in the non-LC group and one (10.0%) in the clinically diagnosed LC group. The proportions of patients treated with GC/GS were well balanced (53.6% and 46.4% in the non-LC group and 50% and 50% in the clinically diagnosed LC group, respectively).
In baseline blood test, white blood cell count, neutrophil count, hemoglobin, creatinine, and prothrombin time were similar between the clinically diagnosed LC and non-LC group, while platelet count was slightly lower in the clinically diagnosed LC group.
Safety
Table 3 shows the percentage of planned dose administered and the number of courses administered. Percent planned dose administered was slightly lower in the non-LC group, but there were no cases of treatment discontinuation due to AEs in the non-LC group.
The AE profiles in the non-LC and clinically diagnosed LC groups are shown in Table 4. In terms of grade 3 or higher hematological toxicity, the incidence in the non-LC and clinically diagnosed LC groups was as follows: white blood cell decreased (23.8%/20.0%), anemia (15.5%/0%), thrombocytopenia (11.9%/40.0%), and neutropenia (51.2%/60.0%). In the non-LC group, hematological AEs of grade 3 or higher were more frequent in the GC arm (n = 45) than in the GS arm (n = 39); white blood cell decreased by 31.1%/15.4%; anemia by 24.4%/5.1%; thrombocytopenia by 17.8%/5.1%; and neutropenia by 55.6%/46.2%. In contrast, in the clinically diagnosed LC group, hematological AEs of grade 3 or higher were comparably observed in the GC (n = 5) and GS (n = 5) arms: white blood cell decreased by 20%/20%; anemia by 0%/0%; thrombocytopenia by 40%/40%; and neutropenia by 60%/60%. One patient in the non-LC group experienced febrile neutropenia after day 15 of the seventh course of GC therapy, died on day 19 (9 days after the final administration), and was judged to have a treatment-related death.
The frequency of non-hematological AEs according to the treatment regimen is shown in Table 5. The frequency of non-hematological AEs of grade 3 or higher was 38.1% (32/84) in the non-LC group and 30% (3/10) in the clinically diagnosed LC group and non-hematological AEs of grade 3 or higher were most frequent in patients treated with GS in the clinically diagnosed LC group (3/5, 60%). Ten patients in the non-LC group discontinued treatment due to AE, but none in the LC group.
In this study, two patients were categorized as having a Child–Pugh score of 10, but they did not have any AE of grade 3 or higher.
Table 6 shows the frequency of neutropenia and febrile neutropenia according to the presence or absence of CT findings of characteristics of clinically diagnosed LC. Patients with morphological changes in the liver had a higher frequency of grade 3 or higher neutropenia than those without such changes. The frequency of AEs was not necessarily higher in patients with other findings related to clinically diagnosed LC nor did the frequency increase with the number of findings.
Efficacy
Prognosis of clinically diagnosed LC compared with non-LC
Kaplan–Meier curves for OS and PFS comparing the non-LC and clinically diagnosed LC groups are shown in Fig. 1. The median OS was 13.7 months in the non-LC group and 19.0 months in the clinically diagnosed LC group (HR, 0.969; 95% CI, 0.482**–**1.948). The median PFS was 5.9 months in the non-LC group and 7.1 months in the clinically diagnosed LC group (HR, 0.995; 95% CI, 0.513–1.929). In this study population, there was no significant difference in the prognosis based on the presence or absence of clinically diagnosed LC.
Comparing treatment effects of GC and GS therapy according to existence of clinically diagnosed LC
In the non-LC group, 42% (19/45) of patients in the GC arm and 54% (21/39) of patients in the GS arm continued treatment for nine or more cycles, compared to 80% (4/5) and 60% (3/5) in the clinically diagnosed LC group, respectively. Thus, there was no lower rate of continuation of nine or more cycles in the clinically diagnosed LC group.
Table 7 shows the RRs for GC and GS therapies in the non-LC and clinically diagnosed LC groups. There was no consistent trend in the response to GC or GS depending on the presence or absence of clinically diagnosed LC. In both arms, the RR was 30% (24/80) in the non-LC group and 20% (2/10) in the clinically diagnosed LC group.
Figure 2 show the OS comparison between patients with GC and GS in the non-LC and clinically diagnosed LC groups. There was no significant difference between the GC and GS arms in terms of OS.
Discussion
This study showed that clinically diagnosed LC was not a definite risk factor for safety in patients who enrolled in JCOG1113. Although the non-LC group had a slightly lower percentage of the planned dose administered than the clinically diagnosed LC group, there were no cases of treatment discontinuation due to AEs. Therefore, it might be possible to manage AEs and continue treatment with dose modification. Grade 3 or higher AEs were not necessarily more common in the clinically diagnosed LC group than in the non-LC group. Grade 3 or higher thrombocytopenia and neutropenia occurred more frequently in the clinically diagnosed LC group than in the non-LC group, whereas other hematological AEs of grade 3 or higher occurred more frequently in the non-LC group than in the clinically diagnosed LC group. Non-hematological AEs were not more frequent in the clinically diagnosed LC group than in the non-LC group. In terms of efficacy, the presence of clinically diagnosed LC did not necessarily compromise the chemotherapy RR. Additionally, there were no necessarily inferior outcomes in terms of OS and PFS in the clinically diagnosed LC group compared with the non-LC group.
In our study, the Child-Pugh score was not associated with the severity of LC. This is because LC severity could not be assessed simply using the Child–Pugh score in this population. Components of the Child–Pugh score, such as ascites, elevated total bilirubin levels, and decreased albumin levels, could be caused by the cancer itself. However, it is difficult to determine whether the etiology of these events was cancer or LC. It is also possible that the total bilirubin level is elevated because of biliary obstruction or cholangitis in patients with ICC. Indeed, patients after biliary drainage could be enrolled as long as their total bilirubin level ≤3.0 mg/dl in JCOG1113. The Child–Pugh score of patients in the clinically diagnosed LC group was not necessarily higher than that in the non-LC group (Table 2). Additionally, two patients categorized as Child–Pugh C (score of 10), which is usually a contraindication for systemic therapy in HCC, did not have any AE of grade 3 or higher in this study. These facts support the theoretical issues mentioned earlier, and we believe that the Child–Pugh scores of the subjects of this study should not be relied upon. Clinical findings including radiological imaging may be more appropriate for evaluation of LC in patients with advanced ICC.
Comparison of overall survival and progression-free survival in clinically diagnosed liver cirrhosis and non- liver cirrhosis groups.
Overall survival comparison of gemcitabine plus cisplatin (GC) and gemcitabine plus S-1 (GS) in non-liver cirrhosis group and clinically diagnosed liver cirrhosis group.
The reason why this study did not find a clear difference between clinically diagnosed LC and non-LC may be related to the limitations of this study. The number of patients diagnosed with the clinically diagnosed LC in this study was small. In addition, the diagnosis of LC may have been somewhat subjective because it was clinically diagnosed by physicians based on radiological findings, clinical history, laboratory data, and physical findings without histological diagnosis. Other points that should be interpreted with caution in this study is that patients classified as clinically diagnosed with LC still had sufficient organ function to meet the enrollment criteria for a clinical trial. Patients with platelets <100 × 109/l, bilirubin >3 mg/dl, moderate or severe ascites, or psychiatric symptoms including hepatic encephalopathy were excluded. These findings may not reflect the actual clinical conditions of the entire population of patients with LC. These may have influenced the lack of a clear difference between the clinically diagnosed LC and non- LC groups in this study.
Another limitation is the breakdown of etiology. In the clinically diagnosed LC group, all patients tested negative for both HBV and HCV, and 20% had a history of heavy alcohol consumption. A certain number of the remaining patients with LC may have nonalcoholic steatohepatitis. However, we do not have enough information to diagnose nonalcoholic steatohepatitis; therefore, the specific percentage is unknown. However, this breakdown is not typical of the etiology of LC in Japan. This may be due to the small sample size. Alternatively, morphological changes in the liver caused by cancer, such as portal vein stenosis, could have contributed to the unusual breakdown of etiology.
We conclude that chemotherapy may be indicated in patients with advanced ICC and good systemic condition (eligible for clinical trials) even if LC is clinically suspected. The appropriateness of chemotherapy in patients in daily practice with LC levels that would disqualify them from clinical trials (platelets <100 × 10^9^/l, bilirubin >3 mg/dl, moderate or severe ascites, or psychiatric symptoms, including hepatic encephalopathy) remains a clinical question to be resolved in the future.
The reference list from the paper itself. Each links out to its DOI / PubMed record.
- 1Sung H, Ferlay J, Siegel RL. et al. Global cancer statistics 2020: GLOBOCAN estimates of incidence and mortality worldwide for 36 cancers in 185 countries. CA Cancer J Clin 2021;71:209–49. 10.3322/caac.21660.33538338 · doi ↗ · pubmed ↗
- 2Palmer WC, Patel T. Are common factors involved in the pathogenesis of primary liver cancers? A meta-analysis of risk factors for intrahepatic cholangiocarcinoma. J Hepatol 2012;57:69–76. 10.1016/j.jhep.2012.02.022.22420979 PMC 3804834 · doi ↗ · pubmed ↗
- 3Shaib YH, el-Serag HB, Davila JA, Morgan R, Mc Glynn KA. Risk factors of intrahepatic cholangiocarcinoma in the United States: a case-control study. Gastroenterology 2005;128:620–6. 10.1053/j.gastro.2004.12.048.15765398 · doi ↗ · pubmed ↗
- 4Welzel TM, Graubard BI, el–Serag HB. et al. Risk factors for intrahepatic and extrahepatic cholangiocarcinoma in the United States: a population-based case-control study. Clin Gastroenterol Hepatol 2007;5:1221–8. 10.1016/j.cgh.2007.05.020.17689296 PMC 2083573 · doi ↗ · pubmed ↗
- 5Pinter M, Trauner M, Peck-Radosavljevic M, Sieghart W. Cancer and liver cirrhosis: implications on prognosis and management. ESMO Open 2016;1:e 000042. 10.1136/esmoopen-2016-000042.27843598 PMC 5070280 · doi ↗ · pubmed ↗
- 6Clements O, Eliahoo J, Kim JU, Taylor-Robinson SD, Khan SA. Risk factors for intrahepatic and extrahepatic cholangiocarcinoma: a systematic review and meta-analysis. J Hepatol 2020;72:95–103. 10.1016/j.jhep.2019.09.007.31536748 · doi ↗ · pubmed ↗
- 7Kam AE, Masood A, Shroff RT. Current and emerging therapies for advanced biliary tract cancers. Lancet Gastroenterol Hepatol 2021;6:956–69. 10.1016/S 2468-1253(21)00171-0.34626563 · doi ↗ · pubmed ↗
- 8Banales JM, Marin JJG, Lamarca A. et al. Cholangiocarcinoma 2020: The next horizon in mechanisms and management. Nat Rev Gastroenterol Hepatol 2020;17:557–88. 10.1038/s 41575-020-0310-z.32606456 PMC 7447603 · doi ↗ · pubmed ↗