Demographic and mental health characteristics of individuals in the NSW Housing and Accommodation Support Initiative (HASI), Community Living Supports and HASI Plus
Gary KK Low, Jason Li, Emily Hielscher, Veronica Sheanoda, Sumathi Govindasamy, Fadzi Marasha

TL;DR
This study examines how demographic factors relate to mental health recovery in a long-term housing support program in New South Wales.
Contribution
The study identifies specific demographic factors linked to mental health recovery outcomes in a 19-year housing support initiative.
Findings
Unmet mental health needs decreased significantly over time in the HASI program.
First Nations and LGBTI participants showed distinct patterns in mental health recovery outcomes.
Demographic factors like age, sex, and country of birth influenced recovery measures.
Abstract
To investigate the demographic characteristics associated with mental health recovery measures among individuals accessing the Housing and Accommodation Support Initiative (HASI) program over a 19-year period. This was a retrospective cohort study conducted from January 2004 to October 2023. The Camberwell Assessment of Need Short Appraisal Schedule (CANSAS) and Recovery Assessment Scale (RAS) were used as measures of mental health recovery. A total of 2350 people with an average age of 42 years old were included. Female accounts for 46.0% of the total. The proportion of unmet needs in the CANSAS reduced from a median of 33.3% of the first follow-up to 5.8% in the 20th follow-up. The average RAS scores were above three, indicating agree and strongly agree in all domains and improved in each follow-up. First Nations were associated with higher unmet needs in ‘psychotic symptoms’,…
Genes, proteins, chemicals, diseases, species, mutations and cell lines named across the full text — each resolved to its canonical identifier and authoritative record.
Click any figure to enlarge with its caption.
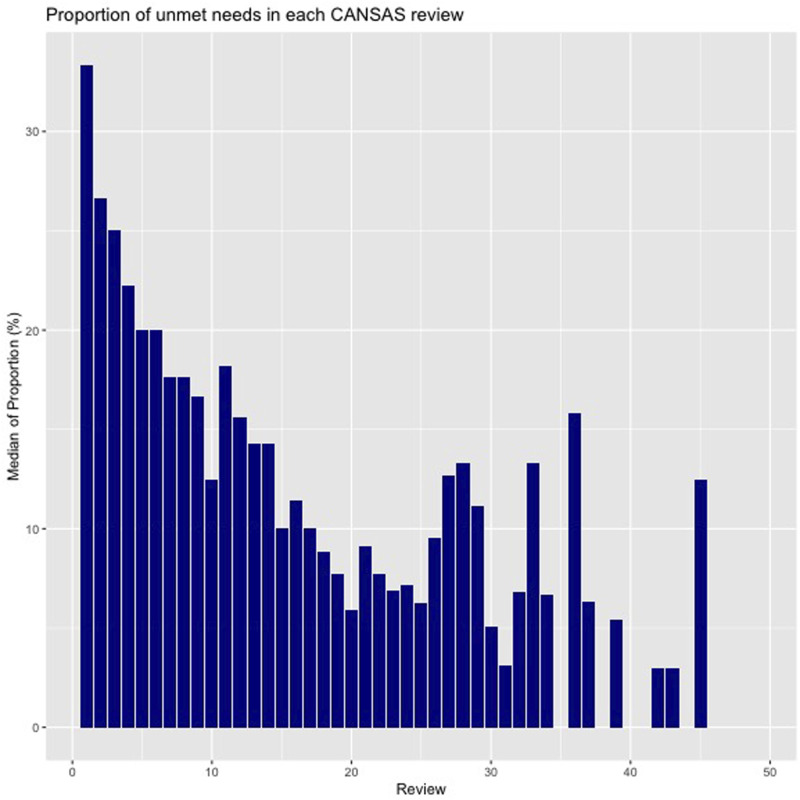 Figure 1
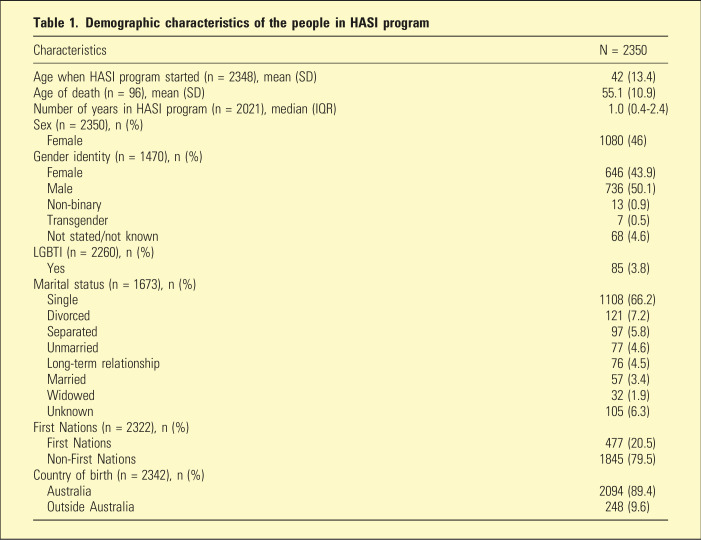 Figure 2
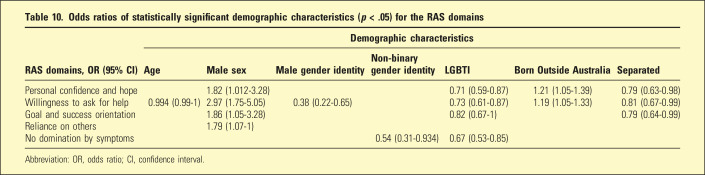 Figure 3
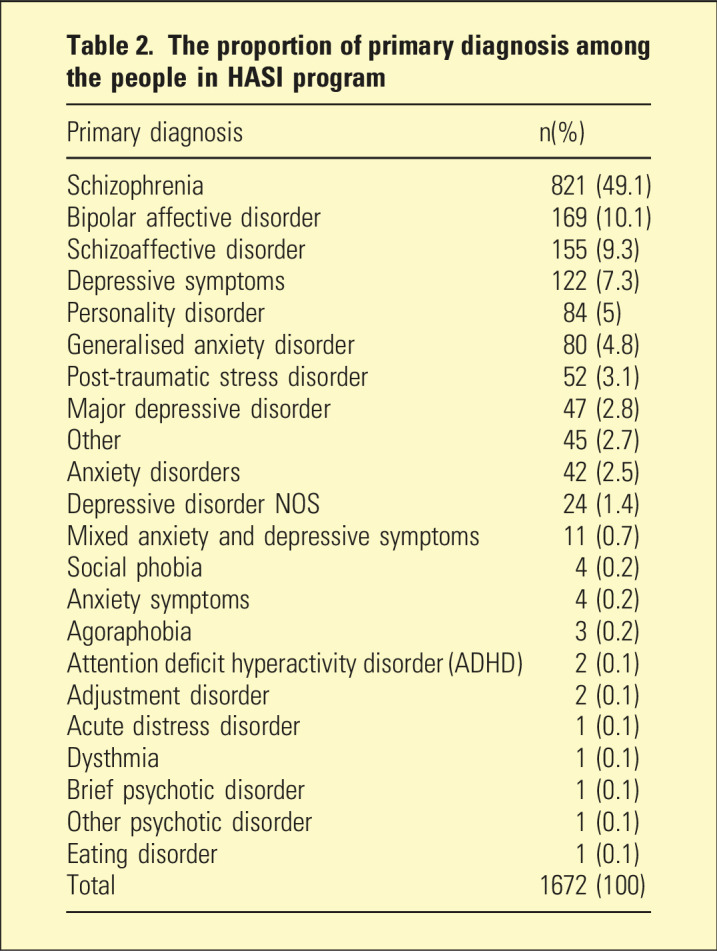 Figure 4
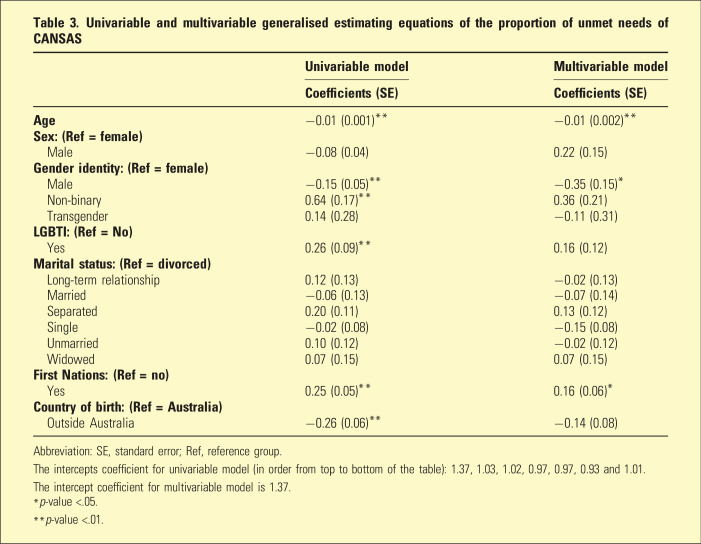 Figure 5
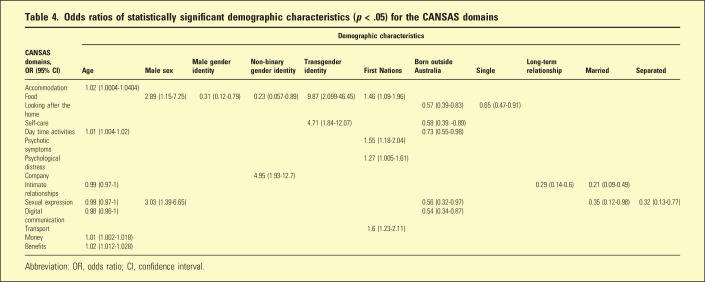 Figure 6
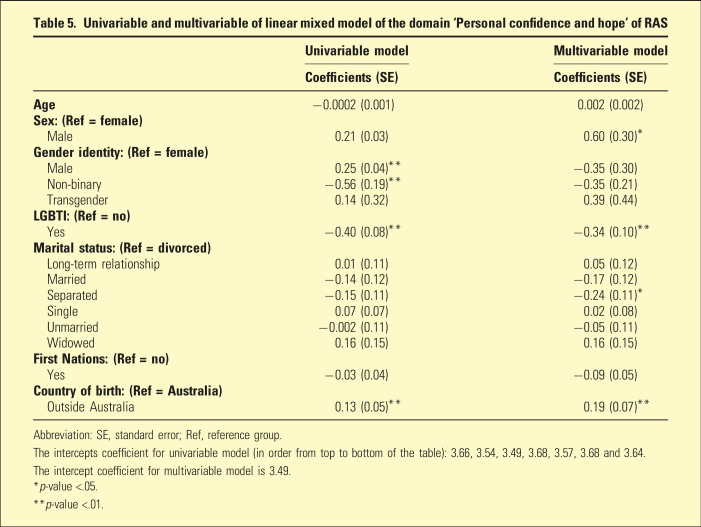 Figure 7
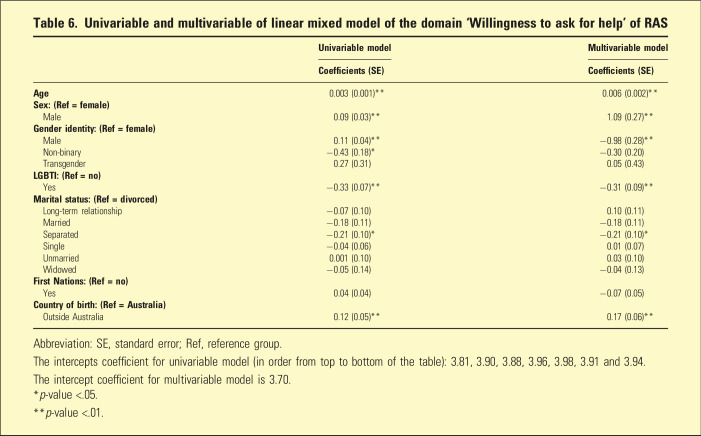 Figure 8
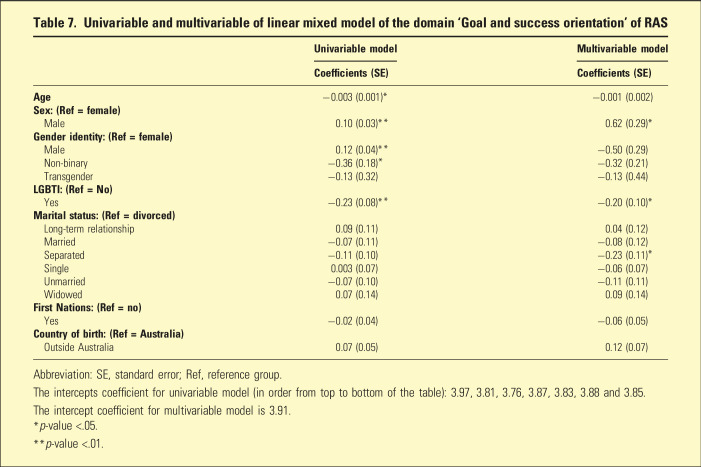 Figure 9
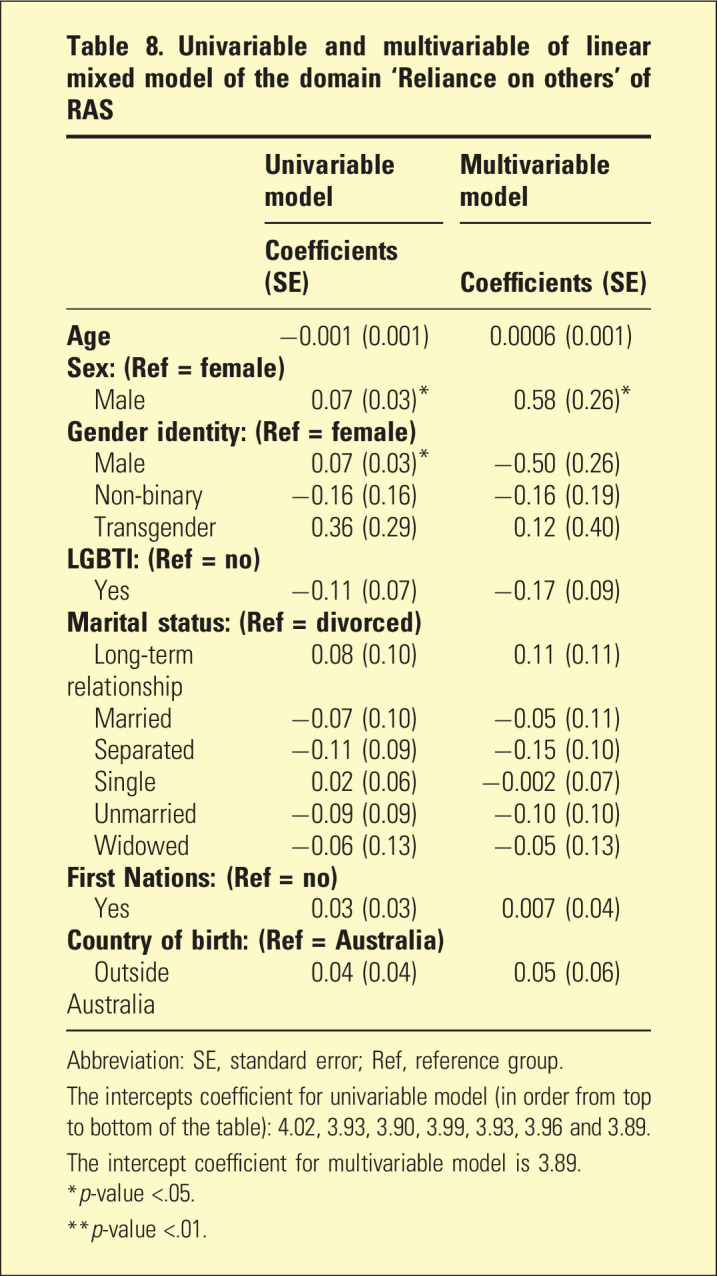 Figure 10
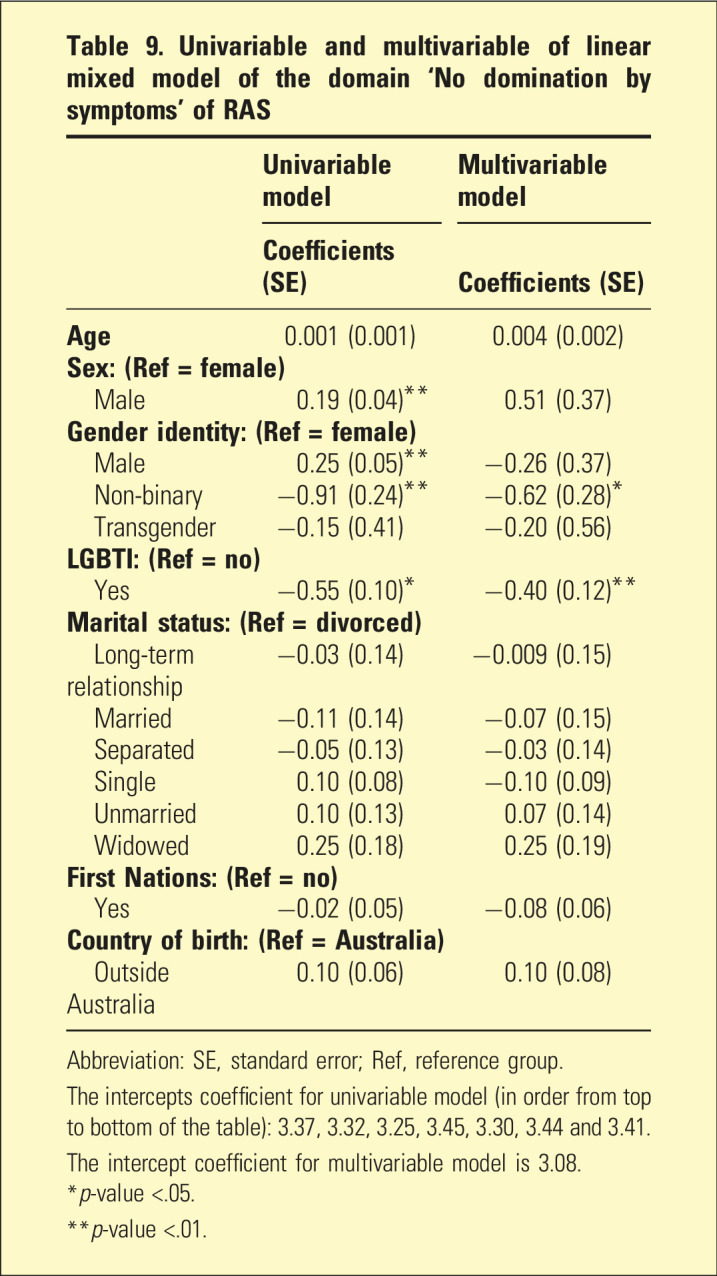 Figure 11
Peer Reviews
No public reviews on file for this paper yet. If you reviewed it on a platform where reviews are public (OpenReview, ICLR, NeurIPS, ICML), you can paste yours below so the community can read it here.
Videos
No videos yet. Explain this paper in a talk, walkthrough, or lecture? Add one.
Taxonomy
TopicsMental Health and Patient Involvement · Homelessness and Social Issues · Health disparities and outcomes
Community Living Supports (CLS), Housing and Accommodation Support Initiative (HASI) and HASI Plus (collectively called the ‘HASI program’ in this study) are funded initiatives by the New South Wales (NSW) Ministry of Health. The HASI and CLS programs serve as the foundation for the NSW government mental health reformation with the key objective to prevent unnecessary hospitalisations and emergency department presentation due to mental health. The eligibility for HASI programs is persons aged 16 years or older, have a diagnosis of a mental illness which causes difficulties in day-to-day life and who wants to receive help to develop and achieve goals.^ 1 ^
HASI and CLS deliver community-based psychosocial support through Community Managed Organisations (CMOs) and Local Health District. Community-based psychosocial support sand HASI Plus provides fit for purpose community-based accommodation, flexible intense accommodation support, high intensity psychosocial support and multidisciplinary mental health support.^2–5^ The HASI program was evaluated in 2022 on a service level by the Social Policy Research Centre, University of New South Wales.^ 4 ^ Similar to mentally supported accommodation services internationally, there is an effect in reducing hospital admissions, reduced duration of hospital stay and increased uptake of appropriate mental health services.
To our knowledge, no evaluation of the program from an individual level has been studied. Individual data may reveal associations between demographic characteristics and mental health recovery outcomes from HASI engagement. An analysis taken over the study period will reveal gaps and areas to improve, enabling specialisation and targeting in respect to priority populations. Hence, this study aimed to investigate the demographic characteristics associated with mental health recovery measures among individuals accessing the HASI program over a 19-year period.
Methods
This is a retrospective cohort study on all individuals in the HASI program supported by Flourish Australia between January 2004 and October 2023. People that had relocated HASI sites or had re-engaged after exiting from HASI program were also included in the analysis.
The peer workers assessed and followed up with all eligible individuals in the HASI program and these were recorded in the Flourish Australia database. The demographic variables included in this study were age, number of years in HASI program, sex, gender identity, LGBTI status, marital status, First Nations and country of birth. Age is defined as the age in years at the start of HASI program engagement. Sex variable refers to biological sex, gender identity is person’s self-concept of their gender and LGBTI status represents one’s sexual orientation.^ 6 ^ ‘Not stated/unknown/not known’ in gender identity and marital status was deemed as missing value and was excluded from the analysis. First Nations included Aboriginal and/or Torres Strait Islander. ‘Australia’ and ‘outside Australia’ were defined according to the country of birth.
Outcome measures
Outcomes to be assessed were in the domains of psychosocial need and recovery measured by the validated questionnaires: Camberwell Assessment of Need Short Appraisal Schedule (CANSAS)^ 7 ^ and Recovery Assessment Scale (RAS),^ 8 ^ respectively. CANSAS was first introduced to the HASI programs in March 2008, followed by RAS in March 2011. Hence, the outcomes were assessed according to these periods onwards. All outcomes were compared among the follow-ups to reflect the change of outcome during the HASI program enrolment. ‘Follow-ups’ is defined as the sequence of assessments with CANSAS and RAS conducted by the individuals, and it is denoted by numbers. The median interval of each CANSAS follow-up was 5.8 months with interquartile range (IQR) of 4.1-8.3 months. The median interval of each RAS follow-up was 3.9 months (IQR: 2.3-6.1 months).
CANSAS
In Australia, CANSAS is the most widely used outcome tool for needs assessment and predominantly used by CMOs. The CANSAS has a high degree of inter-rater and test-retest reliability and is valid in terms of content and face validity.^ 9 ^ CANSAS outcome was summarised by the percentage of unmet needs. Additionally, each question of CANSAS, also known as domain, was described. There were 22 domains with three possible answers: ‘no serious problem’, ‘no serious problem or moderate problem because of continuing intervention (met need)’ and ‘current serious problem (unmet need)’.^ 7 ^
RAS
RAS is an internationally widely used recovery assessment scale.^ 10 ^ To measure recovery the RAS scale was adopted, a 41-item measure with key domains of personal confidence and hope, willingness to ask for help, goal and success orientation, reliance on others and not dominated by symptoms. Items pertaining to these domains were rated using a 5-point scale from 1 strongly disagree to 5 strongly agree.^ 11 ^ Construct validity, test-retest and inter-rater reliability were deemed satisfactory.^ 8 ^
Statistical analysis
The study time for each participant is structured as the total time period from first entry into the HASI program to the date of last recorded exit. Participants with multiple exits from the program were hence counted for the entire study period until last recorded exit. All missing data were excluded from the analysis.
CANSAS was described by summarising responses into median of proportion of unmet needs which is defined as the median of all unmet needs in a follow-up period divided by the total number of needs. A time series analysis was performed on the median of proportion of unmet needs with the assumption that the follow-ups are conducted 6-monthly. Decomposition of the additive time series was performed to evaluate the seasonal, trend and random effect. Decomposition of the time series was performed to determine if data was subject to seasonality or other repeating long-term predictable patterns that may obscure effect size. Univariable and multivariable Poisson model of generalised estimating equations was used to analyse the proportion of unmet needs in each follow-up as the dependent variable and the demographic characteristics as the independent variables. Similarly, binomial model of generalised estimating equations was used to analyse each of the domain with met/unmet needs as the dependent variable and demographic characteristics as dependent variables. Question 12, 13, 17 and 18 were not analysed due to diverging estimates (‘one or more categories has zero count’). These questions represent domains of ‘alcohol’, ‘drugs’, ‘dependents’ and ‘basic education’, respectively.
RAS was summarised by the five domains with a mean of five-point agreement scale with ‘1’ as strongly disagree and ‘5’ as strongly agree for each follow-up.^ 11 ^ A time series analysis was performed and decomposing the additive time series was performed for RAS. A linear mixed model was used to analyse the domains’ score as the dependent variable and the demographic characteristics as the independent variables. In both generalised estimating equations and linear mixed models, the random effect was the multiple follow-ups of an individual, and the fixed effect was the independent variables. R version 4.3.0 was used for the analysis.
This study was approved by the Nepean Blue Mountain Local Health District Low Risk Subcommittee (Ethics number: 2023/ETH02550). Participant’s informed consent was exempted.
Result
A total of 2350 people in Flourish Australia were engaged in HASI program between 2004 and 2023. The number participants with multiple exits from the program were 346(14.7%). The average age when engaged at the start of HASI program was 42 years old with standard deviation (SD) of 12.4 years. The biological sex distribution for female was 1080 (46.0%). The demographic characteristics of the people in HASI program is tabulated in Table 1.Table 1.Demographic characteristics of the people in HASI programCharacteristicsN = 2350Age when HASI program started (n = 2348), mean (SD)42 (13.4)Age of death (n = 96), mean (SD)55.1 (10.9)Number of years in HASI program (n = 2021), median (IQR)1.0 (0.4-2.4)Sex (n = 2350), n (%) Female1080 (46)Gender identity (n = 1470), n (%) Female646 (43.9) Male736 (50.1) Non-binary13 (0.9) Transgender7 (0.5) Not stated/not known68 (4.6)LGBTI (n = 2260), n (%) Yes85 (3.8)Marital status (n = 1673), n (%) Single1108 (66.2) Divorced121 (7.2) Separated97 (5.8) Unmarried77 (4.6) Long-term relationship76 (4.5) Married57 (3.4) Widowed32 (1.9) Unknown105 (6.3)First Nations (n = 2322), n (%) First Nations477 (20.5) Non-First Nations1845 (79.5)Country of birth (n = 2342), n (%) Australia2094 (89.4) Outside Australia248 (9.6)
The most common primary mental health diagnosis was schizophrenia with 821(49.1%), followed by bipolar affective disorder with 169(10.1%) and schizoaffective disorder with 155(9.3%). All the primary diagnoses are tabulated in Table 2.Table 2.The proportion of primary diagnosis among the people in HASI programPrimary diagnosisn(%)Schizophrenia821 (49.1)Bipolar affective disorder169 (10.1)Schizoaffective disorder155 (9.3)Depressive symptoms122 (7.3)Personality disorder84 (5)Generalised anxiety disorder80 (4.8)Post-traumatic stress disorder52 (3.1)Major depressive disorder47 (2.8)Other45 (2.7)Anxiety disorders42 (2.5)Depressive disorder NOS24 (1.4)Mixed anxiety and depressive symptoms11 (0.7)Social phobia4 (0.2)Anxiety symptoms4 (0.2)Agoraphobia3 (0.2)Attention deficit hyperactivity disorder (ADHD)2 (0.1)Adjustment disorder2 (0.1)Acute distress disorder1 (0.1)Dysthmia1 (0.1)Brief psychotic disorder1 (0.1)Other psychotic disorder1 (0.1)Eating disorder1 (0.1)Total1672 (100)
CANSAS
The proportion of unmet needs in the CANSAS reduced from a median of 33.3% (IQR: 12.5-60) of the first follow-up to 5.8% (IQR: 0-30.8) in the 20^th^ follow-up. Figure 1 displays the proportion of the unmet needs in each of the 51 follow-ups. The details of the proportion of unmet needs and total number of needs are tabulated in supplemental S1. The decomposition of the additive time series of the proportion of unmet needs indicated that the trend was unaffected by seasonality and random effect, that is, the observed effect is not affected by long-term predictable cyclical patterns or unexpected single events, hence producing similar trend line between observed and trend graphs in S2.Figure 1.Proportion of unmet needs in each CANSAS review.
In the multivariable generalised estimating equations model, the overall proportion of unmet needs increased significantly with younger age and for First Nations, with adjusted odds ratio (OR) of 1.007 [95% confidence interval (CI): 1.003-1.011] and 1.17 [95% CI: 1.04-1.32], respectively. Conversely, the proportion of unmet needs was reduced for male gender with an adjusted OR of 0.70 [95% CI: 0.52-0.94]. Both the univariable and multivariable models’ coefficients are tabulated in Table 3.Table 3.Univariable and multivariable generalised estimating equations of the proportion of unmet needs of CANSASUnivariable modelMultivariable modelCoefficients (SE)Coefficients (SE) Age −0.01 (0.001)−0.01 (0.002) Sex: (Ref = female) Male−0.08 (0.04)0.22 (0.15) Gender identity: (Ref = female) Male−0.15 (0.05)**−0.35 (0.15)* Non-binary0.64 (0.17)**0.36 (0.21) Transgender0.14 (0.28)−0.11 (0.31) LGBTI: (Ref = No) Yes0.26 (0.09)0.16 (0.12) Marital status: (Ref = divorced) Long-term relationship0.12 (0.13)−0.02 (0.13) Married−0.06 (0.13)−0.07 (0.14) Separated0.20 (0.11)0.13 (0.12) Single−0.02 (0.08)−0.15 (0.08) Unmarried0.10 (0.12)−0.02 (0.12) Widowed0.07 (0.15)0.07 (0.15) First Nations: (Ref = no) Yes0.25 (0.05)*0.16 (0.06) Country of birth: (Ref = Australia) Outside Australia−0.26 (0.06)−0.14 (0.08)Abbreviation: SE, standard error; Ref, reference group.The intercepts coefficient for univariable model (in order from top to bottom of the table): 1.37, 1.03, 1.02, 0.97, 0.97, 0.93 and 1.01.The intercept coefficient for multivariable model is 1.37.*p-value <.05.**p-value <.01.
Multivariable models of each CANSAS domains
In the ‘accommodation’ domain, the age was statistically significant indicating the increased unmet needs with younger age with OR of 1.02 (95% CI: 1.0004-1.0404). In the ‘food’ domain, the statistically significant characteristics were male sex, male gender identity, non-binary gender identity, transgender gender identity and First Nations. Being a male has an OR of 2.89 (95% CI: 1.15-7.25). The models’ coefficients are tabulated in S4 and S5 and the OR of statistically significant demographic characteristics is tabulated in Table 4.Table 4.Odds ratios of statistically significant demographic characteristics (p < .05) for the CANSAS domainsDemographic characteristicsCANSAS domains,OR (95% CI)AgeMale sexMale gender identityNon-binarygender identityTransgender identityFirst NationsBorn outside AustraliaSingleLong-term relationshipMarriedSeparatedAccommodation1.02 (1.0004-1.0404)Food2.89 (1.15-7.25)0.31 (0.12-0.79)0.23 (0.057-0.89)9.87 (2.099-46.45)1.46 (1.09-1.96)Looking after the home0.57 (0.39-0.83)0.65 (0.47-0.91)Self-care4.71 (1.84-12.07)0.58 (0.39 -0.89)Day time activities1.01 (1.004-1.02)0.73 (0.55-0.98)Psychotic symptoms1.55 (1.18-2.04)Psychological distress1.27 (1.005-1.61)Company4.95 (1.93-12.7)Intimate relationships0.99 (0.97-1)0.29 (0.14-0.6)0.21 (0.09-0.49)Sexual expression0.99 (0.97-1)3.03 (1.39-6.65)0.56 (0.32-0.97)0.35 (0.12-0.98)0.32 (0.13-0.77)Digital communication0.98 (0.96-1)0.54 (0.34-0.87)Transport1.6 (1.23-2.11)Money1.01 (1.002-1.018)Benefits1.02 (1.012-1.028)Abbreviation: OR, odds ratio; CI, confidence interval.
Being single and born outside Australia were associated with fewer unmet needs in the ‘looking after the home’ domain. In ‘self-care’ domain, transgender and born outside Australia were statistically significant. Age and being born outside Australia in ‘daytime activities’ domain were statistically significant. The models’ coefficients are tabulated in supplemental tables S6-S8.
No characteristics were statistically significant in ‘physical health’, ‘information on condition and treatment’ and ‘safety to self’ domains. The models’ coefficients are tabulated in S9, S11 and S13. First Nations was statistically significant in ‘psychotic symptoms’, ‘psychological distress’ and ‘safety to others’ domains. The models’ coefficients are tabulated in S10, S12 and S14.
In ‘company’ domain, non-binary gender identity was statistically significant. In ‘intimate relationships’ domain, age, long-term relationship and being married were statistically significant. In ‘sexual expression’ domain, the statistically significant characteristics were age, male sex, being married, separated and born outside Australia. Age and born outside Australia were statistically significant in ‘digital communication’ domain. The models’ coefficients are tabulated in S15-S18. In ‘transport’ domain, First Nations was statistically significant. Age in ‘money’ domain and ‘benefits’ domain was statistically significant. The models’ coefficients are tabulated in S19-S21.
RAS
A total of 139 follow-ups were conducted for RAS. The RAS consistently scored an average above three (i.e. responded with agree or strongly agree) in all domains for all follow-ups of all individuals (S22-26). Similarly, the decomposition of the additive time series of all the RAS domain scores indicated that the trend was unaffected by the seasonal and random components. The number of respondents in each follow-up of RAS is tabulated in S27.
In ‘personal confidence and hope’ domain, the multivariable linear mixed model yielded statistical significance for male sex, LGBTI, separated and being born outside Australia. In ‘willingness to ask for help’, age, male sex, male gender, LGBTI, separated and being born outside Australia were statistically significant. Male sex, LGBTI and being separated were the statistically significant characteristics for domain ‘goal and success orientation’. In ‘reliance on others’, only male sex was statistically significant. LGBTI and non-binary gender identity were statistically significant in domain ‘no domination by symptoms’. Table 5–9 tabulated the models’ coefficients for all five domains of RAS.Table 5.Univariable and multivariable of linear mixed model of the domain ‘Personal confidence and hope’ of RASUnivariable modelMultivariable modelCoefficients (SE)Coefficients (SE) Age −0.0002 (0.001)0.002 (0.002) Sex: (Ref = female) Male0.21 (0.03)0.60 (0.30)* Gender identity: (Ref = female) Male0.25 (0.04)−0.35 (0.30) Non-binary−0.56 (0.19)−0.35 (0.21) Transgender0.14 (0.32)0.39 (0.44) LGBTI: (Ref = no) Yes−0.40 (0.08)−0.34 (0.10) Marital status: (Ref = divorced) Long-term relationship0.01 (0.11)0.05 (0.12) Married−0.14 (0.12)−0.17 (0.12) Separated−0.15 (0.11)−0.24 (0.11)* Single0.07 (0.07)0.02 (0.08) Unmarried−0.002 (0.11)−0.05 (0.11) Widowed0.16 (0.15)0.16 (0.15) First Nations: (Ref = no) Yes−0.03 (0.04)−0.09 (0.05) Country of birth: (Ref = Australia) Outside Australia0.13 (0.05)0.19 (0.07)Abbreviation: SE, standard error; Ref, reference group.The intercepts coefficient for univariable model (in order from top to bottom of the table): 3.66, 3.54, 3.49, 3.68, 3.57, 3.68 and 3.64.The intercept coefficient for multivariable model is 3.49.p-value <.05.p-value <.01.Table 6.Univariable and multivariable of linear mixed model of the domain ‘Willingness to ask for help’ of RASUnivariable modelMultivariable modelCoefficients (SE)Coefficients (SE) Age 0.003 (0.001)0.006 (0.002) Sex: (Ref = female) Male0.09 (0.03)1.09 (0.27) Gender identity: (Ref = female) Male0.11 (0.04)−0.98 (0.28) Non-binary−0.43 (0.18)−0.30 (0.20) Transgender0.27 (0.31)0.05 (0.43) LGBTI: (Ref = no) Yes−0.33 (0.07)−0.31 (0.09)** Marital status: (Ref = divorced) Long-term relationship−0.07 (0.10)0.10 (0.11) Married−0.18 (0.11)−0.18 (0.11) Separated−0.21 (0.10)−0.21 (0.10) Single−0.04 (0.06)0.01 (0.07) Unmarried0.001 (0.10)0.03 (0.10) Widowed−0.05 (0.14)−0.04 (0.13) First Nations: (Ref = no) Yes0.04 (0.04)−0.07 (0.05) Country of birth: (Ref = Australia) Outside Australia0.12 (0.05)0.17 (0.06)Abbreviation: SE, standard error; Ref, reference group.The intercepts coefficient for univariable model (in order from top to bottom of the table): 3.81, 3.90, 3.88, 3.96, 3.98, 3.91 and 3.94.The intercept coefficient for multivariable model is 3.70.p-value <.05.**p-value <.01.Table 7.Univariable and multivariable of linear mixed model of the domain ‘Goal and success orientation’ of RASUnivariable modelMultivariable modelCoefficients (SE)Coefficients (SE) Age −0.003 (0.001)−0.001 (0.002) Sex: (Ref = female) Male0.10 (0.03)*0.62 (0.29) Gender identity: (Ref = female) Male0.12 (0.04)−0.50 (0.29) Non-binary−0.36 (0.18)*−0.32 (0.21) Transgender−0.13 (0.32)−0.13 (0.44) LGBTI: (Ref = No) Yes−0.23 (0.08)−0.20 (0.10)* Marital status: (Ref = divorced) Long-term relationship0.09 (0.11)0.04 (0.12) Married−0.07 (0.11)−0.08 (0.12) Separated−0.11 (0.10)−0.23 (0.11)* Single0.003 (0.07)−0.06 (0.07) Unmarried−0.07 (0.10)−0.11 (0.11) Widowed0.07 (0.14)0.09 (0.14) First Nations: (Ref = no) Yes−0.02 (0.04)−0.06 (0.05) Country of birth: (Ref = Australia) Outside Australia0.07 (0.05)0.12 (0.07)Abbreviation: SE, standard error; Ref, reference group.The intercepts coefficient for univariable model (in order from top to bottom of the table): 3.97, 3.81, 3.76, 3.87, 3.83, 3.88 and 3.85.The intercept coefficient for multivariable model is 3.91.p-value <.05.**p-value <.01.Table 8.Univariable and multivariable of linear mixed model of the domain ‘Reliance on others’ of RASUnivariable modelMultivariable modelCoefficients (SE)Coefficients (SE) Age −0.001 (0.001)0.0006 (0.001) Sex: (Ref = female) Male0.07 (0.03)0.58 (0.26) Gender identity: (Ref = female) Male0.07 (0.03)−0.50 (0.26) Non-binary−0.16 (0.16)−0.16 (0.19) Transgender0.36 (0.29)0.12 (0.40) LGBTI: (Ref = no) Yes−0.11 (0.07)−0.17 (0.09) Marital status: (Ref = divorced) Long-term relationship0.08 (0.10)0.11 (0.11) Married−0.07 (0.10)−0.05 (0.11) Separated−0.11 (0.09)−0.15 (0.10) Single0.02 (0.06)−0.002 (0.07) Unmarried−0.09 (0.09)−0.10 (0.10) Widowed−0.06 (0.13)−0.05 (0.13) First Nations: (Ref = no) Yes0.03 (0.03)0.007 (0.04) Country of birth: (Ref = Australia) Outside Australia0.04 (0.04)0.05 (0.06)Abbreviation: SE, standard error; Ref, reference group.The intercepts coefficient for univariable model (in order from top to bottom of the table): 4.02, 3.93, 3.90, 3.99, 3.93, 3.96 and 3.89.The intercept coefficient for multivariable model is 3.89.p-value <.05.p-value <.01.Table 9.Univariable and multivariable of linear mixed model of the domain ‘No domination by symptoms’ of RASUnivariable modelMultivariable modelCoefficients (SE)Coefficients (SE) Age 0.001 (0.001)0.004 (0.002) Sex: (Ref = female) Male0.19 (0.04)0.51 (0.37) Gender identity: (Ref = female) Male0.25 (0.05)−0.26 (0.37) Non-binary−0.91 (0.24)−0.62 (0.28) Transgender−0.15 (0.41)−0.20 (0.56) LGBTI: (Ref = no) Yes−0.55 (0.10)*−0.40 (0.12)** Marital status: (Ref = divorced) Long-term relationship−0.03 (0.14)−0.009 (0.15) Married−0.11 (0.14)−0.07 (0.15) Separated−0.05 (0.13)−0.03 (0.14) Single0.10 (0.08)−0.10 (0.09) Unmarried0.10 (0.13)0.07 (0.14) Widowed0.25 (0.18)0.25 (0.19) First Nations: (Ref = no) Yes−0.02 (0.05)−0.08 (0.06) Country of birth: (Ref = Australia) Outside Australia0.10 (0.06)0.10 (0.08)Abbreviation: SE, standard error; Ref, reference group.The intercepts coefficient for univariable model (in order from top to bottom of the table): 3.37, 3.32, 3.25, 3.45, 3.30, 3.44 and 3.41.The intercept coefficient for multivariable model is 3.08.*p-value <.05.**p-value <.01.
The OR for male sex was 2.97 (95% CI: 1.75-5.05) in ‘willingness to ask for help’, 1.86 (95% CI: 1.05-3.28) in ‘goal and success orientation’, 1.82 (95% CI: 1.012-3.28) in ‘personal confidence and hope’ and 1.79 (95% CI: 1.07-1) in ‘reliance on others’. Overall, the OR for LGBTI were around 0.67 to 0.82 in four of the RAS domains as tabulated in Table 10.Table 10.Odds ratios of statistically significant demographic characteristics (p < .05) for the RAS domainsDemographic characteristicsRAS domains, OR (95% CI)AgeMale sexMale gender identityNon-binarygender identityLGBTIBorn Outside AustraliaSeparatedPersonal confidence and hope1.82 (1.012-3.28)0.71 (0.59-0.87)1.21 (1.05-1.39)0.79 (0.63-0.98)Willingness to ask for help0.994 (0.99-1)2.97 (1.75-5.05)0.38 (0.22-0.65)0.73 (0.61-0.87)1.19 (1.05-1.33)0.81 (0.67-0.99)Goal and success orientation1.86 (1.05-3.28)0.82 (0.67-1)0.79 (0.64-0.99)Reliance on others1.79 (1.07-1)No domination by symptoms0.54 (0.31-0.934)0.67 (0.53-0.85)Abbreviation: OR, odds ratio; CI, confidence interval.
Discussion
The time series for CANSAS and RAS follow-ups overtime were not affected by the seasonal and random components. The trend in the proportion of unmet needs of CANSAS reduced over time. The trend of RAS scores in all domains maintained and improved overtime consistently above scores of three. These trends of improvements indicate the effectiveness of HASI program in reducing the unmet needs and improve and facilitate the recovery of individuals with severe mental illness. Our discussion focuses on characteristics that have p-value of less than 0.01 rather than 0.05 due to the multiple tests performed.
CANSAS
The younger age when first engaged in the service was associated with higher unmet needs in ‘accommodation’, ‘money’ and ‘benefit’ domains. However, older age was associated with higher unmet needs of ‘digital communication’ domain. However, the strength of association is rather weak with OR nearing one indicating that each year younger in age has minimal effect towards CANSAS unmet needs and RAS scores. Hence, the risk estimation between ‘younger’ and ‘older’ is only meaningful when a large age gap is compared. Nevertheless, we could assume that all three unmet needs found in younger people were interconnected by ‘money’. If they were not qualified in getting ‘benefit’ such as social welfare payment, they would have not had enough money to afford accommodation. HASI program is meant to provide accommodation support to reduce mental health related hospital admissions. With one unmet need resolved, and with the help of the support worker to apply the social welfare payment or able to focus on a job, these three unmet needs will be resolved over time. The older age seems to require more digital technology support. Hence, peer support worker could be more attentive to these needs by providing more support in using digital technology.
Male sex was associated with increased unmet needs in ‘sexual expression’ and ‘food’ domains. As such, additional counsel support on relationship may help in the male’s sexual expression unmet needs. Peer support worker could also support the budgeting of available money for food to resolve such unmet need in males. People who identified themselves as non-binary was associated with higher unmet needs of ‘company’ domain and as transgender was associated with higher unmet needs in ‘self-care’ and ‘food’ domains. The marital status with long-term relationship and being married were associated with less unmet needs in intimate relationship. People who identified themselves as First Nations were associated with higher unmet needs in ‘psychotic symptoms’, ‘safety to others’ and ‘transport’ domains. Thus, more specialised psychological care could be introduced alongside with peer support to further improve these ‘psychotic symptoms’ and ‘safety to others’ unmet needs. Peer support could also be more sensitive to and identify such needs as the priority by helping people who identified themselves as First Nations to obtain early appointment with psychologist or psychiatrist. This may further reduce hospitalisation. As most people of First Nations live in regional and rural areas, the unmet need of transportation was explained by the lack of public transport in those areas. Private transport is therefore needed to support the people of First Nations.
To our knowledge, no study specifically examined the demographic characteristics against each CANSAS domain. Nevertheless, recent systematic review findings indicate the age was associated with the unmet needs and male was associated with higher total unmet needs.^ 12 ^ Ethic minority was also associated with unmet needs but has conflicting results from two studies.^13,14^ The unmet needs of individuals with severe mental illness with aforementioned demographics have been broadly explored in literature. Unmet needs in sexual expression, except bipolar disorder, often associated with adverse drug effects, internalised and structural stigmatisation and complications with conditions.^ 15 ^ In our study, the association found could help support workers to prioritise the unmet needs of the people with certain characteristics, such as the First Nations and males in the HASI program.
RAS
In ‘personal confidence and hope’ domain, people who identified themselves as LGBTI were associated with reduced RAS score but as born outside Australia, it was associated with increase RAS score. In ‘willingness to ask for help’, people who identified themselves as male gender and LGBTI were associated with reduced RAS score as opposed to older age, male sex and being born outside Australia, which were associated with an increase in RAS score.
Male sex was associated with an increase in RAS score but people who identified themselves as LGBTI and being separated were associated with reduced RAS score in ‘goal and success orientation’ domain. In ‘reliance on others’, male sex was associated with an increase in RAS score. People who identified themselves as LGBTI and non-binary gender identity was associated with reduced RAS score in domain ‘no domination by symptoms’.
To our knowledge, no study examined the relationship between demographic characteristics with the RAS domains. Despite the paucity of comparable study, it is evident that LGBTI individuals have more unmet health needs which may be associated with lower RAS score.^16,17^ In our study, demographic characteristics associated with the change in RAS score provide useful information for practice. For example, prioritising people who identified themselves as LGBTI in HASI program may improve the RAS scores in all domains because LGBTI was found to have reduced RAS scores in all domains.
Limitations
Due to the declining number of assessments completed over time, missing data in some of the variables and the refusal to answer the outcome tools could affect the statistical model validity thereby reducing the likelihood of statistical significance. The selective loss to follow-up suggests potential selection bias which could threaten the validity of the findings. Despite such limitations, number of characteristics was found to be associated with both CANSAS and RAS outcomes.
Factors not examined in our study were education level and socio-economic status which may have influence in our study findings.^ 12 ^ Further study on these factors is needed to examine how these interact with demographic characteristics. More studies are also needed to substantiate our findings as this is the first finding in Australia that may not be generalisable to population with severe mental illness outside the country.
The validity findings of this study could be affected due to multiple supports received beyond Flourish Australia. Often, people with complex and severe mental health issue received more than one support in their recovery journey. Our study could not assess if there is additional support received apart from Flourish Australia. However, we do not believe that it is a major shortcoming as these account for only a few people who may need support other than HASI program. Hence, there should not be duplication of HASI program support and the grant funders, that is, NSW government, monitors each individual to ensure they only receive from one provider. Further study should account for this factor to validate the findings. Qualitative studies can reveal explanation on the association found between the demographic characteristics and CANSAS and with RAS.
Conclusion
HASI program engagement is associated with an overall reduction of unmet needs and improvement of the recovery of individuals with severe mental illness. Age, sex, gender, LGBTI, First Nations and country of birth were associated with changes in the CANSAS and RAS outcomes. This is indicative that these demographic variables could aid in the prioritisation of HASI program services across Australia.
Supplemental Material
Supplemental Material - Demographic and mental health characteristics of individuals in the NSW housing and accommodation support initiative (HASI), community living supports and HASI plusSupplemental material for Demographic and mental health characteristics of individuals in the NSW housing and accommodation support initiative (HASI), community living supports and HASI plus by Gary KK Low, Jason Li, Emily Hielscher, Veronica Sheanoda, Sumathi Govindasamy and Fadzi Marasha in Australasian Psychiatry
The reference list from the paper itself. Each links out to its DOI / PubMed record.
- 1NSW Health . Housing and accommodation support initiative (Hasi) and community living supports (CLS). https://www.health.nsw.gov.au/mentalhealth/Pages/services-hasi-cls.aspx (2023, accessed 15 April 2024).10.1177/10398562251316431 PMC 1213814739884664 · doi ↗ · pubmed ↗
- 2Purcal C O’Shea P Giuntoli G , et al. Evaluation of NSW community-based mental health programs: community living supports and housing and accommodation support initiative. Social Policy Research Centre, 2022.
- 3Paul JC . Housing and supports for persons with mental illness: emerging approaches to Research and practice. Psychiatr Serv 1993; 44(5): 439–449.10.1176/ps.44.5.4398509074 · doi ↗ · pubmed ↗
- 4Mc Dermott S Bruce J Oprea I , et al. Evaluation of the mental health, housing and accommodation support initiative (HASI) second report. Prepared for NSW Health and Housing NSW, 2011.
- 5Killaspy H Harvey C Brasier C , et al. Community-based social interventions for people with severe mental illness: a systematic review and narrative synthesis of recent evidence. World Psychiatr 2022; 21(1): 96–123.10.1002/wps.20940 PMC 875157235015358 · doi ↗ · pubmed ↗
- 6Moleiro C Pinto N . Sexual orientation and gender identity: review of concepts, controversies and their relation to psychopathology classification systems. Front Psychol. 2015; 6: 1511.26483748 10.3389/fpsyg.2015.01511 PMC 4589638 · doi ↗ · pubmed ↗
- 7Arvidsson H . Test-retest reliability of the Camberwell assessment of need (CAN). Nord J Psychiatr 2003; 57(4): 279–283.10.1080/0803948031000207512888402 · doi ↗ · pubmed ↗
- 8Salzer MS Brusilovskiy E . Advancing recovery science: reliability and validity properties of the recovery assessment scale. Psychiatr Serv 2014; 65(4): 442–453.24487405 10.1176/appi.ps.201300089 · doi ↗ · pubmed ↗