Economic factors associated with county-level mental health – United States, 2019
Michele L.F. Bolduc, Parya Saberi, Torsten B. Neilands, Carla I. Mercado, Shanice Battle Johnson, Zoe R. F. Freggens, Desmond Banks, Rashid Njai, Kai McKeever Bullard

TL;DR
This study explores how economic factors at the county level in the U.S. are linked to poor mental health in 2019.
Contribution
The study identifies and ranks key economic factors associated with mental health disparities in urban and rural U.S. counties.
Findings
Household income, college degree holders, and SSI and SNAP receipt were top economic factors linked to poor mental health.
Urban and rural counties showed different associations between economic factors and mental health outcomes.
The models explained over 68% of the variation in poor mental health prevalence between counties.
Abstract
A better understanding of whether and how economic factors impact mental health can inform policy and program decisions to improve mental health. This study looked at the association between county-level economic factors and the prevalence of self-reported poor mental health among adults in United States counties in 2019, overall and disaggregated for urban and rural counties. General dominance analyses were completed to rank-order the relative influence of the selected variables in explaining county prevalence of adults reporting > 14 poor mental health days in the last 30 days (“poor mental health”). The highest weighted variables were assessed for the statistical significance of their relationships with county-level poor mental health through multiple linear regression. Across all models, the four highest-ranked economic factors were household income, receipt of Supplemental Security…
Genes, proteins, chemicals, diseases, species, mutations and cell lines named across the full text — each resolved to its canonical identifier and authoritative record.
Click any figure to enlarge with its caption.
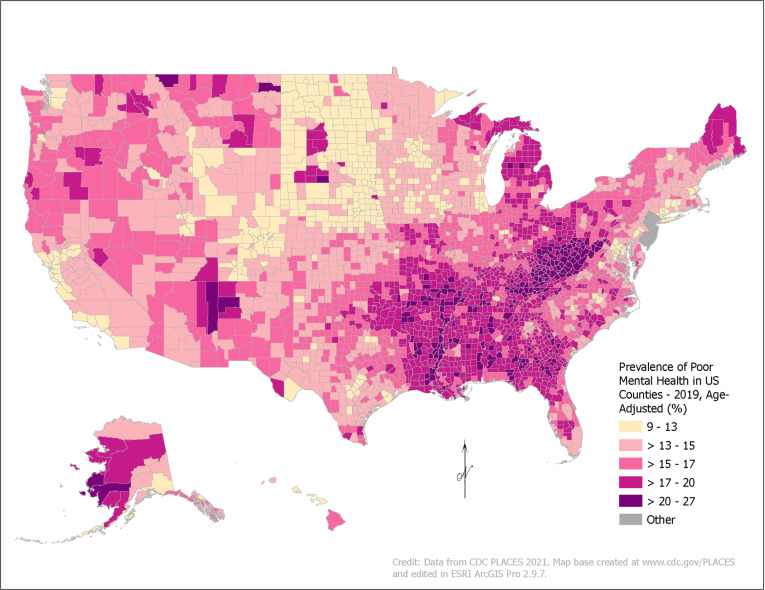 Fig 1
Fig 1Peer Reviews
No public reviews on file for this paper yet. If you reviewed it on a platform where reviews are public (OpenReview, ICLR, NeurIPS, ICML), you can paste yours below so the community can read it here.
Videos
No videos yet. Explain this paper in a talk, walkthrough, or lecture? Add one.
Taxonomy
TopicsHealth disparities and outcomes · Employment and Welfare Studies · Global Health Care Issues
Introduction
Mental health is a key component of overall health and well-being, and mental health conditions are common in the United States [1]. The prevalence of any mental, behavioral, or emotional disorder among US adults has been increasing since 2008, reaching 20.6% by 2019 [2]. An estimated 9.2% of adults have received mental health treatment in the last 12 months [3], but almost half (43.8%) of adults who needed treatment did not receive it [2]. Poor mental health, which includes stress, depression, and problems with emotions, can be experienced by people with or without a diagnosable mental health condition. It is a risk factor for a range of chronic diseases and injuries, from stroke to diabetes [4–6]. Poor mental health is also costly for the economy in terms of losses of productivity and the costs of treatment [7]. For example, Major Depressive Disorder alone cost the US an estimated $326 billion in 2018, a 37.9% increase over the costs in 2010, primarily due to increasing workplace costs [8]. Though the causes of poor mental health are complex, addressing the preventable factors that affect mental health could reduce the economic burden of poor mental health and improve overall public health.
The socio-ecological model of mental health acknowledges the role that individual, social, and societal factors have in mental health and well-being [9–11]. These factors, visualized by Michaels et al 2021 as six levels of interacting and nested social and environmental factors [10], may have a positive or negative role in the development or worsening of poor mental health. One such factor is an individual’s socioeconomic and financial situation, including employment status and income. One survey found that among people in the US, the top personal stressors were work (64% of respondents) and money (60%); 46% indicated the economy was a significant source of stress [1]. Exposure to adverse conditions, such as material hardship, “undoubtedly leads to stress and known psychological and physiological stress responses” that increase the risk of mental health conditions [12]. These issues may be exacerbated on a population level in difficult economic times, with higher rates of suicide, homicide, substance abuse, and psychiatric disorders noted during financial crises [13–16]. An exploration of the economic factors that impact mental health could inform possible public health interventions.
Improving population mental health requires a broadening of focus from individual treatment – which is costly to patients and the healthcare system – to population-level or systems-based approaches. Specifically, it necessitates a move from the more proximal non-medical factors that impact health to the upstream drivers of those factors [17–19]. Upstream drivers relate to how policy and economics shape the distribution of resources; changes at this level have the potential for greater impacts on population health [17,20]. Upstream interventions in policy, programs, and practice place the responsibility of health on decision-makers to undertake broader systemic change rather than focus on individual choice and behavior [12], which could have larger impacts across the life course and across generations [21].
Data demonstrating whether economic factors may be associated with mental health can inform policy and program decisions. This study, therefore, examines the association between county-level economic variables impacting health (referred to in this paper as ‘economic factors’) and the prevalence of self-reported poor mental health among adults in US counties in 2019.
Methods
This analysis is a cross-sectional, ecological study of the association between county-level economic variables (e.g., county Gross Domestic Product [GDP], income inequality, housing affordability) and self-reported poor mental health prevalence for US counties in 2019. Data for 2019 were used to get a baseline understanding of the economic factors associated with mental health prior to the start of the COVID-19 pandemic.
The dependent variable of self-reported poor mental health comes from Centers for Disease Control and Prevention (CDC) PLACES data (www.cdc.gov/places), which produces small area estimates using data from CDC’s Behavioral Risk Factor Surveillance System (BRFSS). The BRFSS (www.cdc.gov/brfss) is a telephone survey through which states collect information on health-related risk behaviors and health conditions, with over 400,000 adult participants each year. The survey asks the question, “Now thinking about your mental health, which includes stress, depression, and problems with emotions, for how many days during the past 30 days was your mental health not good? [22]” BRFSS defines poor mental health as responses indicating >14 poor mental health days over the last 30 days. PLACES uses the BRFSS data to generate county-level prevalence estimates of poor mental health for all US states and the District of Columbia, using a multilevel statistical model that considers individual-level demographic data from BRFSS, county-level percentage of adults below 150% of the federal poverty level from the American Community Survey (ACS), and state- and county-level random effects [23]. Estimates for poor mental health prevalence are available for 3,121 counties for 2019, with 23 missing counties in New Jersey (not available from BRFSS) and Alaska (missing the newer Chugach and Copper River Census Areas).
Economic variables originate from the US Bureau of Economic Analysis (BEA) and from American Community Survey (ACS) five-year estimates for 2019 (S1 Table). Variables were chosen to measure economic factors (relating to the production, distribution, and consumption of goods and services) meaningful at the county level. Business variables from BEA were selected to measure current and changing county-level economic activity, including real GDP, 10-year change in GDP, and 10-year change in county GDP. Business variables from BEA are not available for 51 jurisdictions in Virginia due to combined independent city/county estimates, nor for two counties in Hawaii (Maui and Kalawao) due to combined county estimates. Employment variables covered a range of work-related issues, including unemployment rate, employed but under the Federal Poverty Level (known throughout this paper as ‘working poverty rate’), mean usual hours worked over the last 12 months, employees working from home, and mean travel time to work. Income and wealth variables include median individual earnings, median household income, population with a college degree, two measures of inequality (Gini Index of income inequality and the female/male pay gap), percent of the population with public assistance income (Social Security, Supplemental Security Income [SSI], and cash public assistance), as well as homeownership rate (as a significant component of wealth-building). Several variables were included to cover key expenses – two housing affordability variables (for homeowners, population with Selected Monthly Owner Costs as a Percentage of Household Income [SMOCAPI] costs of at least 30%, and, for renters, population with Gross Rent as a Percent of Household Income [GRAPI] costs of at least 30%), a food security variable (percent receiving Supplemental Nutrition Assistance Program or SNAP benefits), and two health insurance coverage variables (percent uninsured and percent with public health insurance coverage). Two more variables were added to capture county-level economics, including median home value and 10-year population change. Two additional variables from County Health Rankings (CHR) were used to capture the county availability of healthcare providers, which could shape the prevalence of poor mental health through availability of medical treatment: Primary Care Provider Ratio (from the CHR 2022 dataset) and Mental Health Provider Ratio (from the CHR 2020 dataset), both of which indicate the ratio of the population to the number of health providers. All data were merged into a single dataset using Federal Information Processing Standards (FIPS) codes for each county as the common attribute.
Our first step was to use PLACES data to map the prevalence of poor mental health at the county level for 2019 in ArcGIS Pro 2.9.7 (Environmental Systems Research Institute, Redlands, CA, USA). Stata version 17.0 (StataCorp LP, College Station, TX, USA) was used to complete the following analyses for all US counties and by county urban or rural classification based on the 2013 USDA Rural-Urban Continuum Codes. The median and Interquartile Range (IQR) for each variable were described across all counties in the datasets. Next, variable clustering was used to remove two highly collinear (>0.5 Spearman coefficient) and redundant (based on our understanding of the literature) variables from our analysis: median earnings (keeping median household income) and change in real GDP (keeping change in GDP). General dominance analyses were then completed using the Stata package domin with all the remaining economic variables to rank-order the relative influence of the variables in explaining county-level poor mental health, overall and for urban and rural counties separately [24]. This method finds the proportion of the total R^2^ accounted for by each variable based on the average R^2^ across all possible subsets of regression models. Using scree plots (S1 Fig), the most influential (highest weighted) variables were identified from the dominance analyses based on dominance weights above the “elbow” of the graph. We retained eleven influential variables in the overall model, seven in the urban model, and eight in the rural model. The retained variables were then assessed for the statistical significance of their relationships with county-level poor mental health through multiple linear regression.
Results
Fig 1 shows the prevalence of poor mental health across all counties in 2019, with a mean of 16.0% and a median of 15.8% (IQR: 14.1–17.8%). County prevalence ranged from 9.7% (Falls Church, VA) to 26.3% (East Carroll Parish, LA). Across the US, prevalence was higher in Appalachia and the Deep South and parts of Alaska, Montana, South Dakota, and the Southwest. Lower prevalence was found in the Upper Midwest.
Estimated Prevalence of Poor Mental Health by County, United States, 2019.Data come from CDC PLACES, which is modeled from the CDC Behavioral Risk Factor Surveillance System (BRFSS). BRFSS asks the question, “Now thinking about your mental health, which includes stress, depression, and problems with emotions, for how many days during the past 30 days was your mental health not good?” Self-reported poor mental health is defined as responses of >14 poor mental health days over the last 30 days.
Median and IQR values for each economic variable in 2019 are listed in Table 1. Table 2 shows the most influential economic variables for county-level poor mental health identified using the dominance analysis based on standardized dominance weights. The top variables for all counties overall were percent of households with SSI, median household income, percent of households receiving SNAP benefits in the last 12 months, percent of the population 25 years or older with a college degree, and percent of the population with public health insurance. The top results were similar for urban counties. For rural counties, the results were similar, but travel time from work ranked higher than receipt of public insurance.
Table 1: Summary Statistics for Variables Used to Analyze County-Level Association Between Economic Factors and Estimated Prevalence of Poor Mental Health, United States, Overall and by Urban/Rural Classification, 2019.
Table 2: Most-to-Least Influential County-Level Economic Variables Contributing to County Prevalence of Poor Mental Health Based on Dominance Analysis Ranked by Standardized Dominance Weights, Overall and by Urban/Rural Classification, United States, 2019.
In the overall model using the top eleven variables identified in the scree plot, county-level measures significantly positively associated with the prevalence of poor mental health included: unemployment, working poverty rate, mean travel time to work, households with Social Security, households with SSI, and households with SNAP benefits (Table 3). County-level measures significantly inversely associated with poor mental health prevalence were employees working from home, median household income, and percent of the population with a college degree. The largest coefficients were in median household income, percent of the population working from home, and population receiving SSI. The variables in the overall model explained 70% (Adjusted R^2^ = 0.7001) of the variation in poor mental health prevalence between counties.
Table 3: Beta Coefficients, 95% Confidence Interval, and Statistical Significance for County-Level Economic Variables Using Linear Regression with Prevalence of Poor Mental Health as the Dependent Variable, Overall and by Urban/Rural Classification, United States, 2019. Blue-filled cells indicate a positive association between the variable and the dependent variable; red-filled cells indicate a negative association; greyed out cells indicate the variable was not significant; blank cells indicate a variable that was not included in the model.
For urban counties, all seven variables used in the model were highly statistically significant in similar directions; however, two variables that were not significant in the overall model were negatively associated with poor mental health in urban counties: population with public insurance and median home value. The model explained over 68% (Adjusted R^2^ = 0.6867) of the county variation in poor mental health prevalence.
In the rural model, all eight county-level economic measures used in the regression were statistically significantly associated with poor mental health prevalence, in the same direction as the associations in the overall model. In contrast to urban counties, public health insurance was significantly positively associated with poor mental health. The adjusted R^2^ values indicate that the rural model explained 69.1% of the variation in county-level prevalence of poor mental health.
Discussion
We identified the top most influential economic factors associated with self-reported poor mental health at the US county level; these variables explained at least 68% of the variation in poor mental health between counties in 2019 in all models. The explanatory variables associated with poor mental health were consistent in urban and rural models with some variation in their weighted ranking in the dominance analysis. Across all models, the four highest-ranked economic factors were related to income and expenses: receipt of SSI, household income, receipt of SNAP benefits, and population with a college degree.
Based on our findings, median household income was the most influential factor associated with county-level poor mental health in all models. Our results show that higher median income in a county is associated with a lower prevalence of poor mental health. Income is a key factor in overall health because it provides households with the resources necessary for health and wellbeing, including basic needs like nutritious food, safe housing, and health care services and other resources like higher education [25]. Lower incomes put children and adults at higher risk for stress, worse physical health, exposure to adverse conditions in early life, and exposure to violence and crime, any of which could trigger mood and anxiety disorders [26–28]. A reduction in or loss of income may be particularly harmful to mental health [26,29,30]. In addition, there is evidence that interventions aimed at reducing poverty, such as through cash transfers, have a positive effect on mental health, particularly when the support lifts someone out of poverty [26,29].
One type of income support, SSI benefits, was also significant in all models. The results showed that as the percentage of the population with SSI benefits increased, so too did the prevalence of poor mental health. This relationship is interpreted as bidirectional: receipt of SSI could be an economic indicator that influences mental health, but mental health conditions may enable someone to receive SSI. SSI provides fixed, monthly supplemental financial assistance to people who are: under 65 years old who are blind or have a disability (including mental disorders) that makes it difficult to perform substantial gainful activity or over 65 years old without a disability who live on a low income. Among the 72% of SSI recipients who are under 65 years old, six out of 10 were receiving SSI due to a mental health disorder [31]. In addition, adults with disabilities or who have low incomes are more likely to report frequent mental distress than those without disabilities or with higher incomes [32]. The significant association between receipt of SSI and prevalence of poor mental health could be explained by the higher rate of mental health disorders among SSI recipients than among the general public; however, the relationship may also suggest that the program on its own may not be able to economically mediate the impact that other factors have on the number of poor mental health days experienced by people with disabilities (including mental illness) and/or low incomes.
Similarly, a higher number of SNAP recipients in a county was associated with higher prevalence of poor mental health. To be eligible for SNAP benefits, households must meet certain gross and net income and resource limits, making SNAP a proxy for low-income households. Under special SNAP rules, recipients with disability income (e.g., SSI) only need to meet net income limits. The positive relationship between SNAP benefits and poor mental health may reflect higher prevalence of mental health conditions among recipients. An estimated 28% of non-elderly SNAP recipients have a disability (which could include mental health conditions); of those with a disability, almost 60% receive social security benefits [33]. Though SNAP benefits may have a positive impact on public health [34], the results of these models suggest that SNAP benefits may not be able to make up for the financial gaps people with low incomes and/or disabilities may have and the impacts of these financial shortfalls on mental health.
Although the percentage of the population with public health insurance coverage was a highly weighted factor in the dominance analysis for all models, it was not statistically significant in the overall model and opposite relationships were seen in the urban (negative) and rural (positive) models. Like SSI and SNAP households discussed previously, the positive relationship between public health insurance coverage and poor mental health may indicate that access to public insurance may not mediate the impact of having a low income, and this appears to be particularly true for rural areas. Having public health insurance may play more of a protective role in the prevalence of poor mental health in urban counties. The contrasting relationships to poor mental health in urban and rural counties support the need to examine associations with urban and rural economic factors separately.
The significance of having a college degree for lower prevalence of poor mental health in all models may be related to higher wages associated with greater educational attainment [35], access to jobs with benefits like health coverage, and the increased potential to build wealth with a college degree. College education may also have an independent effect on mental health after controlling for income due to increased non-income related benefits, like broader social networks and other resources, resulting in lower rates of death and longer lives [12]. Lower levels of educational attainment are associated with increased risk of some psychiatric diagnoses like Major Depressive Disorder and Generalized Anxiety Disorder [36] and higher rates of suicide [37]. Conversely, there is a bidirectional relationship between education and mental health: poor mental health is associated with higher risk of early termination of education, limiting educational attainment [38].
In addition to the income and expense variables, we found that as mean travel time to work (used in the overall and rural models) increased, the prevalence of poor mental health increased, which could be explained as a function of the increased time spent making driving-related decisions, leading to higher stress levels [39]. The results showed that the percentage of employees working from home (used in the overall and rural models) was inversely associated with poor mental health, which also may be related to commute time and other aspects of remote work that support mental well-being, such as fewer distractions, a more comfortable environment, and more time to spend with family or cook meals [40].
An unexpected result was the null finding for median home values across all US counties, yet significant association for the urban model. Median home value in urban counties had a significant inverse relationship with poor mental health. This is consistent with other studies like those on the Moving to Opportunity for Fair Housing Demonstration Program that have shown that higher income and higher opportunity neighborhoods may improve mental and physical health, especially for adults [41–43], possibly relating to less exposure to neighborhood level stressors like crime [43] and greater access to health-promoting resources like high-quality medical providers [44] and recreation facilities and amenities in good condition [45] than are available in poorer neighborhoods.
While individual- and clinical-level interventions to address these economic drivers exist, such as connecting patients receiving mental health care with economic resources to ease financial burdens, these types of interventions are not sufficient [12]. Population health improves as income increases, particularly for populations in the lowest income brackets [26,29]. Interventions that systematically address poverty and the financial burden of basic needs like health insurance and food may have a greater impact on health in the US than a narrow focus on individual interventions [20]. Addressing the economic drivers of poor mental health may also have cascading impacts on a range of other chronic health outcomes that share the same drivers, from mortality to substance abuse [46–49].
Policy considerations relating to household income that may have a positive effect on county-level mental health include expanding programs for federal income subsidies [50]; ensuring income support for households during difficult financial times, such as unemployment [51,52]; establishment of a universal basic income [53]; increasing federal, state, or local minimum wages [54,55]; offering additional tax breaks or credits for low-income households [56,57]; and enacting policies which promote broader access to higher-paying employment opportunities [58]. Programs like SSI that provide financial assistance to people with poor mental health who may have challenges maintaining stable work and health insurance for treatment could positively impact mental health. Similarly, policies and programs that support people with low incomes so they can afford necessary expenses like housing and food may have a beneficial impact on mental health, beyond the original intentions of the program [59,60]. Additional interventions that might benefit population mental health include increasing educational opportunities, such as high school completion initiatives, low-cost technical college programs, and college tuition assistance [61,62]; expanding access to healthcare through subsidized or universal health insurance coverage [63–65]; and thoughtful implementation of policies supporting work from home [66].
Future analyses could evaluate which approaches are most likely to improve mental health. However, economic considerations may be necessary but insufficient to comprehensively address the persistence of poor mental health in the US. A systems approach would help understand the most effective ways to improve mental health. Impactful changes in one place can have cascading effects and create systemic change [21]. Assessment of the mental health consequences of any new policy or policy change could be standard practice, in line with a Health in All Policies approach [67]. However, the full effects of large-scale, upstream, systemic changes may not be seen for many years [7].
Additional research could clarify the relationships between economic factors and mental health at the individual level, but more data on non-medical factors (such as standardized data in electronic health systems [68]) are needed to capture how mental health may be influenced by non-medical factors on an individual basis. Relatedly, the importance of each economic variable would be expected to vary depending on other geographic and demographic variables (e.g., age, sex, race, ethnicity, and nativity). Social and economic inequalities persist for various demographic groups [69], and these issues are not fully reflected in existing datasets. Future research could continue to explore the relationships between economic factors and other variables that indicate differences in health outcomes across populations and places, as well as the most effective change points for interventions.
Our study had three main limitations. First, we conducted an ecological, cross-sectional study to assess county-level associations, limiting our ability to infer causality. To minimize bias and the influence of confounding, future studies could employ sophisticated models such as fixed effects with time-dependent predictors using longitudinal data. For example, researchers could explore how changes in any of these factors may lead to short- or long-term changes in mental health outcomes. Second, this study carries forward the limitations of our original data sources. For example, the mental health prevalence estimates use data from BRFSS, which uses self-reported answers to a single question to assess mental health status. The variable is broad and likely includes a range of mental health conditions, from diagnosable mental illness to stress, that impact number of poor mental health days. We expect these conditions have varying relationships to the economic factors explored here. Additional studies could explore the associations between economic factors and the prevalence of specific mental health conditions and/or alternative measures of poor mental health. Third, reduced sample sizes in the urban- and rural-specific models may have impacted our findings.
Nevertheless, this study contributes to the existing literature on the economics of poor mental health in three important ways. First, we explore a range of economic factors at the county level that may influence mental health status, including unique neighborhood-level and economic variables that could be used as a starting point for further analysis. It also provides a baseline analysis to understand economic factors related to mental health at the county-level prior to the major economic disruptions associated with the COVID-19 pandemic, which worsened mental health challenges [70–72]. Finally, it applies dominance analysis techniques to go beyond the identification of potential drivers to rank these drivers in order of influence, which can inform the prioritization of policies and programs to improve mental health status.
Conclusions
This study provides important data to researchers and policymakers on the association of economic factors and mental health. This study found that higher county-level access to resources, including income, education, and health insurance, is associated with a lower prevalence of poor mental health. Economic factors shape the distribution of resources and opportunities needed to maintain mental well-being and these distributions are geographically uneven across the US. Additional research could explore additional economic variables as indicators and their relationship to specific mental health outcomes (e.g., depression); spatial trends in poor mental health over time; and possible mental health-specific population-level interventions and their effectiveness in improving mental health to improve public health and address geographic and demographic differences in negative mental health outcomes.
Supporting information
S1 FigScree Plots of Dominance Weights Identified by the Dominance Analysis of Economic Variables in Relation to Poor Mental Health, for Overall, Urban, and Rural Counties.(a) In the overall model, the “elbow” on the plot at variable 12 (indicated in red) shows where the dominance weights drop off most steeply in value; values to the left of the elbow (11 total) were retained as significant for our overall linear regression model. (b) The urban scree plot indicates a steep drop in weights after variable 2, and the second steepest drop after variable 7. To capture additional factors impacting mental health, we retained the top seven variables for the urban linear regression model. (c) The steepest decline in the rural scree plot came after variable 8. The top eight variables were retained for the rural linear regression model.(DOCX)
S1 TableVariables Used to Analyze County-Level Association Between Economic Factors and Estimated Prevalence of Poor Mental Health and their Sources, United States, 2019.(DOCX)
The reference list from the paper itself. Each links out to its DOI / PubMed record.
- 1American Psychological Association. Stress in America: Stress and current events. 2019. Available from: https://www.apa.org/news/press/releases/stress/2019/stress-america-2019.pdf
- 2Substance Abuse and Mental Health Services Administration. Key substance use and mental health indicators in the United States: Results from the 2019 National Survey on Drug Use and Health. HHS Publication No PEP 20-07-01-001, NSDUH Series H-55. 2020. Rockville, MD: Center for Behavioral Health Statistics and Quality. Available from: https://www.samhsa.gov/data/report/2019-nsduh-annual-national-report
- 3Terlizzi EP, Schiller JS. Mental health treatment among adults aged 18-44: United States, 2019-2021. NCHS Data Brief, No 444. 2022. Hyattsville, MD: National Center for Health Statistics. Available from: 10.15620/cdc:12029336135999 · doi ↗ · pubmed ↗
- 4Liao B, Xu D, Tan Y, Chen X, Cai S. Association of mental distress with chronic diseases in 1.9 million individuals: A population-based cross-sectional study. J Psychosom Res. 2022;162:111040. doi: 10.1016/j.jpsychores.2022.111040 36137487 · doi ↗ · pubmed ↗
- 5Rashid M, Mazharul Islam M, Li A, Shifa N. Frequent mental distress among adults in the United States and its association with socio-demographic characteristics, lifestyle, and chronic health condition. JPHD. 2022;20(1). doi: 10.55131/jphd/2022/200112 · doi ↗
- 6Scott KM, Lim C, Al-Hamzawi A, Alonso J, Bruffaerts R, Caldas-de-Almeida JM, et al. Association of Mental Disorders With Subsequent Chronic Physical Conditions: World Mental Health Surveys From 17 Countries. JAMA Psychiatry. 2016;73(2):150–8. doi: 10.1001/jamapsychiatry.2015.2688 26719969 PMC 5333921 · doi ↗ · pubmed ↗
- 7Knapp M, Wong G. Economics and mental health: the current scenario. World Psychiatry. 2020;19(1):3–14. doi: 10.1002/wps.20692 31922693 PMC 6953559 · doi ↗ · pubmed ↗
- 8Greenberg PE, Fournier A-A, Sisitsky T, Simes M, Berman R, Koenigsberg SH, et al. The Economic Burden of Adults with Major Depressive Disorder in the United States (2010 and 2018). Pharmacoeconomics. 2021;39(6):653–65. doi: 10.1007/s 40273-021-01019-4 33950419 PMC 8097130 · doi ↗ · pubmed ↗