Advanced Quantification Pipeline Reveals New Spatial and Temporal Tumor Characteristics in Preclinical Multiple Myeloma
Zhixin Sun, Jacqueline Godbe, Alexander Zheleznyak, Brad Manion, Junhao Hu, Julie Prior, Kathleen Duncan, Ulugbek S. Kamilov, Monica Shokeen

TL;DR
A new imaging pipeline improves the analysis of tumor progression in preclinical multiple myeloma by enabling precise, reproducible quantification of tumor distribution and bone involvement.
Contribution
A semi-automated PET/CT pipeline for preclinical MM studies that enables sub-organ resolution and addresses excretion artifacts and alignment issues.
Findings
Tumor burden preferentially localizes to skeletal regions near joints.
Early disease progression and aggressive phenotypes were detected using precise CT-based alignment.
Female mice showed greater bone loss near the hip joint at later stages compared to males.
Abstract
Radiological imaging plays an indispensable role in both preclinical and clinical studies of multiple myeloma (MM). However, manual quantification in longitudinal small animal PET/CT is limited by annotator bias, signal artifacts from urinary/fecal excretion, and voxel misalignment due to non-rigid registration. To address these challenges and improve characterization of tumor biology, we developed a semi-automated PET/CT quantification pipeline targeting defined regions of interest (ROIs) within the bone marrow-rich mouse skeleton, achieving sub-organ spatial resolution, including in anatomically complex sites such as the pelvis. We applied this MM-specific preclinical pipeline to analyze tumor distribution in a longitudinal molecular PET study using an immunocompetent mouse model of skeletally disseminated MM. An Attention U-Net was trained to segment the thoracolumbar spine, pelvis…
Genes, proteins, chemicals, diseases, species, mutations and cell lines named across the full text — each resolved to its canonical identifier and authoritative record.
Click any figure to enlarge with its caption.
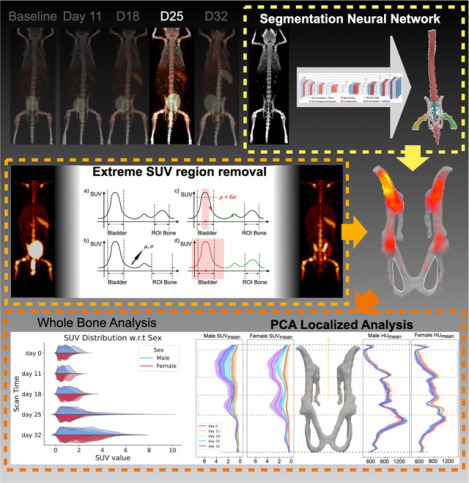 Figure 1
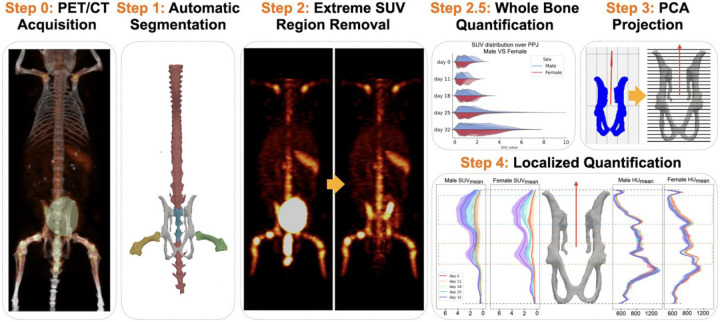 Figure 2
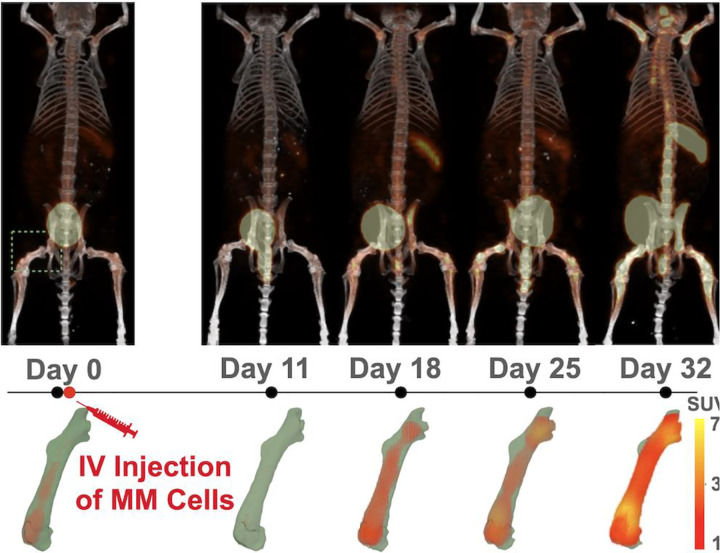 Figure 3
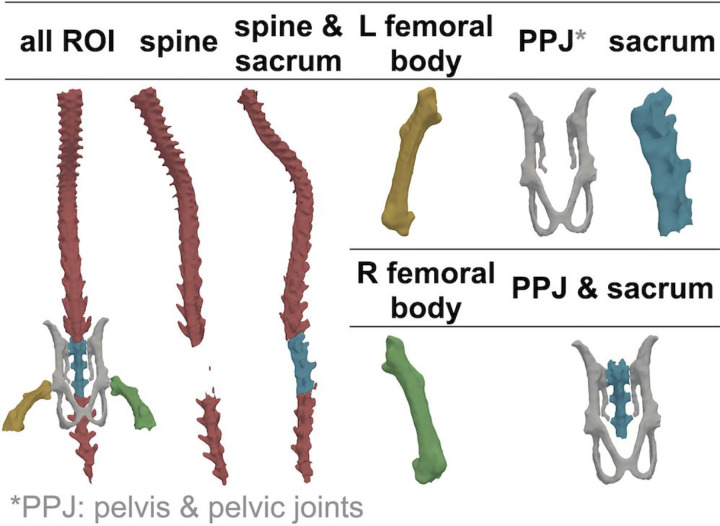 Figure 4
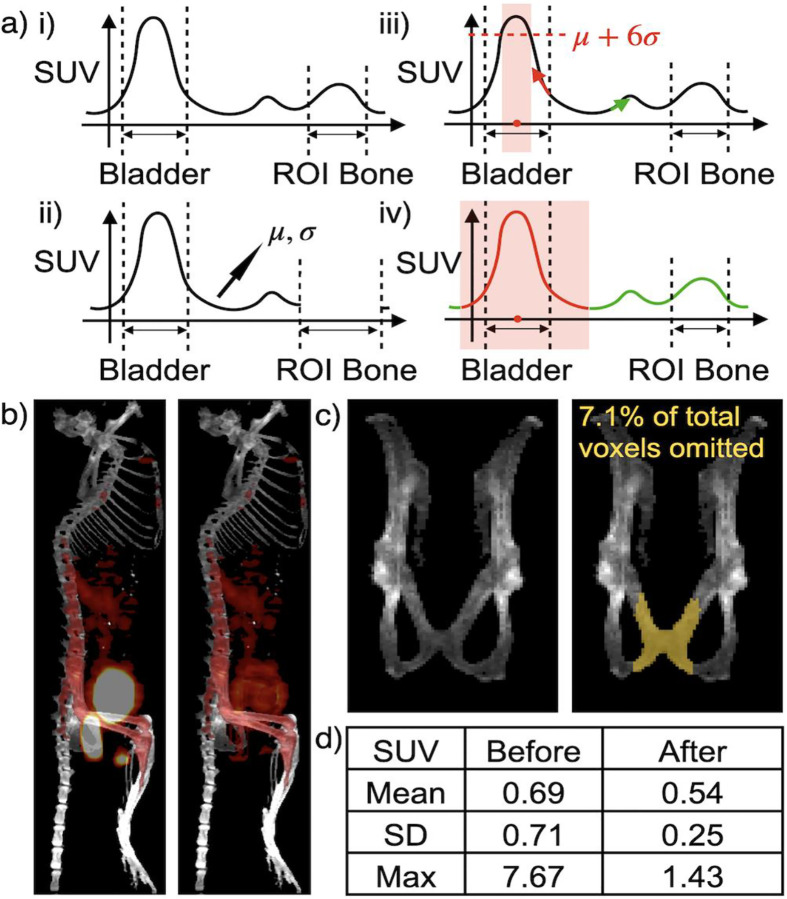 Figure 5
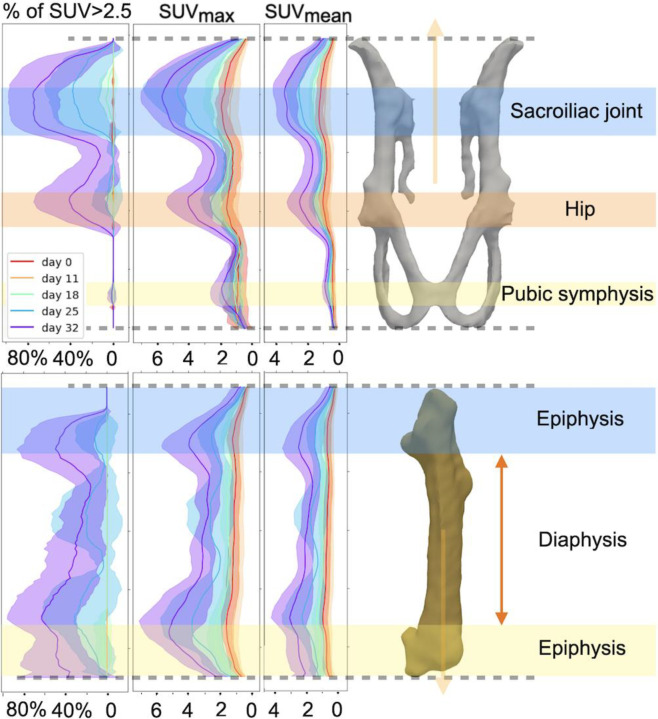 Figure 6
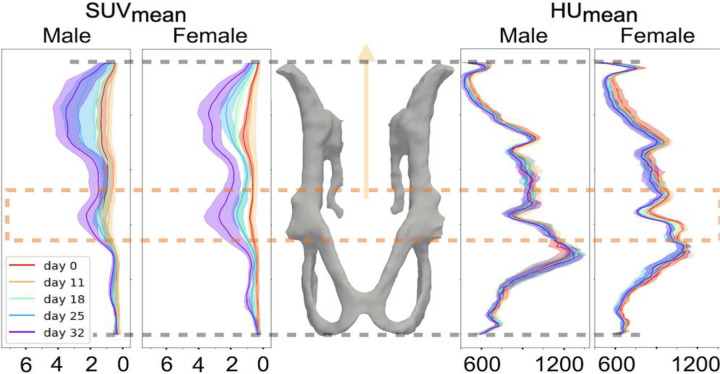 Figure 7
Peer Reviews
No public reviews on file for this paper yet. If you reviewed it on a platform where reviews are public (OpenReview, ICLR, NeurIPS, ICML), you can paste yours below so the community can read it here.
Videos
No videos yet. Explain this paper in a talk, walkthrough, or lecture? Add one.
Taxonomy
TopicsMultiple Myeloma Research and Treatments · Protein Degradation and Inhibitors · Chemokine receptors and signaling
Introduction.
Cancers involving the bone marrow such as multiple myeloma (MM) are characterized by complex biology, spatial and clonal heterogeneity and frequent relapse. Radiology plays an integral role in MM, preclinically and clinically. Fluorodeoxyglucose (^18^F-FDG) PET/CT is recommended by the International Myeloma Working Group (IMWG) to assess treatment response and detect residual disease in MM, where PET scans help to evaluate lesions, while CT is useful in evaluating lytic bone lesions and fractures [1–3]. More recently, molecularly targeted PET agents such as radiolabeled anti-CD38 antibodies have also been used in preclinical and clinical research settings to evaluate MM progression and treatment responses, while new tracers are under development for potential use in patients [4–7].
Given the complexity of MM as a disease, there is a need for standardized, consistent, and accurate quantification methodologies for evaluating myeloma across time and across mouse models. Temporal (i.e., same subject imaged over time) quantification is limited by three major factors: (1) MM exhibits characteristics of both liquid and solid cancers, presenting as focal, diffuse, or mixed patterns. As such, many lesions do not have clear boundaries, unlike most subcutaneous tumors, which makes repeatable and accurate tumor measurements over PET based boundary difficult. (2) Excretory artifacts from accumulation in urine and feces can affect true tumor signal and frequently change between scans over time. (3) Differences in subject positioning between scans make appropriate registration of features across time, particularly appendages, exceptionally difficult.
Traditional preclinical image analysis of the tumor burden in the skeleton mainly involves manual segmentation of the anatomy of the tissue of interest (e.g. CT based [8], MRI based [9]), followed by the mask mapped to the PET image for further quantification. However, manual image analysis is prone to inter- and intra- annotator bias [10]. The small size of the mouse skeleton and complex anatomy of regions of particular interest in MM (i.e. the vertebral bodies) adds an additional layer of possible error. These challenges can be addressed with the current advancements in segmentation tools. Despite recent advances in automated segmentation [10–19], currently available models are still limited by inability to differentiate between various bones [10, 11, 17], requires different levels of manual interaction [12, 18, 19], or yields suboptimal segmentation results compared to state-of-the-art methods [13, 17]. For these reasons, we trained our own fully automated segmentation model to address the unique pathology of MM.
Once we get the segmentation masks, we can evaluate progressive changes in both standardized uptake value (SUV) and Hounsfield Unit (HU) related metrics in the skeleton, including pelvis, across time points. Due to the pelvis’s proximity to the bladder and rectum, it was necessary to distinguish between artifacts from tracer excreted in urine or feces and true disease progression. While pre-imaging strategies can help mitigate some of the undesirable effects of spillover from excretions [20, 21], post-imaging strategies during analysis are also useful adjuncts and independently valuable for workflow and reducing variables in the experimental design. Therefore, here we propose an automatic post-imaging processing algorithm based on PET.
Longitudinal analysis in MM is useful for evaluating treatment response and serves as a powerful research tool to study the development of myelomatous lesions across different regions. Because of differences in subject positioning between scans, the first step in developing a useful longitudinal analysis tool is to align the region of interest (ROI) across the time points of interest. Recent advancements in non-rigid registration can align the ROI by adjusting the positions of voxels [22, 23]. However, it is difficult to verify whether these positional changes preserve the true relative positions of the signals [24]. To align bones while preserving voxel positions, we assume that the shape of the bones remains constant over time in MM. We then apply principal component analysis (PCA) to find a vector aligned with the direction of the bone. This vector enables us to consistently section the bones into uniform slices, facilitating comparisons across different time points. Metrics such as mean, maximum, percentage of voxels exceeding a threshold, and standard deviation for both PET and CT signals can then be collected and compared longitudinally with appropriate statistical methods. Using this approach, we demonstrate that the areas of high and progressive tracer uptake are observed over the ROIs. The full pipeline we proposed here is described in Fig. 1.
In the proof-of-principle study described here, we applied this new tool to evaluate the differences in the progression of MM in immunocompetent male and female mice bearing disseminated tumors (Fig. 2; Supplementary Fig. S1).
Methods.
Defining the Regions of Interest (ROIs).
In this study, we focused on MM lesions that developed in the spine, pelvis & pelvic joints (PPJ), and bilateral femurs (Fig. 3) (Details in the Supplementary File).
Segmentation.
Model Structure.
For building our segmentation model, we employed Attention U-Net [25] to segment on each 2D CT slice. As shown in Supplementary Fig. S2, Attention U-Net is a variant of U-Net that incorporates learnable attention gates into the skip connections. These gates act as filters, enhancing relevant feature details for improved segmentation while suppressing less informative signals. The output feature of the shallowest attention gate is shown in Supplementary Fig. S3.
Positional Encoding.
Since we trained our model using 2D sagittal CT views, the slices lacked visual clues for differentiating between the left and right femurs. Therefore, we introduced the same fixed positional encoding as previously used in [26] to encode the relative slice position provided by the 3D mouse CT. This positional encoding vector is concatenated to the final feature layer of the U-Net before an extra convolutional layer, which maps the learned features to the desired classification map.
Size of Datasets.
We have 52 labeled 3D CT data for mice scanned under two different energy levels, 60 kvp (n=24) and 80 kvp (n=28), respectively. In Table 1, we report how our training set, validation set, and test set are constructed. More implementation details and ablation study results are provided in the Supplementary Fig. S1, Supplementary Fig. S2, and Supplementary Table S1.
Removal of spillover PET signal from SUV quantification of ROIs.
As we analyzed the statistical metrics for PPJ, we occasionally observed massive fluctuations in values over time. Upon further inspection, we identified these fluctuations as false positives caused by spillover signals from mouse urine and feces. Radiotracer accumulation in these excretions often results in elevated SUV around the bladder and colon, leading to false positives. While these artifacts can be identified based on anatomical location, signal spillover into adjacent structures can hinder accurate assessment of critical pelvic regions.
To address this, we propose an algorithm for removing spillover regions with elevated SUV. We demonstrate it in 1D in Fig. 4(a) for illustrative purposes, while the algorithm is inherently designed in 3D. As shown, we first identified regions of abnormally high SUV outside the primary ROIs using a standard deviation-based threshold. Next, we computed the geometric center of each high-SUV region and evaluated the SUV gradient for voxels in the surrounding area. Voxels with gradients oriented toward the region center - rather than away from it - were presumed to be affected by spillover from extreme SUV sources such as the bladder or feces. These voxels were then excluded from downstream analyses to avoid contamination by false-positive signals. Visual result before and after the removal in Fig. 4(b). Fig. 4(c–d) illustrates how the statistical metrics for the same pelvic region can vary with or without the effects of inflated SUV regions. Additional visual results of the extreme region removal from different views are provided in Supplementary Fig. S4.
Localize SUV changes with projection.
In longitudinal studies of MM, we are not only interested in how SUV and HU values change across the entire ROI, but also how these changes correspond to functional or anatomic regions of interest that may provide pathophysiologic insight. Assuming the bone’s shape remains relatively stable over time, we apply PCA to its 3D coordinates to identify the primary anatomical axis. The first principal component, which captures the greatest variance in the data, serves as an estimate of the bone’s longitudinal direction. We can then numerically slice the bone of interest into slices that are perpendicular to the vector, and compute metrics such as mean, std dev and max for each of the slices and plot them along the long axis of the bone. By doing so, we can track signal’s change with respect to their relative location along the bone. To validate this, we first showed in Supplementary Fig. S5 that, given a mouse’s ROI, the computed vector aligns well visually with the long axis. We note that because the spine is curved and can change shape due to different positioning of the mouse, the long-axis PCA found is not meaningful. Therefore, we did not apply our method to the spine. We then demonstrated that the slicing is consistent across different PET/CT scans for the same mouse by computing the voxel count of each slice (Supplementary Fig. S6). The plot of overlapping slice voxel counts for different scans of the same mouse demonstrates that both the long-axis identification and the subsequent slicing are consistent across different PET/CT scans over time.
5TGM1/KaLwRij immunocompetent mouse model.
We used the syngenetic, immunocompetent, disseminated 5TGM1/KaLwRij MM mouse model [27] to evaluate the progression of MM. All mouse experiments were performed in compliance with protocols approved by the Washington University Animal Welfare Committee. All preclinical methods are reported in accordance with ARRIVE guidelines (see Supplementary File).
Radiolabeling, Small Animal PET Imaging and manual PET ROIs.
The mice were imaged longitudinally with ^64^Cu-LLP2A/PET [6] weekly for 5 weeks; details provided in Supplementary File. Each mouse served as its own control. That is, mice were imaged prior to tumor injection (week 0) and then once over 4 weeks (once/week) (See Fig. 2).
Statistical Analysis.
We employed t-tests to investigate MM progression between male and female mice by evaluating changes in SUV and HU metrics from baseline values at different time points. Our proposed projection tool allows us to compare these changes not only across the whole bone but also in selected areas.
RESULTS.
Evaluation of the segmentation model.
To evaluate the performance of the segmentation model, we computed the DICE and mIoU score between the 3D predicted mask and the manual labeled mask for 13 mice (80 kvp n=7, 60 kvp n=6) that were put aside during training or validation phase. The average inference time for each mouse is 24.8 s ± 2.6 with a NVIDIA RTX A6000 GPU. Since mice in the longitudinal analysis study were imaged under 80 kvp, we report the performance of the segmentation model on 80 kvp test data in Table 2. In the appendix, we report test performance on 60 kvp mice and present the results of ablation studies comparing different training sets and segmentation models. We showed how a larger training set where we mixed CT taken under different energy levels improved the model’s performance, and how attention gate improved the standard deviation of the test set performance.
Removal of spillover PET signal from SUV quantification of ROIs.
We evaluated the removal results visually, as shown in Fig. 4(b) and Supplementary Fig. S4. Although this removal algorithm requires more rigorous validation in the future, it allows us to inspect the PPJ area more effectively and obtain a more accurate estimation of SUV changes within the PPJ. Fig. 4(c–d) demonstrate that spillover signals from urine and feces can significantly alter statistical metrics, even when they affect a small portion (7.1% of the volume) of the PPJ.
Longitudinal Data Analysis.
Fig. 5 shows how SUV_max_, SUV_mean_, and the voxel count of SUV > 2.5 change along the long axis over time for the PPJ and left femur. We observed that the locations where lesions tend to reside correlate with the joint locations. Similar analyses for the right femur, sacrum, and the combination of PPJ and sacrum are provided in Supplementary Fig. S7.
Due to differences in pelvic structure and bone density between male and female mice (see Supplementary Fig. S8), we also reported how SUV and HU values change locally by sex in Fig. 6. We observed that females tend to experience more bone loss in the acetabular segment of the PPJ (including the acetabulum and femoral head). This is validated using t-test as described later.
Statistics.
In Supplementary Fig. S9, we present our results comparing the distribution of SUV metrics with biological sex as a variable. Statistical analysis was performed after applying the extreme SUV mask for excretory tracer. Initially, we conducted a t-test for the whole bone. The t-test results for changes in SUV metrics from baseline for females and males at day 18 are reported in Table 3. As shown, female mice exhibit more changes from baseline for several SUV metrics within all the traced ROIs. A full set of results for all time points can be found in the Supplementary Table S2.
We then conducted a t-test for specific ROIs, as shown in Fig. 6. We manually selected the slices representing the acetabular segment of the PPJ, computed the aggregated metrics over the whole region, and then performed the t-test. The t-test results for changes in PET/CT signals from baseline for females and males are reported in Table 4. These results indicate more aggressive increases in SUV metrics at day 18 and more bone loss at days 25 and 32 in females over the defined area.
Discussion.
Our segmentation model provides consistent and rapid labeling of regions of interest in seconds, significantly reducing the manual processing time. The extreme SUV region removal algorithm enables us to explore previously inaccessible changes in the pelvis. Consistent segmentation results also allow for the application of PCA to ascertain the long axis of linear bones, such as the femur and pelvis. This analysis reveals untapped information on the spatial localization and organotropism trends exhibited by MM tumor cells.
Applying the proposed pipeline to a longitudinal preclinical PET/CT study demonstrated that osseous progression of MM in our model is influenced by the sex of the mouse. We observed a faster increase in PET signals (SUV) in female mice at earlier stages (day 18 post-tumor inoculation) and bone loss in the hip area at later time points (days 25 and 32). Tumor lesions exhibited a preference for certain areas aligned with joints. This granular data makes it feasible to investigate the progression of lesions in anatomical detail, offering significant insights into the role of the bone microenvironment and location-related weight-bearing patterns in MM, with an emphasis on the pelvis as a crucial contributor. It also provides valuable insights into tumor aggressiveness and local sex differences.
This study is limited by a small sample size, necessitating larger experiments for further validation. Motion artifacts around the femur area compromised the temporal analysis of femoral CT features. The projection analysis assumed stable bone shapes over time, which may not apply to all MM cases. Additionally, the application of PCA-generated linear projections is limited to linear bones. Curvier structures, such as the spine, lack meaningful biological interpretation with linear projections. We also excluded some bones, such as the skull, upper extremities, and cervical vertebrae. Future studies will be designed to overcome these limitations and will focus on extracting disease-specific radiomic features as well as developing prediction metrics for prognosis and treatment planning.
Conclusion.
To quantify and compare multiple preclinical PET/CT scans, we developed a quantification pipeline that includes the following components: a deep learning based CT-guided bone segmentation model, an algorithm to mask potentially affected areas around the bladder and rectum to avoid false positives, and a projection-based aggregated analysis tool to temporally track PET/CT signal changes in myeloma-prone, bone marrow-rich skeletal sites. This pipeline allowed us to conveniently track SUV and HU signal changes over different regions of interest, including the pelvis, with detailed spatial information. In our proof-of-principle application, we observed a faster increase in PET signals (SUV) in all traced ROIs for female mice at earlier stages (day 18 post-tumor inoculation) and more bone loss in the hip area for females at later time points (days 25 and 32). Additionally, tumor lesions exhibited a preference for certain areas aligned with joints.
Supplementary Files
This is a list of supplementary les associated with this preprint. Click to download.
The reference list from the paper itself. Each links out to its DOI / PubMed record.
- 1Zamagni E, Nanni C, Dozza L, Carlier T, Bailly C, Tacchetti P, Standardization of 18F-FDG–PET/CT According to Deauville Criteria for Metabolic Complete Response Definition in Newly Diagnosed Multiple Myeloma. Journal of Clinical Oncology. 2021;39:116–25. doi:10.1200/jco.20.00386.33151787 · doi ↗ · pubmed ↗
- 2Healy CF, Murray JG, Eustace SJ, Madewell J, O′Gorman PJ, O′Sullivan P. Multiple Myeloma: A Review of Imaging Features and Radiological Techniques. Bone Marrow Research. 2011;2011:583439. doi:10.1155/2011/583439.22046568 PMC 3200072 · doi ↗ · pubmed ↗
- 3Jamet B, Zamagni E, Nanni C, Bailly C, Carlier T, Touzeau C, Functional Imaging for Therapeutic Assessment and Minimal Residual Disease Detection in Multiple Myeloma. International Journal of Molecular Sciences. 2020;21:5406.32751375 10.3390/ijms 21155406 PMC 7432032 · doi ↗ · pubmed ↗
- 4Ghai A, Maji D, Cho N, Chanswangphuwana C, Rettig M, Shen D, Preclinical Development of CD 38-Targeted [89Zr]Zr-DFO-Daratumumab for Imaging Multiple Myeloma. Journal of Nuclear Medicine. 2018;59:216–22. doi:10.2967/jnumed.117.196063.29025987 PMC 5807532 · doi ↗ · pubmed ↗
- 5Ulaner GA, Sobol NB, O’Donoghue JA, Kirov AS, Riedl CC, Min R, CD 38-targeted immuno-PET of multiple myeloma: From xenograft models to first-in-human imaging. Radiology. 2020;295:606–15. doi:10.1148/radiol.2020192621.32255416 PMC 7263286 · doi ↗ · pubmed ↗
- 6Laforest R, Ghai A, Fraum TJ, Oyama R, Frye J, Kaemmerer H, First-in-Humans Evaluation of Safety and Dosimetry of 64Cu-LLP 2A for PET Imaging. Journal of Nuclear Medicine. 2023;64:320–8. doi:10.2967/jnumed.122.264349.36008121 PMC 9902845 · doi ↗ · pubmed ↗
- 7Lapa C, Schreder M, Schirbel A, Samnick S, Kortüm KM, Herrmann K, [(68)Ga]Pentixafor-PET/CT for imaging of chemokine receptor CXCR 4 expression in multiple myeloma - Comparison to [(18)F]FDG and laboratory values. Theranostics. 2017;7:205–12. doi:10.7150/thno.16576.28042328 PMC 5196897 · doi ↗ · pubmed ↗
- 8Beck M, Sanders JC, Ritt P, Reinfelder J, Kuwert T. Longitudinal analysis of bone metabolism using SPECT/CT and 99m Tc-diphosphono-propanedicarboxylic acid: comparison of visual and quantitative analysis. EJNMMI Research. 2016;6:60. doi:10.1186/s 13550-016-0217-4.27464623 PMC 4963336 · doi ↗ · pubmed ↗