Correction: The complexity of measuring reliability in learning tasks: An illustration using the Alternating Serial Reaction Time Task
Bence C. Farkas, Attila Krajcsi, Karolina Janacsek, Dezso Nemeth

Abstract
Click any figure to enlarge with its caption.
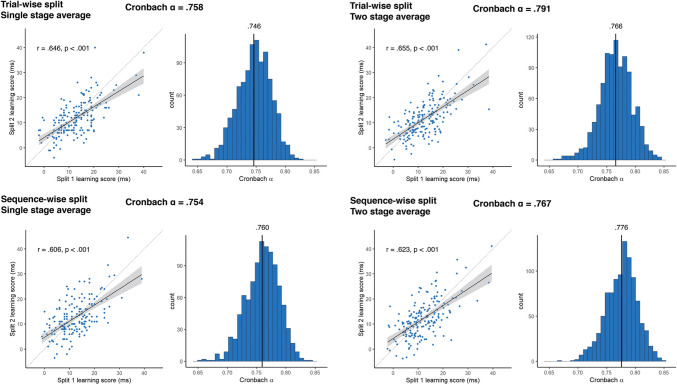 Figure 1
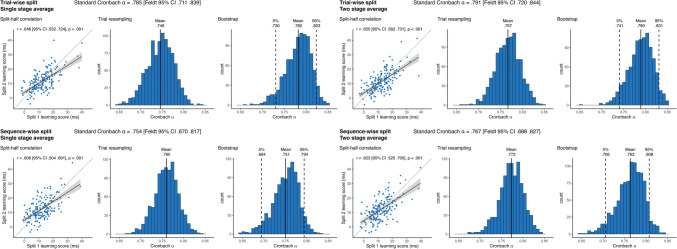 Figure 2
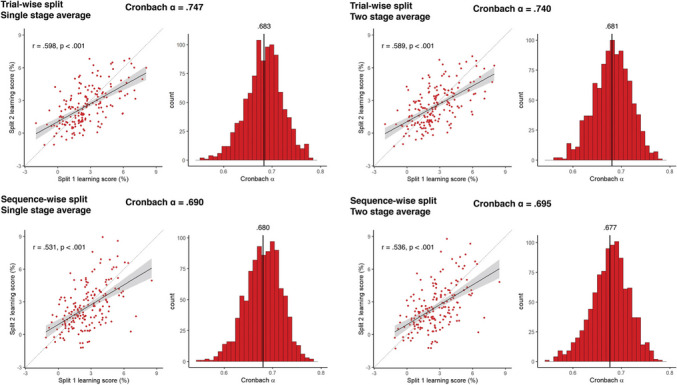 Figure 3
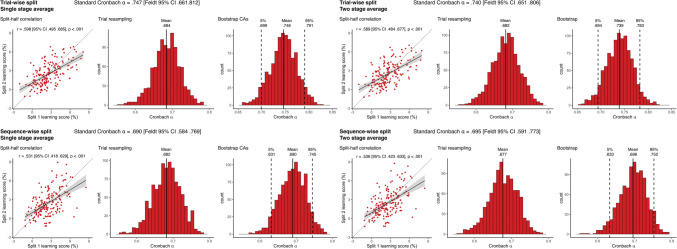 Figure 4
Peer Reviews
No public reviews on file for this paper yet. If you reviewed it on a platform where reviews are public (OpenReview, ICLR, NeurIPS, ICML), you can paste yours below so the community can read it here.
Videos
No videos yet. Explain this paper in a talk, walkthrough, or lecture? Add one.
Taxonomy
TopicsQuality and Safety in Healthcare · Software Reliability and Analysis Research · Multi-Criteria Decision Making
Correction: Behavior Research Methods (2023) 56:301–317
10.3758/s13428-022-02038-5
The original online version of this article was revised: Figures 2 and 3 did not correspond to what was originally intended. The updated figures contain confidence intervals and bootstrap histograms. No changes were made to figure legends.
Incorrect Figure 2 Fig. 2. Reliability metrics for RT-derived learning scores. The four panels show the results of the four methods of reliability calculation that differ in pre-processing choices. In each panel, the Cronbach alpha on top of each panel shows the obtained alpha from the simple sequential assignment of trials, and its 95% CI calculated with Feldt's procedure. Scatterplots show learning scores the raw correlation between learning scores for the two splits, with one dot corresponding to one subject. Learning scores are in units of differences in reaction times for the two triplet types. The trendline shows linear fit, bands correspond to 95% CI. The dashed line shows the identity line. We also indicate the split-half Pearson's correlation and its p value, as well as 95% CI. Histograms show the results of the two permutation analyses, on the left, the distribution of Cronbach alphas resulting from trial resampling along with its mean, on the right, the bootstrapped distribution of Cronbach alphas, along with its mean, and the bootstrapped 95% CI values
Correct Figure 2 Fig. 2. Reliability metrics for RT-derived learning scores. The four panels show the results of the four methods of reliability calculation that differ in pre-processing choices. In each panel, the Cronbach alpha on top of each panel shows the obtained alpha from the simple sequential assignment of trials, and its 95% CI calculated with Feldt's procedure. Scatterplots show learning scores the raw correlation between learning scores for the two splits, with one dot corresponding to one subject. Learning scores are in units of differences in reaction times for the two triplet types. The trendline shows linear fit, bands correspond to 95% CI. The dashed line shows the identity line. We also indicate the split-half Pearson's correlation and its p value, as well as 95% CI. Histograms show the results of the two permutation analyses, on the left, the distribution of Cronbach alphas resulting from trial resampling along with its mean, on the right, the bootstrapped distribution of Cronbach alphas, along with its mean, and the bootstrapped 95% CI values
Incorrect Figure 3 Fig. 3. Reliability metrics for accuracy-derived learning scores. The four panels show the results of the four methods of reliability calculation that differ in pre-processing choices. In each panel the Cronbach alpha on top of each panel shows the obtained alpha from the simple sequential assignment of trials, and its 95% CI calculated with Feldt's procedure. Scatterplots show learning scores the raw correlation between learning scores for the two splits, one dot corresponding to one subject. Learning scores are in units of differences in reaction times for the two triplet types. The trendline shows linear fit, bands correspond to 95% CI. The dashed line shows the identity line. We also indicate the split-half Pearson's correlation and its p value, as well as 95% CI. Histograms show the results of the two permutation analyses, on the left, the distribution of Cronbach alphas resulting from trial resampling along with its mean, on the right, the bootstrapped distribution of Cronbach alphas, along with its mean, and the bootstrapped 95% CI values
Correct Figure 3 Fig. 3. Reliability metrics for accuracy-derived learning scores. The four panels show the results of the four methods of reliability calculation that differ in pre-processing choices. In each panel the Cronbach alpha on top of each panel shows the obtained alpha from the simple sequential assignment of trials, and its 95% CI calculated with Feldt's procedure. Scatterplots show learning scores the raw correlation between learning scores for the two splits, one dot corresponding to one subject. Learning scores are in units of differences in reaction times for the two triplet types. The trendline shows linear fit, bands correspond to 95% CI. The dashed line shows the identity line. We also indicate the split-half Pearson's correlation and its p value, as well as 95% CI. Histograms show the results of the two permutation analyses, on the left, the distribution of Cronbach alphas resulting from trial resampling along with its mean, on the right, the bootstrapped distribution of Cronbach alphas, along with its mean, and the bootstrapped 95% CI values