Gut-associated metabolites and diabetes pathology: a systematic review
Katelyn L. Gough, Samantha J. Dando, Stephanie L. Teasdale, Beatrix Feigl, Flavia Huygens, Elise S. Pelzer

TL;DR
This paper reviews how gut-related metabolites are linked to different types of diabetes, highlighting gaps in current research and sample type inconsistencies.
Contribution
The study systematically identifies gut metabolites associated with diabetes and highlights the lack of research on gestational and type 1 diabetes.
Findings
272 metabolites were found to be associated with diabetes, mostly linked to type 2 diabetes.
Most studies focused on type 2 diabetes, with limited research on gestational and type 1 diabetes.
Variability in study results was observed based on the type of biospecimen analyzed (blood, stool, urine).
Abstract
As the global prevalence of diabetes mellitus reaches epidemic proportions, research into new therapeutic targets that address the underlying pathomechanisms of the disease is essential. Recent studies have elucidated the fundamental role of intestinal metabolic pathways in human health and disease processes and yet, the underlying cause of metabolic dysregulation in diabetes is largely unknown. Therefore, this systematic review aimed to identify the intestinal metabolomic profiles associated with gestational diabetes mellitus, type 1 diabetes mellitus, pre-diabetes mellitus, and type 2 diabetes mellitus. A systematic review of databases and grey literature repositories identified primary literature published between 2005 and 2022, that investigated patterns of human- and microbial-derived metabolite concentration in individuals with diabetes. Data extracted from thirty-four eligible…
Genes, proteins, chemicals, diseases, species, mutations and cell lines named across the full text — each resolved to its canonical identifier and authoritative record.
Click any figure to enlarge with its caption.
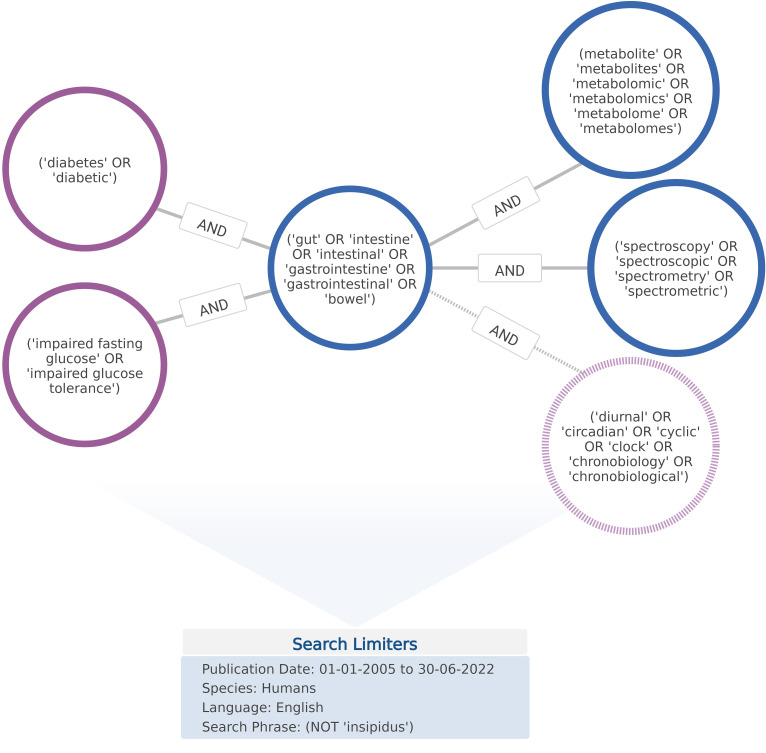 Figure 1
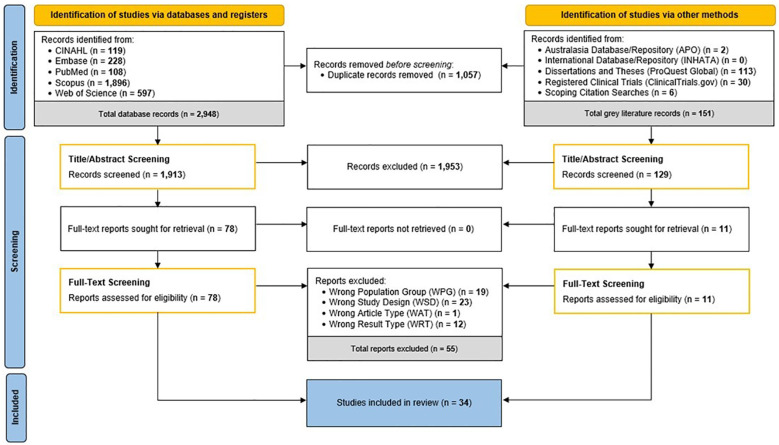 Figure 2
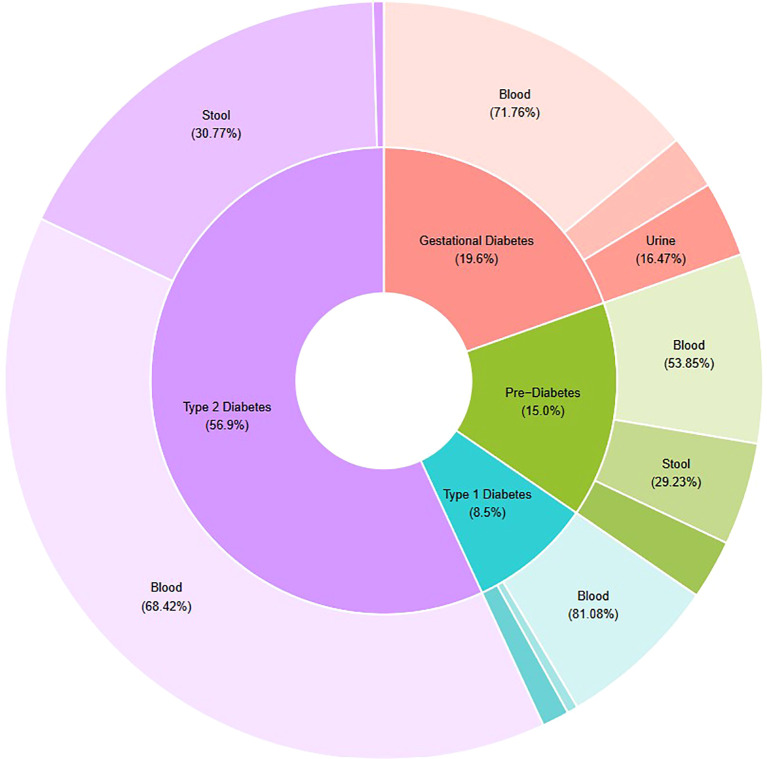 Figure 3
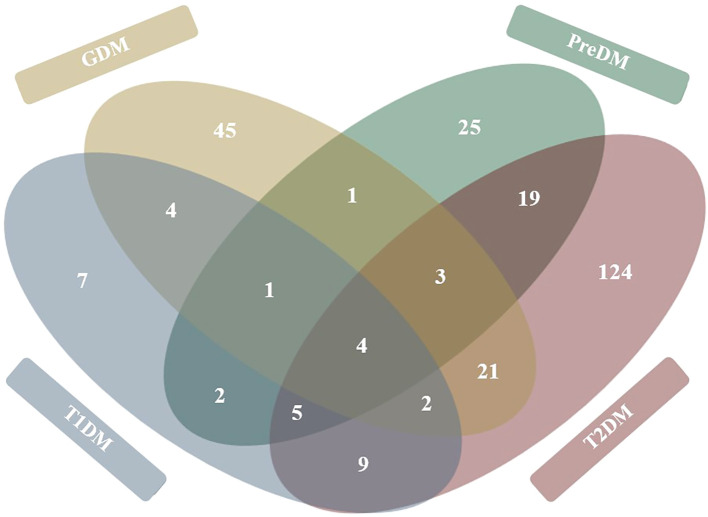 Figure 4
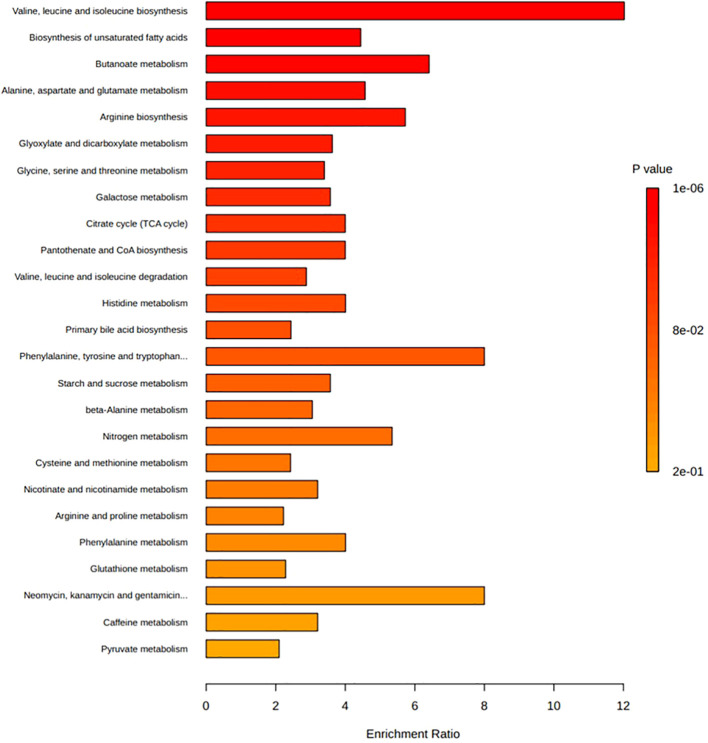 Figure 5
| Study details | Sample | Cohort details and participant criteria | Metabolomic approach | |
|---|---|---|---|---|
| T1DM studies | ||||
| ( | Plasmaa
| Age: 6–11 years. Sex: Mixed (27 female, 22 male). n = 49 (34 T1DM, 15 ND controls) | Untargeted fingerprint analysis (i) LC-MS; HPLC and QTOF with FS, ESI+/- (ii) CE-MS; CE and TOF-MS with FS, ESI+ | |
| ( | Plasmaa,b
| Age: 18–65 years. Sex: Mixed (49 female, 54 male). n = 103 (53 T1DM, 50 ND controls) | Targeted plasma SCFA analysis; LC-MS using HPLC and ion trap MS with SIM, ESI-. Targeted stool SCFA analysis; HPLC-UV | |
| ( | Serum | Age: From 0–36 months (longitudinal). Sex: Mixed (18 female, 15 male). | Untargeted serum profiling; (i) UPLC-MS (lipids), (ii) GC×GC-TOFMS (metabolites). Targeted stool metabolite analysis; (i) U-HPLC with orbitrap MS, ESI+, FS, (ii) Hybrid quadrupole orbitrap MS with ESI+/-, FS | |
| ( | Plasmaa | Age: ~46–72 years. Sex: Mixed (89 female, 122 male). | Targeted analyses; UHPLC MS/MS with ESI+/- and SR | |
| GDM studies | ||||
| ( | Plasmaa | Age: No range defined. Sex: Female only (GDM study), n = 40 (20 GDM, 20 ND pregnant controls) | Untargeted profiling; 1H-NMR spectroscopy | |
| ( | Seruma | Age: ~26–35 years. Sex: Female only (GDM study). n = 52 (24 GDM, 28 ND pregnant controls) | Targeted SCFA analysis; GC-MS with ESI+. Targeted BA, TMAO and TMAO-derivative analyses; UPLC-MS with ESI- and MRM | |
| ( | Seruma,b | Age: ~27–35 years. Sex: Female only (GDM study). n = 269 (131 GDM, 138 ND pregnant controls) | Targeted FFA analysis; UPLC/QTOFMS with ESI+ (FFAs) and UPLC/TQMS with ESI- (BAs). Untargeted profiling; GC/TOFMS with electron impact ionisation and FS | |
| ( | Plasmad | Age: 21–45 years. Sex: Female only (GDM study). | Targeted SCFA analysis; LC-MS/MS using triple-quadrupole MS with ESI+ and MRM | |
| ( | Stoola,b | Age: No range defined. Sex: Female only (GDM study). n = 62 (31 GDM, 31 ND pregnant controls) | Untargeted profiling; 1H-NMR spectral profiling | |
| ( | Plasmaa | Age: 18–44 years. Sex: Female only (GDM study). | Untargeted metabolomic/lipidomic analysis; 1D 1H NMR spectroscopy | |
| ( | Stoola
| Age: ~26–35 years. Sex: Female only (GDM study). n = 107 (59 GDM, 48 pregnant ND controls) | Untargeted analysis; GC-MS | |
| PreDM and T2DM studies | ||||
| ( | Plasmab
| Age: ~35–59 years. Sex: Baseline characteristic not described. n = 51 (12 PreDM, 39 controls) | Untargeted analysis; UPLC-QTOF-MS using reverse-phase UPLC coupled with QTOF-MS in ESI+/- | |
| ( | Plasmaa,b | Age: 25–75 years (4-year longitudinal study). Sex: Mixed (55 female, 51 male). n = 106 | Untargeted analysis; LC–MS/MS with HILIC and RPLC separation, ionisation (+/-) and FS | |
| ( | Plasmab
| Age: 30–60 years. Sex: Mixed (42 female, 60 male). n = 102 (17 PreDM, 50 T2DM, 35 ND controls) | Targeted analysis; HPLC coupled with PDA detector | |
| ( | Plasmab
| Age: ~36–73 years. Sex: Mixed (replication cohort: 321 female, 399 male; case cohort: female only). | Untargeted profiling; (i) UPLC-MS/MS with linear ion-trap and ESI+/-, (ii) GC-MS with electron impact ionisation | |
| ( | Serumb | Age: 39–67 years. Sex: Mixed (~973 female, 985 male). | Targeted ImP analysis; UPLC-MS/MS | |
| ( | Stoola(midstream) | Age: 30–60 years. Sex: Mixed (25 female, 35 male). n = 60 (20 T2DM, 20 PreDM, 20 ND) | Untargeted analyses; UPLC-Q-TOF/MS using orbitrap MS with ESI+/- | |
| ( | Seruma,b | Age: ~57–67 years (7-year follow-up). Sex: Male only. n = 531 | Targeted serum analysis; NMR spectroscopy. Targeted choline pathway analysis; LC-MS/MS with MRM+ | |
| ( | Plasmaa,b | Age: ~50–74 years. Sex: Mixed (174 female, 119 male). n = 293 (114 T2DM, 81 PreDM, 98 ND controls) | Untargeted lipidome analysis; LC-MS/MS using UPLC with QTOF and ESI+/- | |
| T2DM studies | ||||
| ( | Plasmaa,b | Age: ~23–63 years. Sex: Male only. n = 221 (67 T2DM, 106 IR ND controlsc, 48 IS ND controls) | Targeted AA analysis; LC-MS using UHPLC with tandem quadrupole MS | |
| ( | Plasmaa,b | Age: 40–85 years. Sex: Mixed (77 female, 85 male). n = 162 (122 T2DM, 40 ND controls) | Targeted TMAO quantitative analysis; LC-MS/MS with ESI+, MRM | |
| ( | Serumb | Age: ~49–73 years. Sex: Mixed (1,845 female, 695 male). n = 2,540 (case cohort: n=1,018 TwinsUK; replication cohort: n=1,522 ARIC) | Untargeted profiling; (RP)UPLC-MS/MS with ESI+/- and HILIC/UPLC–MS/MS with ESI- | |
| ( | Seruma,b | Age: ~50–66 years. Sex: Mixed (187 female, 179 male). n = 366 (75 T2DM, 277 ND controls) | Combined targeted-untargeted analysis; GC × GC-TOFMS (metabolome) and UHPLC-QTOFMS with ESI+ (lipidome) | |
| ( | Plasma | Age: ~41–69 years. Sex: Mixed (~64 female, 74 male). n = 138 (52 T2DM, 34 IBDc, 52 ND controls) | Targeted lactate analysis; UPLC-MS/MS using RPLC with MRM- | |
| ( | Plasmab | Age: 25–75 years (<8-year follow-up). Sex: Mixed (55 female, 54 male). n = 109 | Untargeted metabolome analysis; LC-MS using RPLC/HILIC with ESI and FS. Untargeted lipidome analysis; DMS with quadrupole ion-trap (Lipidyzer platform). | |
| ( | Plasmab | Age: ~43–65 years. Sex: Mixed (862 female, 1,832 male). n = 2694 (1346 T2DM, 1348 ND controls) | Targeted TMAO analysis; LC-MS/MS using stable isotope dilution LC with online MS/MS | |
| ( | Plasmaa,b
| Age: 55–79 years. Sex: Male only. n = 100 (40 T2DM, 60 ND controls) | Combined targeted and untargeted analysis; Serum - UHPLC/MS/MS2 (Metabolon) and ESI-MS/MS (Biocrates). Plasma - 1H-NMR spectroscopy (Chenomx). | |
| ( | Plasmaa,b | Age: ~37–75 years (5-year follow-up). Sex: Mixed (~712 female, 804 male). | Targeted TMAO analysis; LC-MS/MS; stable isotope dilution LC with online triple quadrupole MS | |
| ( | Stoola (methanol treatment) | Age: 34–63 years. Sex: Male only. n = 75 (25 T2DM, 21 obesec, 29 ND) | Targeted SCFA analysis; 1H-NMR spectroscopy. Targeted BA analysis; LC-MSMS with ESI-, MRM and SIM | |
| ( | Plasmab | Age: 50–64 years (7.4-year follow-up). Sex: Male only. n = 5169 | Untargeted profiling; UHPLC-MS/MS with heated ESI | |
| ( | Stoolb,d | Age: 40–58 years. Sex: Mixed (47 female, 53 male). n = 100 (65 T2DM, 35 ND controls) | Targeted SCFA analysis; GC-MS. Untargeted endogenous metabolite analysis; UPLC-QTOF-MS with ESI +/- | |
| ( | Seruma,b
| Targeted SCFA analysis; Triple quadrupole GC-MS with electron impact, SIM. Targeted BA analysis; UPLC-MS/MS with MRM, ESI- | ||
| ( | Seruma,b
| Age: ~43–69 years. Sex: Mixed (32 female, 58 male). | Targeted SCFA analysis; GC-MS with SIM | |
| ( | Stoola | Age: ~51–68 years. Sex: Mixed (21 female, 29 male). n = 50 (21 T2DM/DRc, 14 T2DM, 15 ND controls) | Untargeted analyses; UHPLC-MS; UHPLC coupled with orbitrap MS | |
| Metabolite | HMBD ID | Association with diabetes disease |
|---|---|---|
| Amino acids, peptides, and analogues | ||
| Aceturic acid | HMDB0000532 | ↓ T2DM blood ( |
| Acetyl-arginine | HMDB0004620 | ↑ T1DM urine ( |
| Acetyl-aspartic acid | HMDB0000812 | ↑ GDM blood ( |
| Acetyl-L-tyrosine | HMDB0000866 | ↑ T2DM stool ( |
| Alanine | HMDB0001310 | ↓ T1DM blood ( |
| Allantoic acid | HMDB0001209 | ↑ GDM stool ( |
| 2-Aminobutanoic acid | HMDB0000650 | ↑ GDM blood ( |
| γ-Aminobutyric acid | HMDB0000112 | ↑ GDM blood ( |
| Aminomalonic acid | HMDB0001147 | ↑ GDM blood ( |
| Arginine | HMDB0303361 | ↓ T2DM blood ( |
| L | HMDB0000191 | ↑ T2DM blood ( |
| Betaine | HMDB0000043 | ↓ GDM blood ( |
| Cinnamoyl glycine | HMDB0011621 | ↓ PreDM blood ( |
| Citrulline | HMDB0000904 | ↓ T2DM blood ( |
| Creatine | HMDB0000064 | ↑ T2DM blood ( |
| Creatinine | HMDB0000562 | ↓ GDM blood ( |
| Cysteine | HMDB0000574 | ↓ GDM blood ( |
| Cysteine-glycine | HMDB0000078 | ↓ GDM urine ( |
| Cystine | HMDB0000192 | ↑ T1DM urine ( |
| N-(4,5-Dihydro-1-methyl-4-oxo-1H-imidazol-2-yl) alanine | HMDB0034912 | ↓ T2DM stool ( |
| Dimethylarginine | HMDB0003334 | ↓ T2DM blood ( |
| Dimethylglycine | HMDB0000092 | ↑ T2DM blood ( |
| Ectoine | HMDB0240650 | ↓ T2DM blood ( |
| Glutamic acid | HMDB0000148^ | ↑ GDM blood ( |
| Glutamine | HMDB0000641 | ↓ GDM urine ( |
| N-γ-L-Glutamyl-D-alanine | HMDB0036301 | ↑ T2DM stool ( |
| γ-Glutamyl-glutamine | HMDB0029147 | ↑ PreDM stool ( |
| γ-Glutamyl-histidine | HMDB0029151 | ↓ T2DM blood ( |
| γ-Glutamyl- isoleucine | HMDB0011170 | ↑ T2DM blood ( |
| Glutamyl-lysine | HMDB0004207 | ↑ T2DM stool ( |
| Glutamyl-valine | HMDB0028832 | ↑ T2DM blood ( |
| Glycine | HMDB0000123 | ↓ GDM urine ( |
| Glycyl-histidine | HMDB0028843 | ↑ T2DM stool ( |
| Histidine | HMDB0000177 | ↓ T2DM blood ( |
| Homocitrulline | HMDB0000679 | ↑ T1DM blood ( |
| Homocysteine | HMDB0000742 | ↑ GDM stool ( |
| Leucine & Isoleucinea | HMDB0000687 | ↓ T1DM blood ( |
| Lysine | HMDB0000182 | ↑ T1DM urine ( |
| 3-Methoxytyrosine | HMDB0001434 | ↑ GDM urine ( |
| Methionine | HMDB0000696 | ↓ PreDM blood ( |
| N-Methyl-glutamic acid | HMDB0062660 | ↓ GDM urine ( |
| N-Methyl-proline | HMDB0094696 | ↓ T2DM blood ( |
| Noropthalmic acid | HMDB0005766 | ↓ T2DM stool ( |
| Phenylacetylglutamine | HMDB0006344 | ↓ PreDM urine ( |
| Phenylalanine | HMDB0000159 | ↓ T1DM blood ( |
| Proline | HMDB0000162 | ↓ GDM blood ( |
| Proline betaine | HMDB0004827 | ↓ T2DM blood ( |
| Trimethyllysine | HMDB0001325 | ↓ T2DM blood ( |
| Tyrosine | HMDB0000158 | ↓ T1DM blood ( |
| Valine | HMDB0000883 | ↑ T1DM blood ( |
| Azoles | ||
| Imidazole propionate | HMDB0002271 | ↑ PreDM blood ( |
| Benzoic acids and derivatives | ||
| 2-(Ethylamino)-4,5-dihydroxybenzamide | HMDB0032852 | ↓ T2DM stool ( |
| Gentisic acid | HMDB0000152 | ↓ T2DM stool ( |
| Hippuric acid | HMDB0000714 | ↓ PreDM blood ( |
| (4-Hydroxybenzoyl)choline | HMDB0029559 | ↓ T2DM stool ( |
| 3-Hydroxyhippuric acid | HMDB0006116 | ↓ PreDM urine ( |
| Salicyluric acid | HMDB0000840 | ↑ T2DM blood ( |
| Benzopyrans | ||
| 3'-Deaminofusarochromanone | HMDB0041328 | ↓ T2DM stool ( |
| Bi- and oligothiophenes | ||
| 5-(1-Propynyl)-5'-vinyl-2,2'-bithiophene | HMDB0038430 | ↓ T2DM stool ( |
| Carbohydrates and carbohydrate conjugates | ||
| N-Acetylgalactosamine-4-sulphate | HMDB0000781 | ↓ GDM stool ( |
| N-Acetyl-D-glucosamine | HMDB0000215 | ↑ T2DM blood ( |
| N-Acetylhexosamine | HMDB0248228 | ↑ T2DM blood ( |
| 1,5-Anhydroglucitol | HMDB0002712 | ↓ T2DM blood ( |
| Arabinose | HMDB0000646 | ↑ T2DM blood ( |
| Ethyl glucuronide | HMDB10325 | ↑ T2DM blood ( |
| Erythritol | HMDB02994 | ↑ PreDM blood ( |
| Fructose | HMDB0000660 | ↑ PreDM blood ( |
| Fucitol | HMDB0304954 | ↓ PreDM blood ( |
| Galactitol | HMDB0000107 | ↓ GDM urine ( |
| D-Galactose | HMDB0000143 | ↑ GDM urine ( |
| Glucose | HMDB0000122 | ↑ GDM urine ( |
| Glucuronic acid | HMDB0000127 | ↑ T2DM blood ( |
| Glycerol | HMDB0000131 | ↓ GDM blood ( |
| Maltose | HMDB0000163 | ↓ GDM blood ( |
| Mannose | HMDB0000169 | ↑ GDM blood ( |
| Threitol | HMDB04136 | ↑ GDM blood ( |
| Threonic acid | HMDB0000943 | ↓ GDM blood ( |
| Trehalose | HMDB0000975 | ↓ GDM urine ( |
| Carboxylic acids and derivatives | ||
| Acetic acid | HMDB0000042 | ↓ T1DM blood ( |
| Isobutyric acid | HMDB0001873 | ↓ T2DM stool ( |
| Isocitric acid | HMDB0000193 | ↓ GDM stool ( |
| Methylmalonic acid | HMDB0000202 | ↓ GDM blood ( |
| Propionic acid | HMDB0000237 | ↓ T1DM blood ( |
| Succinic acid | HMDB0000254 | ↓ T2DM stool ( |
| Coumarins and derivatives | ||
| Protorifamycin I | HMDB0039057 | ↑ PreDM stool ( |
| Dihydrofurans | ||
| 2-Methylascorbic acid | HMDB0240294 | ↓ GDM urine ( |
| Dipeptides and hybrid peptides | ||
| Carnosine | HMDB0000033 | ↓ T2DM stool ( |
| Lysyl-Cysteine | 18218224 | ↑ T1DM blood ( |
| Valyl-asparaginyl-alanine | 145458842 | ↑ T1DM blood ( |
| Fatty acids and conjugates | ||
| Adrenic acid | HMDB0002226 | ↑ T1DM blood ( |
| Arachidic acid | HMDB0002212 | ↑ GDM blood ( |
| Arachidonic acid | HMDB0001043 | ↑ GDM blood ( |
| Butyrate | HMDB0000039 | ↓ T2DM stool ( |
| Capric acid | HMDB0000511 | ↑ T2DM blood ( |
| Caproic acid | HMDB0000535 | ↓ T2DM blood ( |
| Citraconic acid | HMDB0000634 | ↓ GDM urine ( |
| 5,6-Dichlorotetradecanoic acid | 101254179 | ↑ PreDM blood ( |
| 10,20-Dihydroxyeicosanoic acid | HMDB0031923 | ↓ PreDM blood ( |
| 9,10-Dihydroxy-12-octadecenoic acid | HMDB0004704 | ↓ T2DM stool ( |
| Docosapentaenoic acid | HMDB0006528 | ↑ GDM blood ( |
| Docosatrienoic acid | HMDB02823 | ↑ GDM blood ( |
| Dodecanoic acid | HMDB0000638 | ↑ GDM blood ( |
| 5-Dodecenoic acid | HMDB0000529 | ↓ T2DM blood ( |
| Eicosadienoic acid | HMDB05060 | ↑ GDM blood ( |
| Eicosapentaenoic acid | HMDB0001999 | ↓ T2DM stool ( |
| Eicosatrienoic acid | HMDB0002925 | ↑ GDM blood ( |
| 2-Ethylhexanoic acid | HMDB0031230 | ↑ GDM blood ( |
| Gondoic acid | HMDB0002231 | ↑ GDM blood ( |
| Heptadecanoic acid | HMDB0002259 | ↑ GDM blood ( |
| Heptadecenoic acid | HMDB60038 | ↓ T2DM blood ( |
| Heptanoic acid | HMDB0000666 | ↓ T2DM blood ( |
| Hexadecadienoic acid | HMDB0302694 | ↑ GDM blood ( |
| Hexadecatrienoic acid | HMDB0302991 | ↑ T2DM blood ( |
| 2-Hydroxyadipic acid | HMDB0000321 | ↑ PreDM stool ( |
| 2-Hydroxydecanoate | HMDB0094656 | ↓ T1DM blood ( |
| Hydroxyisocaproic acid | HMDB0000746 | ↓ T2DM blood ( |
| Hydroxyisovaleric acid | HMDB0000407^ | ↓ T2DM blood ( |
| Hydroxypalmitoleic acid | 46235676^ | ↑ T2DM blood ( |
| Isovaleric acid | HMDB0000718 | ↓ T2DM stool ( |
| Myristic acid | HMDB0000806 | ↓ T2DM blood ( |
| Myristoleic acid | HMDB0002000 | ↓ T2DM blood ( |
| Nonadecenoic acid | HMDB0302287 | ↑ GDM blood ( |
| Octadecanedioic acid | HMDB0000782 | ↑ T2DM blood ( |
| 9-Octadecenoic acid | HMDB62703 | ↑ GDM blood ( |
| Oleic acid | HMDB0000207 | ↑ T1DM blood ( |
| Palmitic acid | HMDB0000220 | ↑ T1DM blood ( |
| Palmitoleic acid | HMDB03229 | ↓ T2DM blood ( |
| Pelargonic acid | HMDB0000847 | ↓ T2DM blood ( |
| Pentadecanoic acid | HMDB0000826 | ↓ T2DM blood ( |
| Stearic acid | HMDB0000827 | ↑ PreDM blood ( |
| Tetradecanedioic acid | HMDB0000872 | ↓ PreDM blood ( |
| 9E-Tetradecenoic acid | HMDB0062248 | ↑ GDM blood ( |
| Tridecanoic acid | HMDB0000910 | ↕ T2DM blood ( |
| Valeric acid | HMDB0000892 | ↓ T2DM blood ( |
| Fatty acid esters | ||
| Acylcarnitine C10:3 | Not Defined | ↑ T2DM slool ( |
| Decanoylcarnitine | HMDB0000651 | ↑ PreDM urine ( |
| Dibutyl decanedioate | HMDB0041220 | ↓ GDM stool ( |
| Glutarylcarnitine | HMDB0013130 | ↑ T2DM blood ( |
| Hexanoylcarnitine | HMDB0000756 | ↑ T2DM blood ( |
| Hydroxybutyrylcarnitine | HMDB0013127 | ↑ PreDM blood ( |
| Methyl hexadecenoic acid | HMDB0061859 | ↓ T2DM blood ( |
| Octanoylcarnitine | HMDB0000791 | ↓ T2DM blood ( |
| Palmitoylcarnitine | HMDB0000222 | ↑ T2DM stool ( |
| Valerylcarnitine | HMDB0013128 | ↓ T2DM blood ( |
| Fatty acyls | ||
| Deoxyglucose | HMDB0062477 | ↑ T2DM blood ( |
| 1-Octen-3-yl glucoside | HMDB0032959 | ↓ T2DM stool ( |
| N-(3-oxooctanoyl)-homoserine lactone | 127293 | ↓ T2DM blood ( |
| Thromboxane B3 | HMDB0005099 | ↓ T2DM stool ( |
| Furanoisoflavonoids | ||
| Cristacarpin | HMDB0034025 | ↑ T2DM stool ( |
| Glycerolipids | ||
| Diacylglycerol | HMDB0242173 | ↑ T2DM stool ( |
| Glyceryl monooleate | HMDB0254854 | ↑ GDM blood ( |
| 1-Myristoylglycerol | HMDB0304951 | ↑ T2DM blood ( |
| 1-Oleoylglycerol | HMDB0011567 | ↑ T2DM blood ( |
| 1-Palmitoleoylglycerol | 9883914 | ↑ T2DM blood ( |
| Triglycerides | HMDB0005356^ | ↓ PreDM blood ( |
| Glycerophospholipids | ||
| Glycerophosphocholine | HMDB0000086 | ↓ T2DM blood ( |
| Linoleoyl lysophosphatidylcholine | HMDB0010386 | ↑ T2DM blood ( |
| Lysophosphatidylcholines | HMDB0010379^ | ↓ T1DM blood ( |
| Lysophosphatidylethanolamines | HMDB0011472^ | ↑ T2DM blood ( |
| Phosphatidylcholine | HMDB0000564^ | ↓ PreDM blood ( |
| Phosphatidylethanolamine | HMDB0060501 | ↑ T1DM blood ( |
| Phosphatidylinositol | HMDB0009783^ | ↑ T2DM blood ( |
| Phosphatidylserine | HMDB0014291 | ↑ PreDM blood ( |
| Hydroxy acids and derivatives | ||
| 2-Hydroxybutyric acid | HMDB0000008 | ↑ T1DM blood ( |
| 3-Hydroxybutyric acid | HMDB0000011 | ↑ T1DM blood ( |
| 3-Hydroxycapric acid | HMDB0002203 | ↓ PreDM blood ( |
| Lactic acida | HMDB0001311 | ↑ T2DM blood ( |
| Malic acid | HMDB0000156 | ↓ GDM stool ( |
| Indoles and derivatives | ||
| β-Carboline | HMDB0012897 | ↓ T2DM stool ( |
| 4-Formylindole | HMDB0341228 | ↓ PreDM blood ( |
| Hydroxyindoleacetate | HMDB0000763 | ↓ GDM stool ( |
| Indole-3-carboxylic acid | HMDB0003320 | ↓ T2DM stool ( |
| Indolelactic acid | HMDB0000671 | ↓ PreDM blood ( |
| Indole propionic acid | HMDB0002302 | ↓ T2DM blood ( |
| Tryptophan | HMDB0000929 | ↓ T1DM blood ( |
| Keto acids and derivatives | ||
| Ketoisocaproic acid | HMDB0000695 | ↑ GDM blood ( |
| Ketoisovaleric acid | HMDB0000019 | ↑ PreDM blood ( |
| 3-Methyl-2-oxovaleric acid | HMDB0000491 | ↑ PreDM blood ( |
| Octenoylcarnitine | HMDB0240723 | ↑ T2DM blood ( |
| Oxoglutaric acid | HMDB0000208 | ↑ T2DM blood ( |
| 2-Oxoisovaleric acid | HMDB0000019 | ↑ T2DM blood ( |
| Pyruvic acid | HMDB00243 | ↑ GDM blood ( |
| Lactones | ||
| Matricin | HMDB0036643 | ↑ PreDM stool ( |
| Lineolic acids and derivatives | ||
| Cucurbic acid | HMDB0029388 | ↑ PreDM stool ( |
| Hydroxylinolenic acid | HMDB0011108 | ↑ T2DM blood ( |
| Linoleic acid | HMDB0000673 | ↑ T1DM blood ( |
| Linolenic acid | HMDB0001388 | ↑ T1DM blood ( |
| γ-Linolenic acid | HMDB0003073 | ↑ GDM blood ( |
| Macrolides and analogues | ||
| Epothilone A | HMDB0251873 | ↑ PreDM stool ( |
| Organic sulfuric acids and derivatives | ||
| Indoxyl sulfate | HMDB0000682 | ↑ T2DM blood ( |
| Methyl-4-hydroxybenzoate sulfate | HMDB0168668 | ↓ PreDM blood ( |
| Organonitrogen compounds | ||
| Choline | HMDB0000097 | ↑ T2DM blood ( |
| Phytosphingosine | HMDB0004610 | ↓ T2DM stool ( |
| Trimethylamine-N-oxide | HMDB0000925 | ↓ GDM blood ( |
| Organooxygen compounds | ||
| Butanone | HMDB0000474 | ↑ GDM stool ( |
| 3-Dehydroshikimate | HMDB0304122 | ↓ GDM urine ( |
| Kynureinine | HMDB0000684 | ↑ T2DM blood ( |
| Methanol | HMDB0001875 | ↓ GDM blood ( |
| Phenols | ||
| Capsaicin | HMDB0002227 | ↓ T2DM stool ( |
| p-Hydroxyfelbamate | HMDB0060669 | ↓ T2DM stool ( |
| Tyrosol | HMDB0004284 | ↓ T2DM stool ( |
| Phenylpropanoic acids | ||
| Hydrocinnamic acid | HMDB0000764 | ↓ T2DM blood ( |
| Hydroxyphenyllactic acid | HMDB0000755 | ↑ T2DM blood ( |
| Prenol lipids | ||
| Anhydrorhodovibrin | 5368308 | ↑ PreDM stool ( |
| ar-Artemisene | HMDB0039155 | ↓ T2DM stool ( |
| Astaxanthin | HMDB0002204 | ↓ T2DM stool ( |
| Dehydrovomifoliol | HMDB0036819 | ↑ PreDM stool ( |
| Galbanic acid | HMDB0030163 | ↓ T1DM blood ( |
| Ginkolide C | HMDB0036860 | ↓ T2DM stool ( |
| Isobornyl propionate | HMDB0038249 | ↓ T2DM stool ( |
| Manoalide | HMDB0254329 | ↑ PreDM stool ( |
| Oleanolic acid | HMDB0002364 | ↓ T2DM stool ( |
| Quassin | HMDB0036587 | ↑ PreDM stool ( |
| Ubiquinone-2 | HMDB0006709 | ↓ T2DM stool ( |
| Purines and purine derivatives | ||
| 7-Methylguanine | HMDB0000897 | ↓ T2DM stool ( |
| 1-Methylhypoxanthine | HMDB0013141 | ↓ T2DM stool ( |
| Methyluric acid | HMDB0003099^ | ↓ PreDM urine ( |
| Methylxanthine | HMDB0010738^ | ↓ PreDM urine ( |
| Uric acid | HMDB0000289 | ↓ PreDM urine ( |
| Xanthine | HMDB0000292 | ↑ PreDM urine ( |
| Purine nucleosides | ||
| Adenosine | HMDB0000050 | ↓ T2DM stool ( |
| N6-Carbamoyl-L-threonyladenosine | HMDB0041623 | ↑ T2DM blood ( |
| N2,N2-Dimethylguanosine | HMDB0004824 | ↑ T2DM blood ( |
| 1-Methyladenosine | HMDB0003331 | ↑ T2DM blood ( |
| Pyridines and derivatives | ||
| N-Methylnicotinamide | HMDB0003152 | ↑ T1DM blood ( |
| Niacinimide | HMDB0001406 | ↓ T2DM stool ( |
| Nicotinic acid | HMDB0001488 | ↓ GDM urine ( |
| Pyrimidine nucleosides | ||
| Cytidine | HMDB0000089 | ↓ T2DM stool ( |
| Pyrimidines and derivatives | ||
| Cytosine | HMDB0000630 | ↓ T2DM stool ( |
| 3-Methylcytosine | HMDB0011601 | ↓ T2DM stool ( |
| Thymine | HMDB0000262 | ↑ T2DM stool ( |
| Uracil | HMDB0000300 | ↓ T2DM stool ( |
| Quinolines and derivatives | ||
| Kynurenic acid | HMDB0000715 | ↓ GDM stool ( |
| Xanthurenic acid | HMDB0000881 | ↑ T2DM blood ( |
| Sphingolipids | ||
| Ceramides | HMDB0004949^ | ↕ T2DM blood ( |
| Sphingomyelin | HMDB12096 | ↓ T1DM stool ( |
| Sphingosine 1-phosphate | HMDB0000277^ | ↑ T2DM blood ( |
| Steroids and steroid derivatives | ||
| 5a-Androstan-3a,17a-diol | HMDB0000458 | ↓ T2DM blood ( |
| Androsterone glucuronide | HMDB0002829 | ↓ T2DM blood ( |
| Androsterone sulfate | HMDB0002759 | ↓ T2DM blood ( |
| Chenodeoxycholic acid | HMDB0000518 | ↓ T2DM stool ( |
| Cholestane-3b-5a,6b-triol | HMDB0003990 | ↑ PreDM stool ( |
| Cholesterol | HMDB0000067 | ↓ T2DM blood ( |
| Cholic acid | HMDB0000619 | ↓ GDM blood ( |
| 7-Dehydrodesmosterol | HMDB0003896 | ↑ PreDM stool ( |
| Dehydroepiandrosterone sulfate | HMDB0001032 | ↓ T2DM blood ( |
| Dehydrolithocholic acid | 5283906 | ↓ GDM blood ( |
| Deoxycholic acid | HMDB0000626 | ↑ T2DM blood ( |
| Deoxycholic acid 3-glucuronide | HMDB0002596 | ↑ T1DM blood ( |
| Dihydroxyvitamin D3 | HMDB0000430 | ↓ T2DM blood ( |
| 6,7-Diketolithocholic acid | 137333800 | ↑ GDM blood ( |
| Estrone glucuronide | HMDB0004483 | ↑ PreDM stool ( |
| Glycochenodeoxycholic acid | HMDB0000637 | ↓ T2DM stool ( |
| Glycocholic acid | HMDB0000138 | ↓ T2DM stool ( |
| Glycodeoxycholic acid | HMDB0000631 | ↓ T2DM stool ( |
| Glycolithocholic acid | HMDB0000698 | ↓ T2DM stool ( |
| Glycoursodeoxycholic acid | HMDB0000708 | ↓ T2DM stool ( |
| Hyodeoxycholic acid | HMDB0000733 | ↑ GDM blood ( |
| Isodeoxycholic acid | HMDB0002536 | ↑ GDM blood ( |
| Lithocholic acid | HMDB0000761 | ↑ GDM blood ( |
| Physalolactone B | HMDB0034200 | ↓ T2DM stool ( |
| Scillaren A | 441870 | ↑ PreDM stool ( |
| Taurochenodeoxycholic acid | HMDB0000951 | ↑ T2DM blood ( |
| Taurodeoxycholic acid | HMDB0000896 | ↓ T2DM stool ( |
| Teasterone | 13475125 | ↑ PreDM stool ( |
| Taurohyodeoxycholic acid | 119046 | ↑ GDM blood ( |
| Tauroursodeoxycholic acid | HMDB0000874 | ↓ T2DM stool ( |
| Taurolithocholate sulfate | HMDB0002580 | ↑ GDM blood ( |
| Taurolithocholic acid | HMDB0000722 | ↓ T2DM stool ( |
| Ursodeoxycholic acid | HMDB0000946 | ↓ T2DM stool ( |
| Stilbenes | ||
| Piceid | HMDB0030564 | ↑ T2DM stool ( |
| Tetrapyrroles and derivatives | ||
| Biliverdin | HMDB0001008 | ↓ T2DM blood ( |
Peer Reviews
No public reviews on file for this paper yet. If you reviewed it on a platform where reviews are public (OpenReview, ICLR, NeurIPS, ICML), you can paste yours below so the community can read it here.
Videos
No videos yet. Explain this paper in a talk, walkthrough, or lecture? Add one.
Taxonomy
TopicsDiet and metabolism studies · Gut microbiota and health · Liver Disease Diagnosis and Treatment
Introduction
The metabolites produced by enterocytes and commensal gut microbes directly regulate host immune responses and have the potential to contribute to metabolic inflammation (1). In healthy individuals, the metabolites contributed by eubiotic gut microbiota confer a plethora of benefits to the host, including nutrient synthesis and metabolism, inhibition of pathogen colonisation, regulation of host gene expression and metabolism, and regulation of the gut-immune axis (2–5). In contrast, the metabolites contributed by the dysbiotic gut microbiota promote pathogen colonisation and virulence, and dysregulate host physiology through modulation of intestinal mechanics and disturbed immune homeostasis (6). Through a multifaceted process of immunological crosstalk, the microbial metabolites released by dysbiotic microbiota act as immune-modulators that alter intestinal immune function and regulate the niches of microbe colonisation in the intestine; thereby creating conditions that favour the stabilisation of the dysbiotic configuration and inflammatory milieu (7, 8). It is therefore not surprising that an increasing volume of literature has implicated the metabolome of the gut microbiota in the development of diabetes and a range of metabolic disorders (9, 10).
However, discrepancies exist with respect to identifying the core diabetes-associated metabolites, and whether these metabolites help or hinder diabetic aetiology (11–13). Additionally, much of the current metabolomics research targets processes specific to type 2 diabetes mellitus (T2DM) only, given that T2DM accounts for approximately 90% of all diabetes diagnoses (4, 14–16). Therefore, research that also profiles the microbial and metabolomic profiles in individuals with gestational diabetes mellitus (GDM), and type 1 diabetes mellitus (T1DM) conditions is urgently needed to improve our understanding of diabetes pathophysiology.
To date, no systematic review has synthesised published intestinal metabolomic signature data encompassing all types of DM. In addressing this, we conducted this systematic review to collate, and recapitulate the main findings of studies that have investigated intestinal metabolite profiles in the context of GDM, T1DM, prediabetes (PreDM), and T2DM conditions. Furthermore, this review analysed the effect of study methods on metabolomic findings, by reviewing study findings in light of the collection techniques, and downstream analysis tools employed by researchers. This review ultimately aimed to synthesise and critically review existing literature so future diabetes research can be directed to the identification of pathophysiologically important metabolite markers.
Methods
Systematic review protocol
This systematic review was conducted in accordance with the core methods and processes outlined by the Preferred Reporting Items for Systematic Review and Meta-Analyses (PRISMA) 2020 Statement and the Cochrane Collaboration Handbook for Systematic Reviews of Interventions (17, 18).
Eligibility criteria
This review included primary research that profiled the concentration of human- and microbial-derived metabolites in human cohorts with DM. Articles were not excluded based on the type of diabetes disease reported (PreDM, T1DM, T2DM, or GDM); provided the study only characterised the gut in a human population. Studies that characterised the gut metabolome of animals were excluded, based on the established anatomical, metabolic, and physiological differences between animal and human models (19–21).
Articles that were published over a seventeen-year period were screened (January 1, 2005, to June 30, 2022). This search period ensured research published prior to, and over the course of, the National Institutes of Health Human Microbiome Project (2007-2016) was screened for inclusion (22). Additionally, this commencement date correlates with the establishment of the HMDB and METLIN databases; the first standardised repositories of metabolomic data (23, 24). To ensure this review investigated the gut metabolome as the independent variable in the context of diabetes disease, only studies that reported on gut-associated metabolites were eligible for inclusion. That is, (i) metabolites that are utilised or produced as either intermediate or end-products of metabolic processes by human enterocytes or intestinal microbiota, (ii) reported in HMDB as originating from an intestinal biological location (whether directly from the intestinal organ, or from non-excretory fluid of faeces), or (iii) cited in existing literature as having a direct link with the gastrointestinal system. Only primary research literature was included for review; therefore, meta-analyses, review articles, systematic reviews, and commentaries were excluded, in addition to those that implemented an intervention (dietary, surgical, lifestyle) as part of the experimental methods. Similarly, only articles that were published (or translated for publication) in English were considered for inclusion in this systematic review.
Information sources and database searches
Five electronic white literature databases were accessed for article screening; namely PubMed, Scopus, Excerpta Medica database (EMBASE), Web of Science, and the Cumulative Index to Nursing and Allied Health Literature (CINAHL). To ensure a comprehensive review of all existing primary literature was conducted, four grey literature databases were also consulted, spanning both National and International literature repositories; namely ProQuest Dissertations and Theses Global, Analysis and Policy Observatory (APO), Clinical trials.gov, and the International Network of Agencies for Health Technology Assessment Database (INAHTA).
Databases were searched using key search terms included in the National Library of Medicine’s (NLM) Medical Subject Headings (MeSH) Index. In doing so, searches exploited current indexing in databases such as PubMed, ClinicalTrials.gov, and Embase that are modelled on, or indexed according to, MeSH classifications. As depicted in Figure 1, search strings were compiled from combinations of five main groups of search terms; (‘diabetes’ or ‘diabetic’); (‘impaired fasting glucose’ or ‘impaired glucose tolerance’); (‘gut’ or ‘intestine’ or ‘intestinal’ or ‘gastrointestine’ or ‘gastrointestinal’ or ‘bowel’); (metabolite’ or ‘metabolites’ or ‘metabolomic’ or ‘metabolomics’ or ‘metabolome’ or ‘metabolomes’); (‘spectroscopy’ or ‘spectroscopic’ or ‘spectrometry’ or ‘spectrometric’).
Terms and operators comprising search string queries applied to database and grey literature repository searches. Figure developed using BioRender software.
Search strategies were applied consistently across all five databases and all four grey literature repositories, with database-specific filters, limiters and expanders applied, as required. To ensure method repeatability, a comprehensive record of the inputs and outputs of every literature search was assembled in Microsoft Excel (v. 2019). Results from every targeted search were labelled and indexed into Smart Groups in referencing software, Endnote X9. Using both the ‘Find Duplicates’ function and manual screening, all duplicate records were then identified and excluded from the library, as per the PRISMA Statement process (17).
Data collection and synthesis of results
At the completion of screening, one reviewer (KG) extracted specific data from the included articles and compiled these items into a Microsoft Excel (v. 2019) spreadsheet. The data items extracted from each article were: study and cohort descriptors (bibliographical details, diabetes disease investigated, experimental study design, cohorts and respective sizes, any inclusion/exclusion criteria applied to the study cohorts, and type of biological samples used for metabolome analysis), and analysis descriptors (overall metabolomics analysis approach, and metabolomics technique/s employed).
In addition to these data, the key metabolome data from each article was extracted and tabulated according to the metabolites that every publication reported as being significantly associated with a diabetes disease. Publication findings were synthesised according to whether metabolites were reported as being increased or decreased in cohorts with diabetes; in addition to the number of times each metabolite appeared in individual publications. This summation of metabolite count data highlights which targets warrant further investigation as potential diabetes biomarkers.
All metabolites identified by articles in this systematic review were annotated with the relevant HMDB primary accession number (25); to avoid simultaneous use of synonymous metabolites. Where a reported metabolite could not be matched to a HMDB entry, it was instead annotated with the compound identifier (CID) assigned by the NLM PubChem database. Furthermore, if the reported target did not match a specific HMDB entry (i.e., the target corresponds to a mixture of isomers or chemical species), then the HMDB ID of the most common compound variant was provided as an example.
To ensure consistency in reporting, metabolite targets from different publications were consolidated under a single compound name if listed as synonyms within the HMDB. Additionally, in keeping with the focus of this systematic review, only data pertaining to gut-derived metabolites were extracted from publications; that is, those metabolites known to originate from an intestinal biological location (whether directly from the intestinal organ, the gut microbiota, or from non-excretory fluid of faeces) or cited as having a direct link with the gastrointestinal system. Moreover, only metabolites identified using metabolomics tools are reported (i.e., not with commercially available laboratory assays including, for example, ELISAs). This ensured standardisation in the findings between different methodologies.
Risk of bias in individual studies
Despite targeting a similar panel of gut-derived metabolites, significant methodological differences exist between research articles that investigate a facet of the intestinal metagenome. These differences extend from biological specimen collection techniques, to the methods and instruments used for downstream analyses. In addressing these discrepancies, this article aimed to evaluate if the employed methods of the included articles significantly impacted the metabolomic outputs reported. To achieve this, metabolomic findings were reported according to the type of biological specimen used in metabolomic analyses, and also based on the diabetes disease against which the findings were reported. Within these groups, Chi-Square tests of association were conducted to determine if the levels of any key gut-associated metabolites were significantly increased or decreased relative to (i) any diabetes disease type (i.e., T1DM, GDM, PreDM, or T2DM), or (ii) the reported sample collection method (i.e., blood, stool, or urine). These Chi-Square tests were conducted using R software, with Post-hoc pairwise tests conducted using the chisq.posthoc.test package to confirm significance of correlations between individual variables.
Results
The search strategy originally yielded 3,099 records. After removal of duplicate records, 2,042 records were screened by title and abstract and 1,953 studies were excluded having not met the defined inclusion criteria. The remaining eighty-nine full text articles were screened; from which, a total of thirty-four articles were included as part of the systematic review. In summarising this, Figure 2 depicts the study workflow for this review and details the number of articles included and excluded at each stage of the identification and screening processes.
Workflow of systematic review identification, screening, and inclusion processes. APO, Analysis Policy Observatory; INHATA, International Network of Agencies for Health Technology Assessment; WAT, wrong article type; WPG, wrong population group; WRT, wrong result type; WSD, wrong study design. Schematic adapted from PRISMA 2020 Flow Diagram (17).
The key cohort and analysis descriptors from the thirty-four reviewed records are summarised in Table 1 according to the type of diabetes disease targeted; detailing the location, experimental design, sample type and associated storage conditions, study cohorts, and metabolomics methods incorporated.
Table 2 lists the gut-associated metabolites reported as being significantly associated with diabetes. In this table, metabolites are reported alongside the sample type/s used in sourcing analysis, and colour-coded depending on whether the target was found to be increased or decreased in DM cohorts relative to non-diabetes (ND) control cohorts. Additionally, all 272 metabolites are listed with the corresponding HMDB primary accession number, to facilitate cross-referencing with the chemical repository.
Figure 3 demonstrates the proportions of reviewed studies that investigated each DM disease (inner ring), and, within each disease type, the proportion of studies that incorporated blood, urine and/or stool samples in metabolomic analyses (outer ring). The relative proportions depicted in Figure 3 are based on the number of metabolites (targets listed in Table 2) each study reported as being significantly associated with DM.
Schematic representing research targets of thirty-four studies analysed in this systematic review. Relative proportions based on counts of metabolites considered significantly different between cohorts depending on diabetes disease type (inner ring) and biological sample type (outer ring). Figure developed using R Studio software.
Summary of cohort descriptors
Thirty-four articles were analysed in this systematic review. The concentration of gut metabolites in individuals with T1DM was investigated in four studies (26–29); seven studies investigated GDM cohorts (30–36); eight studies investigated PreDM, or PreDM and T2DM cohorts (2, 37–43); and fifteen studies investigated T2DM cohorts only (44–58). Given the pre-determined exclusion criteria for this systematic review, all thirty-four studies incorporated an observational experimental design, with no interventional input. Cohort sizes varied significantly between studies depending on study objectives and stringency of inclusion/exclusion criteria. As depicted in Figure 3, across all diabetes diseases, the majority of metabolomic findings were obtained from blood components (plasma and/or serum). However, as outlined in Table 1, eleven studies analysed two types of biological samples (plasma and urine, plasma and stool, plasma and serum, stool and urine, or stool and serum).
Summary of analysis descriptors
Of the thirty-four studies reviewed, fifteen employed targeted metabolomic approaches; the majority of which targeted bile acids (BA), short-chain fatty acids (SCFA), or trimethylamine N-oxide (TMAO) and precursor metabolites. Fourteen articles incorporated untargeted metabolomic analyses, while an additional five studies combined targeted and untargeted metabolomic approaches. The details of each metabolomic method are outlined in Table 1. Briefly, mass spectrometry (MS) analyses were the most widely employed method; specifically, liquid chromatography-mass spectrometry configurations were employed in thirty-seven analyses (75.5%), gas chromatography-mass spectrometry methods were utilised in nine articles (18.3%), while capillary electrophoresis-mass spectrometry was used in a single study (2.5%). Nuclear magnetic resonance (NMR) metabolomic analyses were incorporated in five analyses (12.8%). Differential mobility spectroscopy and high-performance liquid chromatography with ultra-violet spectroscopy were each utilised in one analysis (2.5% per method).
Summary of metabolomic findings
Analysis of metabolomic findings revealed a total of 272 metabolites, across thirty-eight chemical classes and sub-classes, determined to be significantly associated with incidence of diabetes. Amino acid compounds were the most widely identified across all diabetes diseases; whilst only single metabolite targets were identified from several smaller classes of organoheterocyclic compounds (such as lactones and dihydrofuran compounds). The metabolites most widely cited as elevated in the reviewed studies were amino acids, leucine, and isoleucine. In contrast, levels of the sphingolipid metabolite, sphingomyelin, were most consistently observed to be decreased, with three articles reporting down-regulation in T2DM cohorts, relative to non-diabetes controls. As Table 2 depicts, consistent reporting of increased or decreased metabolite levels was predominantly observed in T2DM cohorts only; across other diabetes diseases, reported metabolites were only supported by single findings. This also reflects the trend depicted in Figure 3, in which the largest metabolite profiles were obtained from studies of T2DM (59.22%).
Analysis of the core metabolome shared between all the diseases revealed four metabolites to be significantly associated with T1DM, GDM, PreDM and T2DM cohorts (Figure 4). Of these, the alpha-hydroxy acid, 2-hydroxybutyric acid and the branched-chain amino acid (BCAA), valine, were determined to be consistently elevated. Whilst the amino acid, alanine, and BCAAs, leucine/isoleucine were also reported across all disease types, discrepancies existed between studies as to whether these compounds were increased or decreased in T1DM cohorts. In addition to these core metabolites, a further eleven targets were identified as being shared across three of the diabetes diseases (Figure 4). These included glucose, mannose, 3-hydroxybutyric acid, palmitic acid, and ketoisocaproic acid which were all reported as being significantly elevated across three different diabetes disease types. Tyrosine, tryptophan, palmitoleic acid, phosphatidylcholines, phosphatidylcholines, and triglycerides were also reported across three diabetes diseases, but findings of increased or decreased levels were discrepant between articles, depending on the sample type used in downstream metabolomic analyses. Pathways involved in the biosynthesis of BCAAs valine, leucine and isoleucine were determined to have the highest enrichment ratio and strongest enrichment p-value; followed by pathways involved in the biosynthesis of phenylalanine, tyrosine and tryptophan, and unsaturated fatty acids (Figure 5). Biosynthesis of the alpha-amino acid, tryptophan, is a highly enriched metabolic pathway (Figure 5), and the metabolite is also shown to share a high number of metabolic relationships within the network (degree = 96, betweenness = 10279.40).
Venn diagram representation of metabolites significantly associated with diabetes mellitus diseases. Figure represents 272 total metabolites reported as being significantly associated (either positively or negatively) with each of the four diabetes disease types. Metabolites shared between diabetes diseases are tallied in overlapping circles. Figure developed based on findings of thirty-four primary research articles reviewed in systematic review.
Enrichment ratio and p-value from enrichment analyses of the top twenty-five pathways associated with those metabolites reported as being significantly associated with diabetes diseases. Bar lengths represent enrichment ratio, calculated by the number of hits divided by the expected number of hits within each pathway. Enrichment analysis conducted on metabolites determined to be significantly associated with incidence of diabetes disease ( Table 2 ) and those with primary accession numbers indexed in the HMDB library. Enriched metabolic pathways are ordered according to decreasing p-value. Metabolite pathways defined based on KEGG human metabolic pathways library. Enrichment analysis conducted and visualised by MetaboAnalyst program.
Figure 5 depicts the enrichment ratios and p-values from enrichment analyses conducted on the metabolites reported as being significantly associated with the incidence of T1DM, GDM, PreDM and T2DM (Table 2). Bar plot depicts the top twenty-five metabolite pathways (according to calculated p-value) enriched in diabetes disease, based on the gut-associated metabolites collated in this systematic review. Data and corresponding metabolite-metabolite network for this enrichment analysis are presented in Supplementary Table S1.
Across all four diabetes diseases, discrepancies were reported between articles as to the concentrations of metabolites in the same, and different sample types. For example, fatty acids butyrate, heptadecenoic acid, and myristic acid were reported as both increased and decreased in blood samples collected from T2DM cohorts (relative to respective non-diabetes cohorts); but were also reported to be elevated in stool samples from T2DM cohorts. Further exemplifying this discrepancy; the concentration of key bile acids glycodeoxycholic acid, glycocholic acid, cholic acid and chenodeoxycholic acid were reported to be elevated in blood samples but decreased in stool samples collected from T2DM cohorts. The concentrations of four metabolites was dependent on carbon configuration, isomer structure or metabolite species: namely, ceramide, tridecanoic acid, and phosphatidylethanolamine and triglyceride compounds.
Specimen type used in studies of diabetes correlates with disease type and metabolite regulation findings
Chi-Square tests of association revealed evidence of a significant correlation between the type of specimen used in metabolomic analysis, and whether metabolite levels were reported as being increased or decreased (p = 3.5e-8). Incorporation of stool samples was significantly associated with identification of decreased metabolite levels; whilst the opposite was true of studies that utilised blood samples, as this specimen type was significantly associated with the identification of increased metabolite levels.
Further Chi-Square testing revealed a significant correlation between the type of diabetes and specimen used in metabolomic analyses (p = 1.4e-9). Post-hoc testing of this correlation revealed significant associations between two groups; GDM studies identified metabolites more from urine biospecimens, while T2DM studies identified metabolites more from stool and less from urine samples. Finally, statistical analyses revealed no significant association between type of diabetes disease and whether metabolite levels were reported as being increased or decreased.
Discussion
Metabolic disorders, particularly T1DM, GDM and T2DM, are physiologically distinct diseases, with very different causes, treatments, and outcomes. As such, the aim of this review was not to directly compare these aetiologies, but to collectively synthesise published metabolomics data and identify common disease targets; thereby maximising the future research potential of identified biomarkers. In achieving this, our review identified a core metabolomic signature that is common to all DM diseases. The four metabolites that comprise this shared diabetes metabolome are the alpha hydroxy acid, 2-hydoxybutyric acid, the amino acid, alanine, and BCAAs, valine, and the leucine/isoleucine isomer system (Table 2, Figure 4). As a by-product of protein metabolism, 2-hydroxybutyric acid has been positively correlated to the impairment of pancreatic β-cells (59) as a well-established early hallmark of insulin sensitivity, and resistance (60). Corroborating this, the findings of our review showed the metabolite to be elevated in blood samples taken from T1DM (26), GDM (61, 62), PreDM (2), and T2DM (48) cohorts. Similarly, concentrations of valine were significantly higher across all DM diseases in blood (2, 27, 40, 42, 55), stool (63), and urine (29); an expected finding given valine is widely associated with the incidence of oxidative stress, decreased insulin secretion, and high glucose levels (64). In contrast to 2-hydroxybutyric acid and valine, the role of leucine and isoleucine in DM is controversial. Some studies report that, alongside valine, the BCAAs have a detrimental effect on human metabolic health by decreasing insulin secretion; and even linking isoleucine with increased T2DM risk (65). However, other studies report that the metabolite acutely stimulates insulin production and plays an important role in ameliorating adiposity and maintaining glucose homeostasis (66, 67). In our review, the concentration of leucine and isoleucine were found to be elevated in the blood (2, 27, 34, 40, 42, 51, 55, 58) and urine (29) of individuals with DM, whilst leucine was reported to be decreased in T1DM cohorts (26). These contradictory findings reiterate the need for future studies that provide clarity around the regulatory profiles of these BCAAs in different biological sample types, and across the spectrum of diabetes diseases.
The majority of studies analysed in this review characterised the human intestinal metabolome associated with T2DM (Figures 3, 4). The focus of research on T2DM is commensurate with its high prevalence (86.4% of Australasian DM diagnoses (2, 27, 34, 40, 42, 51, 55, 58)). Our review has drawn attention to the unmet need for GDM- and T1DM-specific metabolomic research, given the distinct pathophysiological processes associated with the development of DM diseases. Our review has also highlighted the importance of appropriate interpretation of GDM studies; ensuring any significant findings are drawn from comparisons of appropriate disease and control cohorts. This is best exemplified in the findings of Ivanovova et al. (2021), who demonstrated significant differences in the levels of multiple SCFAs between GDM and non-pregnant cohorts, but not between GDM and pregnant-non-GDM cohorts. For future studies in the field of GDM-research, this highlights the importance of incorporating proper phenotype controls in study designs. Doing so will ensure conclusions can be drawn regarding the impact of GDM, and not pregnancy itself; a period that is already well-known to involve significant changes to the female gut microbiota and metabolome (33).
Our findings reinforce that biological sample type has a significant impact on metabolomic findings. This is best exemplified by comparing independent findings published by Zhou et al. (2019, 2020) (68, 69); which indicated that the levels of the same BA and SCFA metabolite targets were elevated in serum yet decreased in stool collected from the same participant cohorts. Overall, our review identified twenty-seven metabolites that were both increased and decreased, depending on whether blood, urine or stool was used in metabolomic analyses (Table 2). BAs were the most frequently discrepantly reported chemical species; with decreased levels in stool samples, yet increased levels in blood samples from DM cohorts. A site-specific difference is expected given only an estimated 5% of primary and secondary BAs are excreted in stool, while up to 95% are reabsorbed by the terminal ileum and transported back to the liver via portal circulation (62). However, literature reports that diabetes initiates changes in BA metabolism and composition (70, 71), and is accompanied by an increase in BA stool excretion; which does not support the decreased levels seen in stool profiles reported in the reviewed studies. Such discrepancies highlight the potential bias that sample type and collection methods may impose on metabolomic findings and emphasise that researchers should consider the inherent advantages and disadvantages of each sample type when designing studies that target human- and microbial-derived metabolites in the gut.
All results incorporated in this systematic review were based on findings from non-invasive, or minimally invasive sample types including stool, urine, and blood components (plasma/serum). Across all four DM diseases, blood was the most utilised sample, with stool the second most frequently utilised in T2DM and PreDM studies, and urine the second most utilised in T1DM and GDM studies (Figure 3). The incorporation of urine sample collection from T1DM and GDM cohorts is pragmatic in the clinical context given the often routine requirement for these patient groups to submit samples for urine ketone, protein and albumin testing, and hence easier recruitment to research studies. However, the discrepancies reported here, and in studies such as that of Deng, Xu, Shen, et al. (2023) (48), underline the importance of careful selection of sample types to ensure results provide the most accurate representation of the metabolome at the target organ site. Researchers may also consider the use of other sample types to analyse host-gut interactions, such as saliva, exhaled breath, or invasive sample types, such as tissue biopsies (26).
This systematic review also reported discrepant findings in the levels of twenty-six metabolites between studies that incorporated the same sample type in downstream metabolomic analyses (Table 2). These findings highlight the need for guidelines that standardise collection methods for biological samples used in metabolomic analyses. This could include best practice recommendations for sample collection times (such as first/second morning urine sampling), the preferred use of single-batch consumables to prevent inter-batch variability generating inconsistent artefacts, and recommendations to reduce contamination in tissue collection (for example, using protected specimen brush techniques in mucosal-luminal sampling) (68, 69). Enforcing the standardisation of these collection and preparation methods will work to limit inter-sample variability and maintain the biological and metabolic integrity of samples consistently across study cohorts (68).
In addition to sample type selection, pre-analytical procedures are well known to influence microbiome and metabolome readouts. In particular, collection and storage methods have a well-established impact on the accuracy and precision of downstream metabolomic results (65, 72), and metabolite extraction technique/s are critical to either preventing or causing biases in results (73). The majority of studies included in this review reported sample handling procedures in line with best practice guidelines (74) (Table 1). However, given the different sample types, chemical targets, metabolomic approaches and MS or NMR instrumentation used in each of the thirty-four reviewed studies (Table 1), the pre-treatment extraction and derivisation processes varied widely, and may explain discrepancies between studies. Therefore, while sample preparation methods have been comprehensively reviewed in the literature (29), further comparative analyses are required to elucidate inter-method and inter-platform biases.
Much of the research reviewed in this study reported differential concentrations of targeted metabolites; however, it is not made clear whether these markers were differentially increased or decreased between cohorts. Additional discrepancies also exist in the reporting of metabolite marker regulation; further confusing the role these metabolites play as either a ‘cause or cure’ to diabetes. This iterates the need for standardised reporting in future clinical metabolomics publications. Potential measures for implementation may include standardised reporting of fold changes between cohorts, as well as cross-referencing and reporting targets alongside primary accession codes linked to a publicly accessible database, such as HMDB, KEGG, PubChem, ChEBI, or UniProt. Doing so will prevent chemically synonymous compounds being misreported as novel targets and maximise the research potential of future studies in the metabolomics field.
A limitation of this review is the comparison of metabolite concentrations on a dichotomous scale; increased or decreased concentrations depending on healthy or diabetes status. Performing a quantitative comparison of metabolomic concentrations across the various study cohorts falls outside the scope of this systematic review and warrants further study. Therefore, further meta-analysis of the metabolomics data synthesised here is required to quantitatively compare metabolite concentrations; taking into consideration the inter-method effects of metabolomics tools, platform-specific biases, and the array of analytical pipelines consulted by researchers. Future statistical analysis should also consider controlling for participant baseline characteristics that vary from study to study; for instance, age, sex, duration of diabetes, race, genetic background, diet/lifestyle factors, or the use of any antidiabetic treatments or known microbiome-altering medications and supplements. Furthermore, the results of this review do not account for metabolome changes over time, or those stemming from diabetes-associated comorbidities (such as diabetic nephropathy, neuropathy, or retinopathy) which are known to further perturb the gut microbiota and metabolism (44, 45). It would therefore be pertinent for future studies to consider the effects attributable to the incidence and stage of comorbidities, by sub-stratifying participant cohorts accordingly. The results of our review may also be considered in conjunction with future microbiome-metabolome correlative analyses that incorporate tools such as 16S ribosomal RNA gene sequencing or whole genome shotgun sequencing. Alternatively, publicly available datasets, such as that curated by Muller, Algavi, and Borenstein (2022) (75) from faecal samples, provide fully processed, and benchmarked microbiome-metabolome integration tools to enable correlative analyses. Linking metabolomic outputs to microbial profiles is a key future research target, as it will provide a deeper insight into the functional capacity of the microbiota.
Conclusions
In conclusion, this systematic review analysed the findings of thirty-four articles investigating the intestinal metabolome associated with the incidence of T1DM, GDM, PreDM, and T2DM. Extracted data mapped the concentrations of 272 intestinal metabolites across thirty-eight chemical classes and sub-classes. To date, the majority of diabetes metabolome research has been conducted in T2DM cohorts; and while the experimental, and clinical importance of these studies is undeniable, this review highlights a bias in the research foci that has left GDM and T1DM diseases understudied. Our review also described a novel comparison of metabolite levels between blood, stool, and urine samples in DM cohorts. This is significant given few studies have investigated the potential biasing effect of sample type on the downstream identification of primary and secondary metabolites. The results of this work, and of other newly emerging research in the field (64), urge caution in directly inferring associations between the stool metabolome and the incidence of systemic diseases, such as diabetes. Overall, the key metabolites identified in this review warrant further investigation as potential diagnostic biomarkers or targets in the treatment of DM.
The reference list from the paper itself. Each links out to its DOI / PubMed record.
- 1Hirata S Kunisawa J . Gut microbiome, metabolome, and allergic diseases. Allergol Int. (2017) 66:523–8. doi: 10.1016/j.alit.2017.06.008 28693971 · doi ↗ · pubmed ↗
- 2Menni C Fauman E Erte I Perry JR Kastenmüller G Shin SY . Biomarkers for type 2 diabetes and impaired fasting glucose using a nontargeted metabolomics approach. Diabetes. (2013) 62:4270–6. doi: 10.2337/db 13-0570 PMC 383702423884885 · doi ↗ · pubmed ↗
- 3Rooks MG Garrett WS . Gut microbiota, metabolites and host immunity. Nat Rev Immunol. (2016) 16:341–52. doi: 10.1038/nri.2016.42 PMC 554123227231050 · doi ↗ · pubmed ↗
- 4Savolainen O Fagerberg B Vendelbo Lind M Sandberg AS Ross AB Bergström G . Biomarkers for predicting type 2 diabetes development-can metabolomics improve on existing biomarkers? Plo S One. (2017) 12:e 0177738–e 0177738. doi: 10.1371/journal.pone.0177738 28692646 PMC 5503163 · doi ↗ · pubmed ↗
- 5Tirosh A Calay ES Tuncman G Claiborn KC Inouye KE Eguchi K . The short-chain fatty acid propionate increases glucagon and FABP 4 production, impairing insulin action in mice and humans. Sci Transl Med. (2019) 11:eaav 0120. doi: 10.1126/scitranslmed.aav 0120 31019023 · doi ↗ · pubmed ↗
- 6Wu H-J Wu E . The role of gut microbiota in immune homeostasis and autoimmunity. Gut Microbes. (2012) 3:4–14. doi: 10.4161/gmic.19320 22356853 PMC 3337124 · doi ↗ · pubmed ↗
- 7Magliano DJ Islam RM Barr ELM Gregg EW Pavkov ME Harding JL . Trends in incidence of total or type 2 diabetes: systematic review. BMJ. (2019) 366:l 5003. doi: 10.1136/bmj.l 5003 31511236 PMC 6737490 · doi ↗ · pubmed ↗
- 8Mearns H Otiku PK Shelton M Kredo T Kagina BM Schmidt B-M . Screening strategies for adults with type 2 diabetes mellitus: a systematic review protocol. Syst Rev. (2020) 9:156. doi: 10.1186/s 13643-020-01417-3 32660625 PMC 7359237 · doi ↗ · pubmed ↗