Differential Expression of Core Metabolic Functions in Candidatus Altiarchaeum Inhabiting Distinct Subsurface Ecosystems
Sarah P. Esser, Victoria Turzynski, Julia Plewka, Julia Nuy, Carrie J. Moore, Indra Banas, André R. Soares, Janey Lee, Tanja Woyke, Alexander J. Probst

TL;DR
This study compares gene expression in two subsurface-dwelling Candidatus Altiarchaeum species to understand how they adapt to different environments.
Contribution
The paper reveals how gene expression differences in Ca. Altiarchaeum are influenced by viruses and symbiotic interactions in distinct subsurface ecosystems.
Findings
130 out of 331 annotated gene clusters showed significant expression differences between the two ecosystems.
Genes related to virus defense and energy metabolism were overexpressed in the sulfidic spring population.
CRISPR-Cas and polysaccharide biosynthesis genes were more active in the high-CO2 groundwater population.
Abstract
Candidatus Altiarchaea are widespread across aquatic subsurface ecosystems and possess a highly conserved core genome, yet adaptations of this core genome to different biotic and abiotic factors based on gene expression remain unknown. Here, we investigated the metatranscriptome of two Ca. Altiarchaeum populations that thrive in two substantially different subsurface ecosystems. In Crystal Geyser, a high‐CO2 groundwater system in the USA, Ca. Altiarchaeum crystalense co‐occurs with the symbiont Ca. Huberiarchaeum crystalense, while in the Muehlbacher sulfidic spring in Germany, an artesian spring high in sulfide concentration, Ca. A. hamiconexum is heavily infected with viruses. We here mapped metatranscriptome reads against their genomes to analyse the in situ expression profile of their core genomes. Out of 537 shared gene clusters, 331 were functionally annotated and 130 differed…
Genes, proteins, chemicals, diseases, species, mutations and cell lines named across the full text — each resolved to its canonical identifier and authoritative record.
Click any figure to enlarge with its caption.
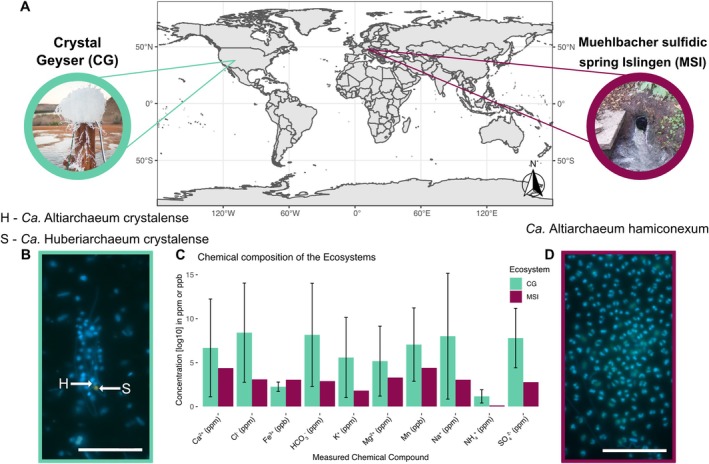 FIGURE 1
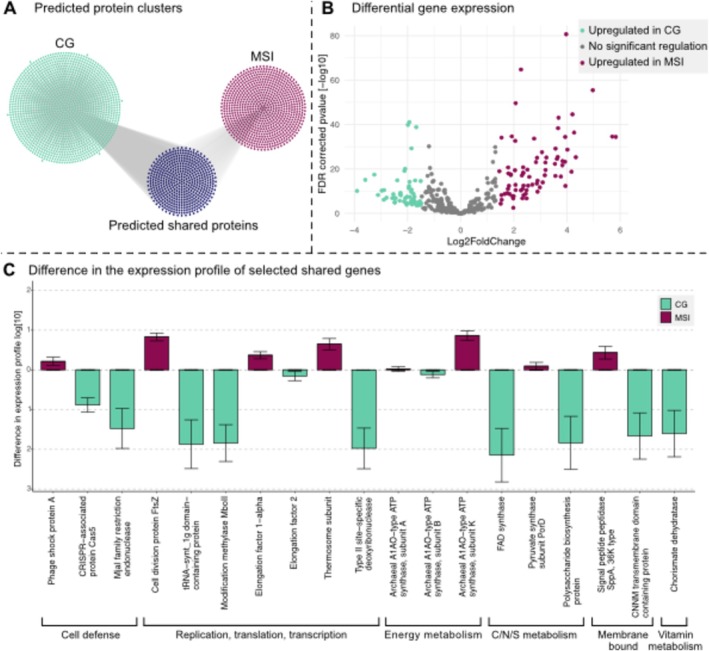 FIGURE 2
| Sample information | Nutrients, ions and bio‐accessible compounds | ||||||||||||
|---|---|---|---|---|---|---|---|---|---|---|---|---|---|
| Sample | Year | SO4 2− (ppm) | NH4 + (ppm) | Na+ (ppm) | Cl− (ppm) | Mg2+ (ppm) | K+ (ppm) | HCO3 2− (ppm) | Ca2+ (ppm) | Fe3+ (ppb) | Mn (ppb) | Citation | |
| CG | CG05 | 2015 | 2395 | 4.95 | 2383 | 4241 | 150 | 213 | 3695 | 660 | 10.16 | 1213 | (Probst et al. |
| CG08 | 2015 | 2389 | 0.82 | 2098 | 4388 | 138 | 204 | 3667 | 616 | 9.16 | 1083 | ||
| CG16 | 2015 | 2443 | 3.78 | 4446 | 4780 | 236 | 374 | 3070 | 1087 | 9.13 | 1152 | ||
| MSI | 2004 | 16 | 0.13 | 21 | 22 | 27 | 6.1 | 18 | 79 | 21 | 81 | (Rudolph et al. | |
- —Ministerium für Kultur und Wissenschaft des Landes Nordrhein‐ Westfalen (“Nachwuchsgruppe Dr. Alexander Probst”) and the German Research Foundation
- —Aker B.P.: GeneOil Project
- —U.S. Department of Energy Joint Genome Institute
- —DOE Office of Science User Facility
- —the Office of Science of the U.S. Department of Energy operated
Peer Reviews
No public reviews on file for this paper yet. If you reviewed it on a platform where reviews are public (OpenReview, ICLR, NeurIPS, ICML), you can paste yours below so the community can read it here.
Videos
No videos yet. Explain this paper in a talk, walkthrough, or lecture? Add one.
Taxonomy
TopicsGenomics and Phylogenetic Studies · Microbial Community Ecology and Physiology · Metabolomics and Mass Spectrometry Studies
Introduction
1
The aquatic deep subsurface houses some of Earth's most diverse and complex ecosystems, varying in chemical, physical and geological parameters. As a result, they serve as ecological niches for differently adapted microorganisms. DPANN (Diapherotrites, Parvarchaeota, Aenigmarchaeota, Nanohaloarchaeota and Nanoarchaeota) archaea (Rinke et al. 2013) are alongside other Archaea and Bacteria found in various aquatic deep subsurface ecosystems such as terrestrial geysers, aquifers and boreholes (Huber et al. 2002; Castelle et al. 2015; Ortiz‐Alvarez and Casamayor 2016; Momper et al. 2017; Dombrowski et al. 2019). To cope with their limited metabolic capacity, DPANN archaea are known to be able to live in symbiosis with other archaea, with the best‐studied example of Ignicoccus hospitalis and Nanoarchaeota equitans (Huber et al. 2002; Jahn et al. 2004, 2008; Paper et al. 2007), but also recently described DPANN‐host associations from the branch of Micrarchaeota (Sakai et al. 2022). One exception to this rule is Ca. Altiarchaeum, a geographically widespread genus of Organisms that live freely as carbon‐fixing organisms in the deep subsurface. Recent investigations of Ca. Altiarchaea have shown site‐specific genomic adaptations likely resulting from horizontal gene transfer, yet these organisms harbour a highly conserved core genome that follows a strict biogeographic pattern (Bornemann et al. 2022). Originally discovered in the Sippenauer Moor associated with sulfur‐oxidising bacteria (Rudolph et al. 2001), Ca. Altiarchaeum dominates and lives freely in groundwater aquifers, e.g., Geyser Andernach (Bornemann et al. 2022) in Germany. However, the archaeon was also shown to be the host of Ca. Huberiarchaeum in very specific aquatic environments, i.e., Crystal Geyser (CG) in the US (Probst et al. 2018; Schwank et al. 2019; Esser et al. 2023) and the Horonobe Underground Research Laboratory in Japan (Hernsdorf et al. 2017). Here, we focus on metatranscriptomic expression profiles of Ca. Altiarchaeum with its episymbiont Ca. Huberiarchaeum present in Crystal Geyser (CG) (Probst et al. 2018; Schwank et al. 2019; Esser et al. 2023) compared to Muehlbacher sulfidic spring (MSI), where the symbiont is absent (Probst et al. 2014) (Figures 1 and S2) and Ca. Altiarchaea is heavily targeted by viruses (Rahlff et al. 2021; Turzynski et al. 2023; Banas et al. 2023). In general, metatranscriptomic datasets from deep subsurface inhabiting microorganisms are rare (Vuillemin et al. 2020; Murakami et al. 2012; Lopez‐Fernandez et al. 2018; Seyler et al. 2021) and the here presented datasets expand the knowledge of the active metabolic capacity within the deep subsurface. We hypothesised that the differences in the expression profile of Ca. Altiarchaea population genomes were not only influenced by the differing chemical composition of the two ecosystems but also by the presence of the episymbiont and/or viruses.
(A) World map showing the two sampling sites, crystal geyser (CG, aquamarine) and muehlbacher sulfidic spring (MSI, magenta). (C) Differences in the chemical composition of MSI (n = 1) (Rudolph et al. 2004), and CG (n = 3) (Probst et al. 2018) are shown for nutrients and ions measured in both ecosystems. The bars for CG show the average ppm/ppb of three samples (CG05; CG08; CG16) (Probst et al. 2018). (B and D) Fluorescence in situ hybridization (FISH) images show the host Ca. Altiarchaeum (SMARCH714 labelled with Atto448 (Rudolph et al. 2004)) in green (H) and the symbiont Ca. Huberiarchaeum (HUB1206 with Cy3 (Schwank et al. 2019)) in orange (S). Shown chemical compositions from CG were sampled in the minor eruption phase of the eruption cycle, where Ca. Altiarchaea is the dominant organism. Please note that the symbiont was not detected in MSI. Scale bar 10 μm.
Results and Discussion
2
The two sampling sites, CG and MSI, are located in Utah, USA (N 38 56′ 18.125″; W 110 8′ 7.389″) and in Regensburg, Germany (N 48 59′ 8.999″; O 12 7′ 38.459″), respectively, and also differ in the chemical composition of bio‐processable ions and other molecules in their groundwater (Rudolph et al. 2001; Probst et al. 2018) (summarised in Figure 1A,C; Table 1). Particularly, the chemical composition of CG varies throughout the phases of eruption (Probst et al. 2018), whereby Ca. Altiarchaea is dominant in the minor eruption phase fed by the deepest intersected aquifer (Rudolph et al. 2001; Probst et al. 2018). When comparing the ion composition of CG's minor eruption phase to MSI, the latter sampling site appears to be rather limited in ion and nutrient availability (Figure 1C). MSI, as a sulfidic spring with high levels of sulfide (16 mg/L) (Rudolph et al. 2004), has a three‐fold logarithmic lower sulfate concentration than CG (average of 2209 mg/L from three sampling timepoints in the minor eruption phase) (Probst et al. 2018) (Table 1). Interestingly, nitrate, sodium, and potassium have also a lower abundance in MSI compared to CG, which might influence the necessity to form biofilms for nutrient retention and filtration from groundwater (Table 1). This is in agreement with the finding that Ca. Altiarchaea are predominantly present as single cells in CG (Probst et al. 2018) (Figures 1 and S1) and almost solely found as biofilms in MSI (Figures 1 and S2), where the cells interconnect with hami (Probst et al. 2014; Rahlff et al. 2021; Probst and Moissl‐Eichinger 2015). Irrespective of the mentioned physiological differences and site‐specific horizontal diversification of Ca. Altiarchaea, their core genome is highly conserved across many deep subsurface sites (Bornemann et al. 2022) rendering it the ideal genus for studying differential gene expression with respect to different environmental conditions. Besides a single report on the chemical composition of the groundwater at MSI (Rudolph et al. 2004), pH (7) and temperature (10.5°C) values were stable during multiple samplings over the past years and also in November 2022 when the samples for the metatranscriptome were leveraged.
Substantially Different Gene Expression Profiles in Two Separate Subsurface Ecosystems
2.1
Predicted genes of previously published genomes from CG and MSI (14 genomes and one genome, respectively; Table S2) were clustered at 80% nucleotide similarity. Of the 537 shared gene clusters (Figure 2A), 430 were assigned a functional annotation. The 107 remaining gene clusters were either not annotated (no hit in FunTaxDB 1.2, which is based on UniRef100 release 2023_02 (Suzek et al. 2007; Suzek et al. 2015)) or annotated as uncharacterized proteins. From the 430 annotated gene clusters, 94 were within the first or last 200‐bp of the respective scaffold, causing irregularities in transcriptome mapping (underestimation of coverage). These genes were also excluded from downstream statistical analysis. The remaining 336 gene clusters were sorted according to their functional annotation, whereby the overall differential expression for most gene clusters in CG (~90.8%, n = 305) was higher than in MSI (~9.2%, n = 31).
Gene clusters, differential gene expression and differences in gene expression profile of two Ca. Altiarchaea populations. (A) Gene clusters (80% AA similarity) of CG (n = 1447) and MSI (n = 824), as well as shared protein clusters (n = 537). (B) Differential gene expression of MSI compared to CG. The count data was normalised based on the coverage of 10 ribosomal proteins (see methods) and then evaluated with DESeq2 (Love et al. 2014; Liu et al. 2021) in R studio (Core Team 2013). (C) Difference graph of the expression profile for 19 shared gene clusters selected based on annotation, difference, and relationship to physiology/ecology (the values represent the difference in the expression of the gene clusters). All values, including mean expression rate and standard deviations, are listed in Table S3.
Based on DESeq2 calculated Log2FoldChange (below −1.47 and above 1.44; FDR corrected p values < 0.05), the overall regulation of genes revealed a significant upregulation of 76 genes in MSI compared to 54 genes in CG. In general, the Log2FoldChange calculated based on DESeq2 approaches is generated by an estimation of gene‐wise dispersion and fits a respective model. This model is based on the baseline data, in this case, MSI transcriptional expression data. Genes overexpressed in CG code for proteins that included Modification Methylase MboII, a Type II site‐specific deoxyribonuclease, a FAD synthase, and an FAD synthase (Figure 2C). By contrast, MSI upregulated genes included those for ribosomal proteins (e.g., S11, S28e, L35Ae), a phage shock protein, a cell division protein (FtsZ) and a Thermosome subunit (Figure 2C).
Gene Expression Profiles Correlate With Physiological Characteristics
2.2
Focusing on the difference in the expression profile of shared gene clusters (Figures 2C and S3–S10) it was evident that the increase in expression of any given significantly differently expressed gene was substantially greater in CG than in MSI (Figures S11 and S12). Particularly, some genes related to replication (e.g., DNA polymerases, Tables S3 and S4) and nutrient metabolism have up to two‐fold higher expression in CG than in MSI (Figures S5 and S8), suggesting that Ca. A. crystalense is more active and replicating than Ca. A. hamiconexum when sampling the respective ecosystem. However, the expression of FtsZ, a protein involved in forming the septum of a dividing Ca. A. hamiconexum (Probst et al. 2014; Rahlff et al. 2021; Probst and Moissl‐Eichinger 2015) cell seems upregulated in MSI (Figure 2C). The accumulation of this protein, which usually has similar concentrations in the cell irrespective of cell division, can be used as an indicator of a starting cell division process, as it localises as a mid‐cell ring early in the division process shown for E. coli (Den Blaauwen et al. 1999). In addition, genes for the elongation factor 1 alpha, which is included in the aminoacyl tRNA incorporation in Archaea and Eukaryotes (Xu et al. 2022), and the thermosome subunit, which represents the chaperonin family in archaea and is accordingly involved in protein folding (Phipps et al. 1991, 1993), are up to two‐fold higher expressed in MSI as compared to CG. This can also be an indicator that cell division in MSI is upregulated. Therefore, the upregulation of ftsZ gene expression suggests a higher replication rate of Ca. Altiarchaeum hamiconexum in MSI and supports the visible diploidy of the cells in previously published (Probst et al. 2014; Henneberger et al. 2006) and here shown fluorescence in situ hybridisation (FISH) images (Figures 1, S1 and S2). Comparing the function of the cellular replication genes upregulated in CG (i.e., genes encoding DNA polymerases) versus MSI (i.e., genes encoding for the cell division process), it is indicated that Ca. A. crystalense appears to heavily replicate the genome but somehow does not proceed with the cell division cycle as corresponding cells in MSI. Previous studies on archaeal cell division showed that the depletion of the FtsZ proteins in Haloferax volcanii inhibits cell division, while DNA replication is still ongoing (Liao et al. 2021). We propose that although DNA synthesis is very prominent in Altiarchaea from CG, their final cell division seems hampered, likely due to the presence of the symbiont Ca. H. crystalense or many different viruses in CG that show infection histories with this organism (Esser et al. 2023).
Differential Expression of Microbial Defence Mechanism Relates to Types of Infection
2.3
Ca. A. hamiconexum has been described to be infected by at least two different viruses, one of which is a lytic virus (Rahlff et al. 2021; Turzynski et al. 2023). In agreement with these findings, the differential expression analysis revealed a significant increase in the gene encoding phage shock proteins, which are a stress response to membrane penetration by invading mobile genetic elements (MGEs) (Brissette et al. 1990), in MSI compared to CG. By contrast, CRISPR Cas 5, which is a protein involved in the cascade building for the splicing mechanisms in CRISPR type I systems (reviewed by Hille and Carpentier, 2016) (Hille and Charpentier 2016) is upregulated in Ca. A. crystalense (Figure S2C), which shows an expansive spacer variety over 6 years not only against MGEs but also against its episymbiont (Esser et al. 2023). Consequently, we identified a specific adaptation of defence mechanisms against lytic viruses and the episymbiont, respectively.
Beyond upregulation of the CRISPR system, the interaction of the episymbiont might also be responsible for the upregulation of other metabolic functions in Ca. A. crystalense. For example, multiple genes encoding proteins involved in energy metabolism, such as the quinolinate synthase, FO synthase subunit 2 and the FAD synthase (Figures 2C, S5 and S6) were significantly enriched in the CG transcriptome. Increased energy demands might stem from the highly active CRISPR Cas system, which acquired hundreds of thousands of different spacers in the Ca. Altiarchaeum population at CG (Esser et al. 2023). In addition, polysaccharide biosynthesis genes were found to be upregulated in CG, although we only seldom found biofilms of Ca. Altiarchaea in CG compared to MSI (Figure 1) (Probst et al. 2018, 2014). This upregulation could either be related to the scavenging nature of the episymbiont (Schwank et al. 2019) or indicate an intrinsic tendency of the Ca. A. crystalense to form biofilms without success, potentially due to the turbulent geyser system (Probst et al. 2018).
In summary, we found that gene expression of two Ca. Altiarchaea populations, originating from distinct geological settings, is influenced by environmental factors, such as high pressure and different geochemical conditions, as well as biological interactions. While the upregulated genes in the microbial population in MSI appear reflective of viral attacks, the episymbiont in CG and the turbulence of the geyser system seem to upregulate the CRISPR system, the energy metabolism and the biofilm formation. Leveraging metatranscriptomes of low‐biomass deep subsurface ecosystems, this study contributes to the existing DNA sequencing‐based body of literature on the deep biosphere in general and on Ca. Altiarchaeum in particular.
Experimental Procedures
2.3.1
RNA Extraction and Sequencing
2.3.1.1
For RNA extraction from Ca. Altiarchaeota biofilms in MSI, the biofilm flocks were harvested in November 2021 as previously described (Probst et al. 2013) and directly frozen at –80°C until further processing in the lab. RNA was extracted with the RNeasy PowerBiofilm RNA extraction kit (Qiagen, Germany) according to the manufacturer's instructions. The extracted RNA was sequenced at the LCSB (Luxembourg) with 150 bp paired‐end Illumina technology. Prior to sequencing, the rRNA was depleted using Zymo‐Seq RiboFree Total RNA Library Kit (R3003) according to the manufacturer's protocol. The library amplification was performed with 12 PCR cycles.
Sequencing data from Crystal Geyser was retrieved from a previous study (Esser et al. 2023) (minor eruption phase, samples CG05, CG08 and CG16), specifically using datasets from samples where Ca. Altiarchaeum crystalense is the most abundant organism. In brief, the erupted water from CG was sequentially filtered on PTFE filters, which were frozen on site on dry ice (Probst et al. 2018). The RNA extraction was performed with an adjusted protocol of the Qiagen DNeasy PowerMax Soil kit (Qiagen, Germantown, MD) (Esser et al. 2023). All accession numbers are listed in Table S1.
Coverage‐Based Normalisation of Metatranscriptomes
2.3.1.2
After quality filtering with bbduk (https://github.com/BioInfoTools/BBMap/blob/master/sh/bbduk.sh) and sickle (Joshi and Fass 2011), the metatranscriptomics reads were normalised by mapping (Langmead and Salzberg 2012) reads against representative genomes of Ca. Altiarchaeum hamiconexum (MSI) and Ca. A. crystalense (CG) (see Table S1 for accession numbers). The mean coverage of 10 house‐keeping genes [30S ribosomal proteins: S4, S5, S7, S8e, S9, S10, S11, S12, S13, S15] was used to calculate the normalisation factor of each metatranscriptome sample (per ecosystem n = 3) (Table S2). Prior to choosing these genes for normalisation, the position of the gene on the scaffold (not within the first/last 200 bp of the scaffold) and a stable coverage distribution across the gene were taken into consideration. Despite the presence of complex microbial communities within the described ecosystems, the metatranscriptomic datasets mapped sufficiently to Ca. Altiarchaeum, as it is the dominant organism within the samples analysed herein.
Clustering of Genes and Calculation of Expression Profile
2.3.1.3
Genes of the abovementioned Ca. A. hamiconexum and Ca. A. crystalense genomes were predicted with prodigal (Hyatt et al. 2010), and consecutively clustered with cdhit (Li and Godzik 2006; Fu et al. 2012) at 80% amino acid similarity (−c 0.8). The genes from the two ecosystems sharing a cluster were annotated with the FunTaxDB (Bornemann et al. 2023) (version 1.2) database. All genes that either had no or an unclassified annotation and/or which started or ended within the first or last 200 bps of the scaffolds were discarded within the expression profile. Removing genes starting or ending within the first or last 200 bps of a scaffold was chosen to avoid mapping distortions resulting from inaccurate mapping at these scaffold regions.
The abovementioned normalisation factors were used to determine the coverage differences introduced by the varying extraction and sequencing methods and the mean coverage with standard deviation of the shared gene clusters was calculated. The visualisation was performed with ggplot2 (Wickham 2016) in R studio (Core Team 2013; Posit team 2022) (version 2023.03.0 + 386). The data for evaluating the count data within the RNA‐seq data was performed with DESeq2 implemented in R (Love et al. 2014). The threshold values of up‐ and downregulation of differential gene expression were calculated to the base expression of MSI according to Quackenbush 2002 (Quackenbush 2002).
Fluorescence In Situ Hybridisation (FISH)
2.3.1.4
Ca. A. hamiconexum biofilm flocks were taken from MSI. For FISH purposes, the biofilm flocks were harvested and fixed as previously described on site with 3% (v/v)% formaldehyde (Rahlff et al. 2021), stored at −20°C, and deposited on a slide for hybridization. For Ca. A. crystalense (CG), cells were filtered onto 0.2 μm PTFE filters (Polytetrafluorethylene) and fixed on site with 3% (v/v)% formaldehyde and stored at −80°C as described previously (Schwank et al. 2019). The samples from CG and MSI were taken in August 2021 and February 2022, respectively. For both systems, the 16S rRNA probe ‘SMARCH714’ (Moissl et al. 2003) was labelled with Atto488. The episymbiont Ca. Huberiarchaeum crystalense was labelled with a specifically designed Cy3 probe called ‘HUB1206’ (Schwank et al. 2019). The FISH procedure was carried out as previously described by (Schwank et al. 2019). Cells were counterstained with DAPI (4 μg mL^−1^).
Image analysis was carried out with a Zeiss Axio Imager M2m epifluorescence microscope (X‐Cite XYLIS Broad Spectrum LED Illumination System, Excelitas) equipped with an Axio Cam MRm and a Zen 3.4 Pro software (version 3.4.91.00000). Imaging was carried out by using the 100×/1.3 oil objective EC‐Plan NEOFLUAR and three different filter sets: 09 for achieving the 16S rRNA signals of Ca. Altiarchaea, 43 Cy3 for the detection of Ca. Huberiarchaea signals and 49 DAPI for imaging Ca. A. crystalense/hamiconexum cells and Ca. H. crystalense cells.
Author Contributions
Sarah P. Esser: conceptualization, investigation, writing – original draft, methodology, validation, visualization, data curation, writing – review and editing. Victoria Turzynski: visualization, investigation. Julia Plewka: methodology, formal analysis, investigation. Julia Nuy: visualization. Carrie J. Moore: investigation, methodology, formal analysis. Indra Banas: visualization, investigation. André R. Soares: investigation, formal analysis. Janey Lee: investigation, methodology. Tanja Woyke: investigation, methodology. Alexander J. Probst: conceptualization, funding acquisition, writing – original draft, methodology, formal analysis, supervision, project administration, writing – review and editing.
Conflicts of Interest
The authors declare no conflicts of interest.
Supporting information
Data S1. emi470096‐sup‐0001‐Supinfo.
Table S1. emi470096‐sup‐0002‐TableS1.
Table S2. emi470096‐sup‐0003‐TableS2.
Table S3. emi470096‐sup‐0004‐TableS3.
Table S4. emi470096‐sup‐0005‐TableS4.
The reference list from the paper itself. Each links out to its DOI / PubMed record.
- 1Banas, I. , S. P. Esser , V. Turzynski , et al. 2023. “Spatio‐Functional Organization in Virocells of Small Uncultivated Archaea From the Deep Biosphere.” ISME Journal 17: 1789–1792. 10.1038/s 41396-023-01474-1.37468677 PMC 10504349 · doi ↗ · pubmed ↗
- 2Bornemann, T. L. V. , P. S. Adam , V. Turzynski , et al. 2022. “Genetic Diversity in Terrestrial Subsurface Ecosystems Impacted by Geological Degassing.” Nature Communications 13: 284.10.1038/s 41467-021-27783-7PMC 875572335022403 · doi ↗ · pubmed ↗
- 3Bornemann, T. L. V. , S. P. Esser , T. L. Stach , T. Burg , and A. J. Probst . 2023. “u Bin—A Manual Refining Tool for Genomes From Metagenomes.” Environmental Microbiology 25: 1077–1083. 10.1111/1462-2920.16351.36764661 · doi ↗ · pubmed ↗
- 4Brissette, J. L. , M. Russel , L. Weiner , and P. Model . 1990. “Phage Shock Protein, a Stress Protein of Escherichia coli .” Proceedings of the National Academy of Sciences 87: 862–866.10.1073/pnas.87.3.862PMC 533682105503 · doi ↗ · pubmed ↗
- 5Castelle, C. J. , K. C. Wrighton , B. C. Thomas , et al. 2015. “Genomic Expansion of Domain Archaea Highlights Roles for Organisms From New Phyla in Anaerobic Carbon Cycling.” Current Biology 25: 690–701.25702576 10.1016/j.cub.2015.01.014 · doi ↗ · pubmed ↗
- 6Core Team, R. 2013. R: A Language and Environment for Statistical Computing.
- 7Den Blaauwen, T. , N. Buddelmeijer , M. E. G. Aarsman , C. M. Hameete , and N. Nanninga . 1999. “Timing of Fts Z Assembly in Escherichia coli .” Journal of Bacteriology 181: 5167–5175.10464184 10.1128/jb.181.17.5167-5175.1999 PMC 94019 · doi ↗ · pubmed ↗
- 8Dombrowski, N. , J.‐H. Lee , T. A. Williams , P. Offre , and A. Spang . 2019. “Genomic Diversity, Lifestyles and Evolutionary Origins of DPANN Archaea.” FEMS Microbiology Letters 366: p.fnz 008.10.1093/femsle/fnz 008PMC 634994530629179 · doi ↗ · pubmed ↗