esMPRA: an easy-to-use systematic pipeline for MPRA experiment quality control and data analysis
Jiaqi Li, Pengcheng Zhang, Xi Xi, Xiaowo Wang

TL;DR
esMPRA is a user-friendly pipeline for quality control and data analysis in MPRA experiments, helping ensure reliable and reproducible results.
Contribution
esMPRA introduces a standardized, accessible pipeline for MPRA quality control and analysis with minimal bioinformatics expertise required.
Findings
esMPRA provides stage-specific diagnostic reports and recommendations to prevent experimental risks.
The pipeline is open-source and compatible with multiple operating systems.
It offers end-to-end solutions including processed data and analysis reports for downstream use.
Abstract
Massively Parallel Reporter Assays (MPRAs) have emerged as pivotal tools for systematically profiling cis-regulatory element activity, playing critical roles in deciphering gene regulation mechanisms and synthetic regulatory element engineering. However, MPRA experiments involve multi-step library processing procedures coupled with high-throughput sequencing. Operational errors during these complex workflows can lead to substantial resource depletion and experimental delays. Thus robust and user-friendly quality control methods are essential to minimize experimental failures and ensure reproducibility between replicates. Here, we present esMPRA, an integrated quality control and analysis pipeline designed for MPRA experiments. Building on our experience in MPRA and its derivative techniques, coupled with systematic analysis of public MPRA datasets, we established standardized quality…
Click any figure to enlarge with its caption.
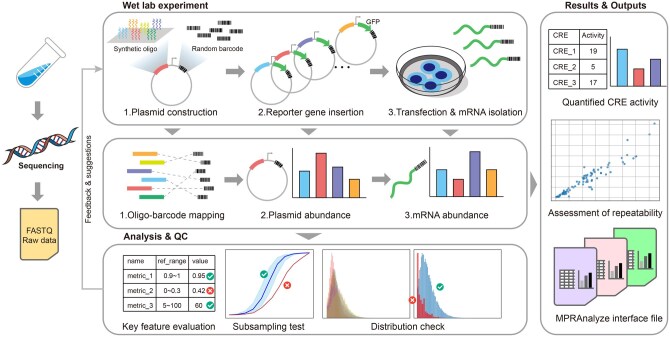 Figure 1
- —National Key R&D Program of China10.13039/501100012166
- —National Natural Science Foundation of China10.13039/501100001809
Peer Reviews
No public reviews on file for this paper yet. If you reviewed it on a platform where reviews are public (OpenReview, ICLR, NeurIPS, ICML), you can paste yours below so the community can read it here.
Videos
No videos yet. Explain this paper in a talk, walkthrough, or lecture? Add one.
Taxonomy
TopicsRNA and protein synthesis mechanisms · RNA Research and Splicing · Molecular Biology Techniques and Applications
1 Introduction
Gene regulation constitutes the fundamental mechanism underlying biological processes, with cis-regulatory elements (CRE) serving as critical components that realize precise transcriptional control. Accurately quantifying the functional activity of these regulatory elements holds significant implications for deciphering the genetic code (Sharon et al. 2012), advancing precision medicine platforms (Huang et al. 2019), and optimizing bioengineering applications (Hossain et al. 2020). The Massively Parallel Reporter Assay (MPRA) has emerged as a pivotal technological innovation, enabling high-throughput functional characterization of cis-regulatory elements. This powerful approach has been widely adopted in diverse researches including non-coding variant analysis (Tewhey et al. 2016), synthetic regulatory element design (Gosai et al. 2024, Li et al. 2025), and transcriptional regulation studies (Duttke et al. 2024).
However, our investigations reveal substantial challenges in MPRA implementation. The technical complexity of MPRA workflows imposes significant demands on experimental operators, particularly for novice researchers at this technology, who often require extensive trial-and-error optimization that consumes substantial time and resources. Additionally, the data processing workflow for MPRA experiments is complex, often requiring researchers to expend considerable effort in handling and analyzing high-throughput data at every stage. While Tewhey et al. (2016) provided a companion data processing tool, MPRASuite, it lacks integrated quality control functionality and presents a steep learning curve for beginners. On the other hand, MPRAnalyze (Ashuach et al. 2019) enables more advanced statistical analyses of MPRA data, but it does not support the processing of raw sequencing data. The lack of easy-to-use and efficient MPRA data processing tools leads to low efficiency in the workflow of non-expert researchers.
To address these challenges, we developed esMPRA, a user-friendly computational pipeline for systematic quality control and analysis of MPRA data. Building on extensive experimental experience with MPRA, we identified key metrics at each step of the experimental workflow. Leveraging a large collection of MPRA datasets that support the CODA platform (Gosai et al. 2024), we generated a comprehensive set of reference samples. Based on these references, we established a quantitative quality control framework to guide and standardize MPRA data assessment. The pipeline automatically generates stepwise QC reports that identify risk factors and provide actionable troubleshooting recommendations, effectively minimizing experimental failures and reducing optimization cycles. Notably, esMPRA is exceptionally accessible to novices, with installation and operation achievable via a one command-line instruction, while delivering comprehensive analysis outputs including processed data and standardized file formats for downstream analyses (Ashuach et al. 2019). This integrated framework significantly enhances the efficiency and reliability of MPRA experiments while lowering technical barriers for new users.
2 Overview
esMPRA is developed in Python (version 3.8.0, compatible with versions 3.7 and above) and is designed based on the experimental framework described by (Tewhey et al. 2016). esMPRA can run on operating systems that support Python. It can operate on a wide range of devices, from high-performance computing devices to lightweight laptops, as long as the device has sufficient RAM to handle high-throughput sequencing data. It provides dedicated data processing and quality control modules for each experimental step (Fig. 1). After organizing and integrating the codebase, esMPRA can be installed with a single pip install command, and all of its functionalities can be executed via one-line command executions. For MPRA experiments following the protocol outlined by (Tewhey et al. 2016), the default parameters of esMPRA are sufficient to perform all necessary functions. For each quality control step, esMPRA generates a detailed report that highlights potential risk factors and recommends appropriate experimental interventions. All parameters are comprehensively documented within the embedded help messages and the README file, allowing users to easily adjust settings as needed. Users are encouraged to consult the README for detailed step-by-step instructions and can also download curated test datasets to verify the operation of the example scripts. A script that includes all processing steps is also provided. Executing this script can automatically perform all the processing steps for the test datasets, thereby facilitating a better understanding of the overall workflow for readers.
Workflow of esMPRA. esMPRA takes the raw fastq files generated in each experimental step as input and produces corresponding analytical results. While conducting the analysis, esMPRA performs quality control on key parameters in each step, providing reference ranges based on a large amount of existing MPRA data analysis and offering specific experimental suggestions for high-risk items. After completing the quality control and analysis for each step, esMPRA provides the final analytical results, assesses the reproducibility of the experiment, and outputs interface files in a standardized format for further in-depth analysis.
3 Design and implementations
3.1 Quantitative quality control
Based on our previous MPRA experiments and data processing experience, we have summarized key quantitative quality control metrics for each step of the workflow. The most important of these metrics fall into the following categories: the proportion of qualified oligos (used to determine whether a sufficient number of oligos are available at each step based on specific qualification criteria), the number of barcodes associated with each oligo (used to assess the complexity of library construction and sequencing quality), the proportion of barcodes detected a specific number of times in sequencing and the mean detection count of barcodes (used to evaluate whether the number of different barcodes is evenly distributed within the sample and whether the sequencing depth is sufficient.), and the correlation between plasmid abundance and RNA abundance (used to assess whether plasmid DNA has been adequately removed). Additional detailed parameters are also included and are described in the QC reports. We calculated these metrics across a large collection of MPRA datasets (Gosai et al. 2024) and used the resulting values to define reference ranges. When a single step contains risk warning, users are advised to inspect the experimental procedures to address potential issues.
In addition, we simulated the effect of different sequencing depths on sequence coverage through downsampling and visualized the results to help determine whether the current sequencing depth is sufficient. And we plotted the distribution of barcode counts to assess library complexity and sequencing quality. We also established reference plots based on the collection of MPRA datasets. Furthermore, each report file includes additional analysis parameters and figures at the end to provide readers with a more comprehensive view of the experimental quality.
3.2 Mapping oligos with barcodes
MPRA quantifies regulatory activity by appending random barcodes to designed oligo sequences, thereby labeling a vast array of oligos for activity measurement. In addition, it aggregates the activity of the same oligo across multiple barcodes to mitigate experimental variability. In esMPRA, the “step1_oligo_barcode_map” module determines the correspondence between oligos and their random barcodes by processing the raw fastq files generated in this step. Two operational modes are available for this process; the recommended approach is to employ the—use_flash option after installing the FLASH2 tool (Magoč and Salzberg 2011), which enhances both processing speed and accuracy.
In this step, a critical metric is the number of unique random barcode types associated with each oligo sequence. It is essential to control the library complexity within an optimal range to ensure the experiment's success. An excessive number of barcodes indicates an overly complex library, which may result in many barcodes going undetected in subsequent experiments. Conversely, a barcode count that is too low can introduce significant noise during the quantification of CRE activity. For additional key metrics and further details, please refer to the README documentation.
3.3 Determine plasmid abundance
After mapping the correspondence between oligos and random barcodes, typically a reporter gene is inserted between them to enable the assessment of transcriptional regulatory element activity. For accurate quantification of these elements, the relative abundance of plasmids serves as a reference. Consequently, following the insertion of the reporter gene, sequencing is performed to quantify the relative abundance of each random barcode across all plasmids. The “step2_get_plasmid_counts” module accomplishes this by processing the raw fastq files generated at this stage.
A key metric in this step is the sequencing coverage of both barcodes and oligos. It is crucial that as many barcodes and oligos as possible are adequately covered by sequencing. Insufficient coverage may suggest low efficiency in plasmid construction or an inadequate sequencing depth.
3.4 Getting RNA (cDNA) abundance
After the insertion of the reporter gene and the quantification of barcode abundance in the plasmids, the constructed plasmids are transfected into target cells. After a defined period of culture, the RNA transcripts are measured. Typically, RNA quantification is performed by reverse transcription followed by cDNA sequencing, which indirectly determines RNA abundance. The “step3_get_RNA_counts” module processes the raw fastq files generated during this step to quantify the relative abundance of random barcodes within the cDNA, thereby enabling the accurate quantification of transcriptional regulatory element activity.
In this step, the sequencing coverage of barcodes and oligos remains a critical parameter. However, assuming that the previous quality control standards have been met, inadequate coverage in this phase may be due to various factors. The most likely cause of risk values here is an insufficient RNA input for reverse transcription, which should be checked with the provided reports.
3.5 Quantifying the activity
Mapping oligos with barcodes establishes the correspondence between each oligo and its random barcode. By integrating the relative abundance of barcodes measured in plasmids with that in RNA (cDNA), the regulatory activity associated with each barcode can be quantified. With the established oligo–barcode correspondence, the transcriptional regulatory activity of each oligo sequence can be evaluated, as defined by Equation (1).
The “step4_get_result” module quantifies the final CRE activity based on the results of these steps.
This step focuses on a single key parameter: the correlation coefficient between plasmid and cDNA abundances, which can provide significant quality control insights. An excessively high correlation suggests that DNA was not effectively removed prior to reverse transcription, potentially influencing the final quantification results. Special monitoring of this parameter is recommended.
3.6 Extended functionality
After completing the standard data processing and quality control steps described above, the CRE activity of the oligos obtained in a single experiment can be determined. In typical applications, several parallel replicates are conducted to ensure experimental reproducibility. To support this common requirement, esMPRA provides the “step5_compare_diff_rep” function, which evaluates the pairwise correlations among multiple replicate experiments.
In addition to the aforementioned data analysis and quality control, users may sometimes require further data processing and analysis using other tools. To facilitate such workflows, esMPRA generates standardized output files for downstream analysis. Specifically, the “generate_data_for_MPRAnalyse” function produces interface files formatted according to the requirements of MPRAnalyze (Ashuach et al. 2019).
4 Conclusion
We propose esMPRA with the aim of simplifying MPRA experiment quality control and data analysis for a broad range of users, thereby facilitating the wider adoption of this important technology. esMPRA is designed for one-line installation and operation across diverse computing platforms, drastically reducing the barrier to entry—allowing even users with minimal command line experience to get started quickly. The tool generates comprehensive quality control reports and provides experimental recommendations that help researchers rapidly identify potential risks, significantly enhancing experimental efficiency. Furthermore, esMPRA can directly produce analytical results and offers a standardized interface. The flexible and versatile framework of esMPRA also makes it applicable to a wide range of studies involving the quantification realized by random barcodes.
The reference list from the paper itself. Each links out to its DOI / PubMed record.
- 1Ashuach T , Fischer DS, Kreimer A et al MPR Analyze: statistical framework for massively parallel reporter assays. Genome Biol 2019;20:183.31477158 10.1186/s 13059-019-1787-z PMC 6717970 · doi ↗ · pubmed ↗
- 2Duttke SH , Guzman C, Chang M et al Position-dependent function of human sequence-specific transcription factors. Nature 2024;631:891–8.39020164 10.1038/s 41586-024-07662-z PMC 11269187 · doi ↗ · pubmed ↗
- 3Gosai SJ , Castro RI, Fuentes N et al Machine-guided design of cell-type-targeting cis-regulatory elements. Nature 2024;634:1211–20.39443793 10.1038/s 41586-024-08070-z PMC 11525185 · doi ↗ · pubmed ↗
- 4Hossain A , Lopez E, Halper SM et al Automated design of thousands of nonrepetitive parts for engineering stable genetic systems. Nat Biotechnol 2020;38:1466–75.32661437 10.1038/s 41587-020-0584-2 · doi ↗ · pubmed ↗
- 5Huang H , Liu Y, Liao W et al Oncolytic adenovirus programmed by synthetic gene circuit for cancer immunotherapy. Nat Commun 2019;10:4801.31641136 10.1038/s 41467-019-12794-2PMC 6805884 · doi ↗ · pubmed ↗
- 6Li J , Zhang P, Xi X et al Modeling and designing enhancers by introducing and harnessing transcription factor binding units. Nat Commun 2025;16:1469.39922842 10.1038/s 41467-025-56749-2PMC 11807178 · doi ↗ · pubmed ↗
- 7Magoč T , Salzberg SL. FLASH: fast length adjustment of short reads to improve genome assemblies. Bioinformatics 2011;27:2957–63.21903629 10.1093/bioinformatics/btr 507PMC 3198573 · doi ↗ · pubmed ↗
- 8Sharon E , Kalma Y, Sharp A et al Inferring gene regulatory logic from high-throughput measurements of thousands of systematically designed promoters. Nat Biotechnol 2012;30:521–30.22609971 10.1038/nbt.2205 PMC 3374032 · doi ↗ · pubmed ↗