Population pharmacokinetics and pharmacogenomics of edoxaban in Japanese adults with atrial fibrillation
Satoshi Ueshima, Daiki Hira, Sayana Matsuda, Rio Michihata, Yohei Tabuchi, Tomoya Ozawa, Hideki Itoh, Moritake Iguchi, Masaharu Akao, Takanori Aizawa, Asami Kashiwa, Satoshi Shizuta, Takeru Makiyama, Yoshihisa Nakagawa, Minoru Horie, Tomohiro Terada, Toshiya Katsura

TL;DR
This study examines how genetic factors and kidney function affect the drug levels of edoxaban in Japanese patients with atrial fibrillation.
Contribution
The study provides new insights into the pharmacokinetics of edoxaban in Japanese adults, focusing on real-world data and genetic factors.
Findings
Genetic polymorphisms in CYP3A5 and ABCB1 do not significantly affect edoxaban pharmacokinetics.
Renal function, specifically creatinine clearance, is a key factor influencing edoxaban clearance.
Population pharmacokinetic modeling confirmed a one-compartment model for edoxaban in this patient group.
Abstract
Edoxaban is used as an anti-coagulant to prevent cardioembolic infarction, deep vein thrombosis, and pulmonary embolism. Edoxaban pharmacokinetics have been reported to be affected by several factors such as renal function, age, body weight, and the concomitant use of P-glycoprotein inhibitors. However, the relationship between genetic polymorphisms in drug metabolizing enzymes and transporters and the inter-individual variability of edoxaban pharmacokinetics in patients with atrial fibrillation (AF) remains unclear. Additionally, there is little information concerning PPK analysis using real world data. In this study a population pharmacokinetic and pharmacogenomic analysis was conducted to clarify covariate factors affecting the edoxaban pharmacokinetics in Japanese adult AF patients. One hundred and thirty-one blood samples were collected from 131 patients. The edoxaban…
Genes, proteins, chemicals, diseases, species, mutations and cell lines named across the full text — each resolved to its canonical identifier and authoritative record.
Click any figure to enlarge with its caption.
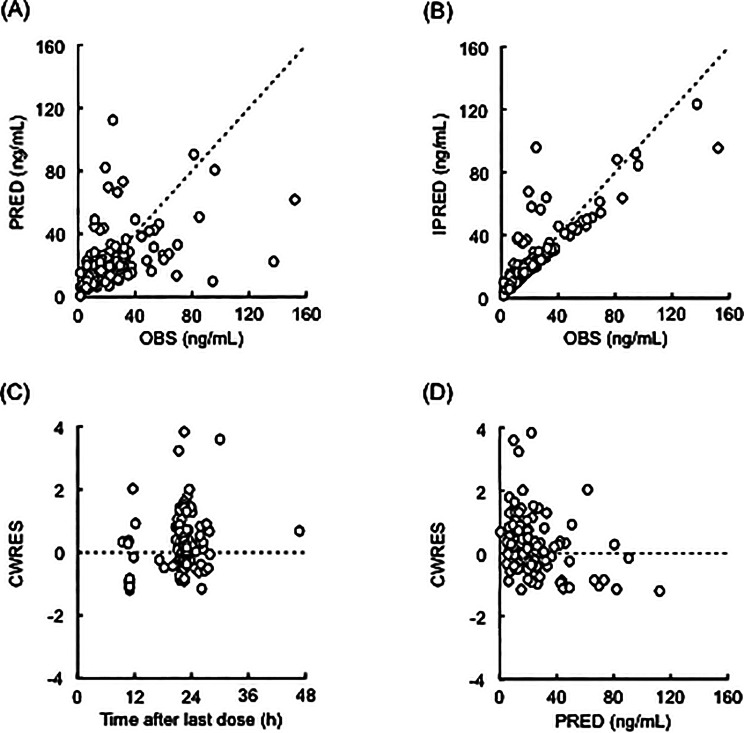 Figure 1
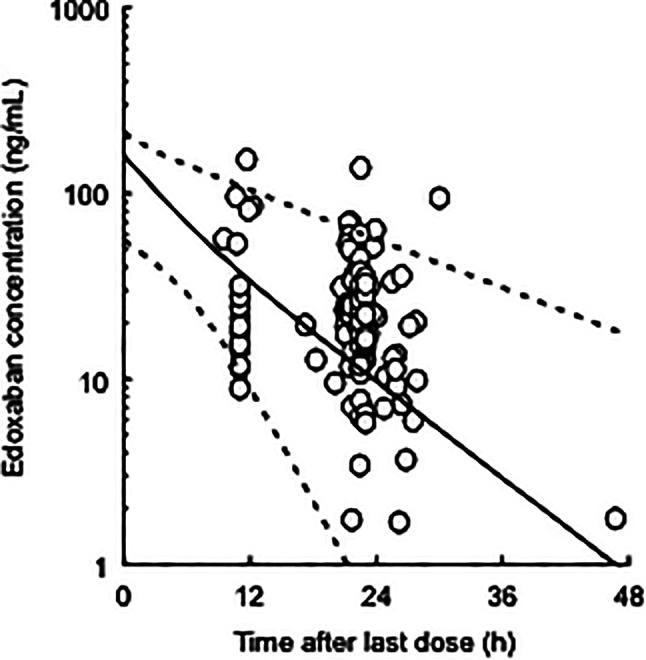 Figure 2
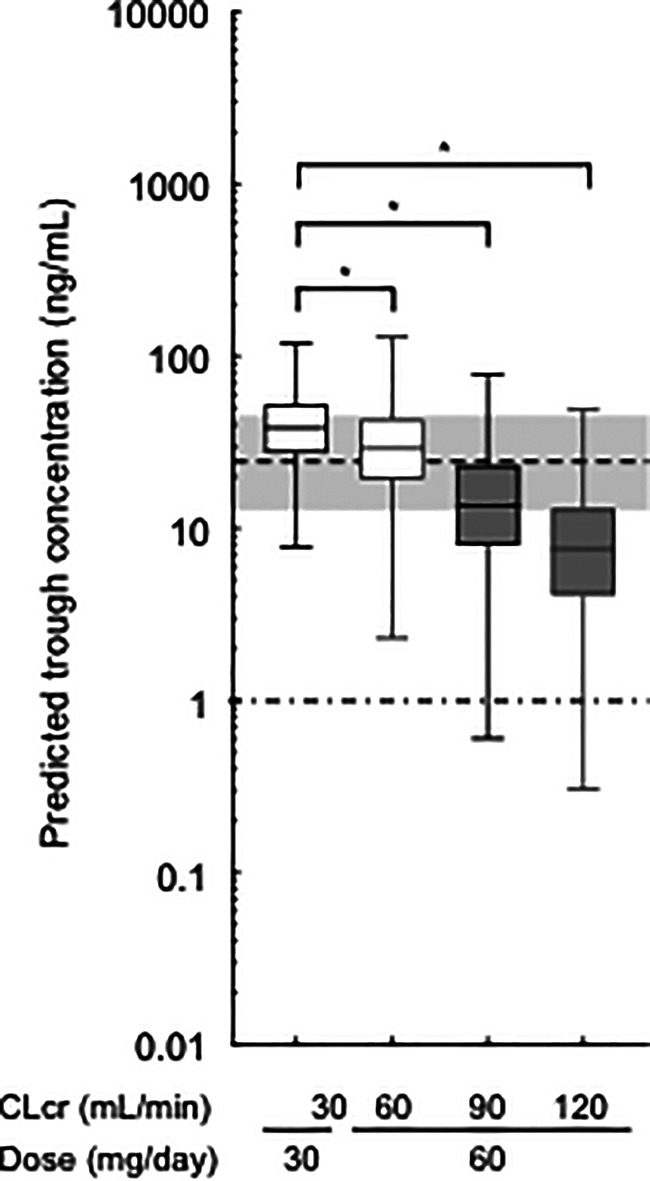 Figure 3
- —https://doi.org/10.13039/501100001691Japan Society for the Promotion of Science
- —https://doi.org/10.13039/501100002336Daiichi Sankyo Company
Peer Reviews
No public reviews on file for this paper yet. If you reviewed it on a platform where reviews are public (OpenReview, ICLR, NeurIPS, ICML), you can paste yours below so the community can read it here.
Videos
No videos yet. Explain this paper in a talk, walkthrough, or lecture? Add one.
Taxonomy
TopicsPharmacogenetics and Drug Metabolism · Potassium and Related Disorders · Drug Transport and Resistance Mechanisms
Background
Atrial fibrillation (AF) is a common arrhythmia known to be associated with the major risk factors for cardioembolic infarction [1]. The Hisayama Study, a prospective cohort study in Japan, demonstrated that the 5-year survival rate for cardioembolic infarction was lower than for lacunar or atherothrombotic infarction [2]. Edoxaban directly inhibits the activated coagulation factor X (FXa), and has been used as an anti-coagulant for cardioembolic infarction, deep vein thrombosis, and pulmonary embolism [3–5]. The ENGAGE AF-TIMI 48 clinical trial demonstrated that in AF patients, edoxaban had comparable efficacy and safety to warfarin, which has long been used as an anti-coagulant for vitamin K [4]. Unlike warfarin, it is difficult to adjust the edoxaban dosage according to anti-coagulant activity indices — such as activated partial thromboplastin time, prothrombin time, international normalized ratio of prothrombin time, and intrinsic FXa activity — as therapeutic windows of edoxaban regarding anti-coagulant activity indices have not been established [6, 7]. Several exposure-response studies suggest that the plasma trough concentration of edoxaban is associated with the incidence of bleeding, systemic embolic events, and ischemic stroke [8–10]. Therefore, monitoring the plasma trough edoxaban concentration (rather than the anti-coagulant activity indices) in AF patients may be clinically useful to ensure safer and more effective therapeutic dosages. Additionally, it is clinically significant to clarify the pharmacokinetic properties of edoxaban.
Edoxaban is a known substrate of P-glycoprotein (P-gp; ABCB1; expressed in the liver, kidneys, and small intestine) [7, 11] and the cytochrome P450 (CYP) isozymes 3A4/5, which are primarily expressed in the small intestine and liver [7, 11, 12]. Therefore, the inter-individual variability of edoxaban pharmacokinetics may be affected by the expression and/or function of these proteins. Pharmacokinetic and pharmacogenomic studies of FXa inhibitors have focused on the effects of single nucleotide polymorphisms in genes encoding drug transporters and metabolizing enzymes [13–16]. For edoxaban, ABCB1 polymorphisms were reported to have no effect on the edoxaban pharmacokinetics, while organic anion transporting polypeptide 1B1*15 polymorphism, a hepatic uptake transporter, was reported to affect the plasma concentration of M-4, an edoxaban metabolite [17, 18]. Nevertheless, the relationship between the variability of edoxaban pharmacokinetics and genetic polymorphisms of drug transporters and drug-metabolizing enzymes remains unclear.
Population pharmacokinetic (PPK) analysis is a quantitative method for explaining the inter-individual variability in drug concentrations, in which population pharmacokinetic parameters of drugs enable us to predict its concentrations using the Bayesian estimation for precision medicine. Several PPK studies of edoxaban using clinical trial data have shown that the variability of edoxaban pharmacokinetics is due to renal function, age, body weight, and the concomitant use of P-gp inhibitors (such as quinidine, verapamil, dronedarone, ketoconazole, and erythromycin) [8, 19–22]. However, a PPK and pharmacogenomic analysis of edoxaban has not been reported in AF patients and there is little information concerning PPK analysis using real world data.
This study aimed to identify covariate factors, such as the ABCB1 and CYP3A5 polymorphisms as well as clinical laboratory data, affecting edoxaban pharmacokinetics using a PPK analysis.
Methods
Patients and study design
Adult Japanese inpatients and outpatients with AF who were treated with edoxaban at Shiga University of Medical Science Hospital, National Hospital Organization Kyoto Medical Center, and Kyoto University Hospital between January 2017 and August 2019 were enrolled in this study. Edoxaban tablets (Lixiana^®^; Daiichi Sankyo Co. Ltd, Tokyo, Japan) were orally administered to all patients once daily at a dosage of 15–60 mg/day. For a total of 131 patients, blood samples were collected in 3.2% citrated tubes at a single point (9–47 h after the last edoxaban dose at steady state). Clinical data, including age, body weight, sex, serum creatinine (Scr), creatinine clearance (CLcr), alanine aminotransferase (ALT), and aspartate aminotransferase (AST) levels, and the concomitant use of CYP3A4 and/or P-glycoprotein inhibitors or inducers, were collected retrospectively from patients’ electronic medical records. The Cockcroft-Gault equation was used to calculate CLcr [23]. Physicians and pharmacists obtained data regarding drug compliance during each hospital visit or hospitalization to confirm drug exposure; patients who exhibited poor drug compliance according to their assessment, or who had no record of these measurements, were excluded from the analysis.
Edoxaban assay
Plasma specimens from patients were separated via centrifugation (2,500 g for 15 min at 4 °C) and stored at − 80 °C until analysis. The plasma concentrations of edoxaban were measured with high-performance liquid chromatography with electrospray ionization-tandem mass spectrometry by a validated external commission company (Shin Nippon Biochemical Laboratories Ltd. Pharmacokinetics and Bioanalysis Center, Wakayama, Japan). The lower limit of quantification for edoxaban was 1 ng/mL, and the inter-day variation of the analysis was < 4.4%.
Genotyping
Genomic DNA was extracted from blood samples using the DNA Extract All Reagents Kit (Applied Biosystems, Waltham, MA, USA). The *CYP3A5**3 (rs776746), and ABCB1 1236 C > T (rs1128503), 2677G > T/A (rs2032582), and 3435 C > T (rs1045642) polymorphisms were determined using a real-time polymerase chain reaction system (StepOnePlus™; Applied Biosystems), as previously described [13].
PPK modeling
PPK modeling was performed using the non-linear mixed-effects modeling (NONMEM) software (version 7.3.0; ICON Public Limited Company, Dublin, Ireland) via the first-order conditional estimation with interaction method. As there were no data on the absorption phase, a 1-compartment model without first-order absorption was employed for pharmacokinetic modeling to describe the plasma concentration-time profiles of edoxaban after oral administration (ADVAN1 TRANS2). Using an exponential error model, considering the residual variability (ε), the relationship between observed and predicted edoxaban concentrations was described as follows:
\documentclass[12pt]{minimal} \usepackage{amsmath} \usepackage{wasysym} \usepackage{amsfonts} \usepackage{amssymb} \usepackage{amsbsy} \usepackage{mathrsfs} \usepackage{upgreek} \setlength{\oddsidemargin}{-69pt} \begin{document}$${C_{ij}}=\overline {{{C_{ij}}}} \cdot \exp \left( {{\varepsilon _{ij}}} \right)$$\end{document}C_ij_ and \documentclass[12pt]{minimal} \usepackage{amsmath} \usepackage{wasysym} \usepackage{amsfonts} \usepackage{amssymb} \usepackage{amsbsy} \usepackage{mathrsfs} \usepackage{upgreek} \setlength{\oddsidemargin}{-69pt} \begin{document}$$\overline {{{C_{ij}}}} $$\end{document} are the observed and predicted edoxaban concentrations in the jth record of the ith patient, respectively. The εij was considered as random effects with a mean of 0 and variances of σ^2^. The εij in the error model was expressed as the percent coefficient of variation (CV%). The coefficient of variation of εij was fixed at the previously reported value of 58.7% by considering that for healthy subjects (14.6%) and the increment for AF patients (44.1%) [22]. The apparent oral clearance (CL/F) of edoxaban was estimated as the pharmacokinetic parameter, which was then described using the population mean parameters (θ), as in the following equation:
\documentclass[12pt]{minimal} \usepackage{amsmath} \usepackage{wasysym} \usepackage{amsfonts} \usepackage{amssymb} \usepackage{amsbsy} \usepackage{mathrsfs} \usepackage{upgreek} \setlength{\oddsidemargin}{-69pt} \begin{document}$${\left( {CL{\text{/}}F} \right)_i}={\theta _1} \cdot \exp \left( {{\eta _{1i}}} \right)$$\end{document}(CL/F)i is a CL/F of the ith patient, and η1 is the inter-individual variability of CL/F. Similarly to εij, the η1 was also considered as random effects with a mean of 0 and variances of ω^2^. The η1 in the error model was expressed as the percent coefficient of variation. Conversely, the apparent volume of distribution (Vd/F) was described by following the allometric equation using the previously reported value [22] with the exponent fixed to 1 due to a lack of individual data:
\documentclass[12pt]{minimal} \usepackage{amsmath} \usepackage{wasysym} \usepackage{amsfonts} \usepackage{amssymb} \usepackage{amsbsy} \usepackage{mathrsfs} \usepackage{upgreek} \setlength{\oddsidemargin}{-69pt} \begin{document}$${\left( {Vd{\text{/}}F} \right)_i}={\theta _2} \cdot \left( {\frac{{B{W_i}}}{{70}}} \right)=336.4 \cdot \left( {\frac{{B{W_i}}}{{70}}} \right)$$\end{document}BW_i_ is the body weight of the ith patient. The θ2 was fixed at the 336.4 L by considering the typical value of the central volume of distribution (193 L) and the fold-change for Asians (1.743 fold) [22]. Hereafter, the basic model for subsequent covariate analysis was constructed by the combination of these equations.
The influence of CLcr was first evaluated in the covariate model to develop a PPK model of edoxaban, as renal function is reported to be related to the CL/F of edoxaban [8, 19–22]. Edoxaban is known to be eliminated in the kidney and metabolized in the intestine and liver [11], and thereby the CL/F of edoxaban was evaluated as the sum of the apparent renal (CL_R_/F) and apparent non-renal (CL_NR_/F) clearances, as follows [20]:
\documentclass[12pt]{minimal} \usepackage{amsmath} \usepackage{wasysym} \usepackage{amsfonts} \usepackage{amssymb} \usepackage{amsbsy} \usepackage{mathrsfs} \usepackage{upgreek} \setlength{\oddsidemargin}{-69pt} \begin{document}$${\left( {CL{\text{/}}F} \right)_i}={\left( {C{L_R}{\text{/}}F} \right)_i}+{\left( {C{L_{NR}}{\text{/}}F} \right)_i}$$\end{document}A covariate analysis was performed to evaluate the effect of CLcr on CL_R_/F using the following equations:
\documentclass[12pt]{minimal} \usepackage{amsmath} \usepackage{wasysym} \usepackage{amsfonts} \usepackage{amssymb} \usepackage{amsbsy} \usepackage{mathrsfs} \usepackage{upgreek} \setlength{\oddsidemargin}{-69pt} \begin{document}$${\left( {C{L_R}{\text{/}}F} \right)_i}={\theta _1} \cdot {\left( {\frac{{CLc{r_i}}}{{CLc{r_{median}}}}} \right)^{{\theta _3}}}$$\end{document} \documentclass[12pt]{minimal} \usepackage{amsmath} \usepackage{wasysym} \usepackage{amsfonts} \usepackage{amssymb} \usepackage{amsbsy} \usepackage{mathrsfs} \usepackage{upgreek} \setlength{\oddsidemargin}{-69pt} \begin{document}$${\left( {C{L_R}{\text{/}}F} \right)_i}={\theta _1} \cdot \left( {\frac{{CLc{r_i}}}{{CLc{r_{median}}}}} \right)$$\end{document}CLcr_i_ and CLcr_median_ are the CLcr of the ith patient and median CLcr, respectively, while θ3 is the population mean estimate. Based on the lowest objective function value (OBJ), calculated using the NONMEM software, the covariate models incorporating the CLcr value were selected. After performing the covariate analysis for CLcr, continuous covariates — such as ALT and AST levels, age, and body weight of patients for the parameter CL_R_/F and CL_NR_/F — were normalized by each population median using the following power function or linear model:
\documentclass[12pt]{minimal} \usepackage{amsmath} \usepackage{wasysym} \usepackage{amsfonts} \usepackage{amssymb} \usepackage{amsbsy} \usepackage{mathrsfs} \usepackage{upgreek} \setlength{\oddsidemargin}{-69pt} \begin{document}$${P_i}={\theta _4} \cdot {\left( {\frac{{CO{V_i}}}{{CO{V_{median}}}}} \right)^{{\theta _5}}}$$\end{document} \documentclass[12pt]{minimal} \usepackage{amsmath} \usepackage{wasysym} \usepackage{amsfonts} \usepackage{amssymb} \usepackage{amsbsy} \usepackage{mathrsfs} \usepackage{upgreek} \setlength{\oddsidemargin}{-69pt} \begin{document}$${P_i}={\theta _4} \cdot \left( {\frac{{CO{V_i}}}{{CO{V_{median}}}}} \right)$$\end{document}P_i_ is CL_R_/F or CL_NR_/F, and COV_i_ and COV_median_ are the covariate of the ith patient and median of the covariate, respectively; θ4 and θ5 are population mean estimates. For categorical covariates, such as sex, concomitant CYP3A4 and/or P-glycoprotein inhibitor use, genetic polymorphisms in ABCB1 and CYP3A5, and haplotype of ABCB1 with 2677G > T/A and 3435 C > T, the dichotomous parameter A is set to 0 for the normal classification, and 1 for the other classification in each individual, as follows:
\documentclass[12pt]{minimal} \usepackage{amsmath} \usepackage{wasysym} \usepackage{amsfonts} \usepackage{amssymb} \usepackage{amsbsy} \usepackage{mathrsfs} \usepackage{upgreek} \setlength{\oddsidemargin}{-69pt} \begin{document}$${P_i}={\theta _4} \cdot \theta _{6}^{A}$$\end{document}For example, in the case of genetic polymorphisms, if a patient had a specific genotype, the parameter A was set to 1; if not, it was set to 0. Covariates were added to the basic model or the model involving CLcr via a forward stepwise selection method; statistical significance was set at 0.05, with 1 degree of freedom if the OBJ decreased by > 3.84. Subsequently, using a backward stepwise selection method, covariates were removed from the full model; statistical significance was set at 0.01, with 1 degree of freedom if the OBJ decreased by > 6.63. In addition to decrease in OBJ values, covariates for the CL_R_/F and CL_NR_/F of edoxaban were also selected based on their 95% confidence intervals for the effect sizes (θ3 in Eq. 5, θ5 in Eq. 7, and θ6 in Eq. 9) in covariate models. In a forward or backward stepwise selection process, we judged that these covariate models did not affect these parameters of edoxaban if the 95% confidence intervals for θ3 and θ5, and θ6 included 0, 0, and 1, respectively.
Model evaluation
To evaluate the adequacy of the models, the following goodness-of-fit plots were used: observed (OBS) versus population predicted value (PRED); OBS versus individual predicted value (IPRED); conditional weighted residuals (CWRES) versus time after the last dose; and CWRES versus PRED. To evaluate the final model for edoxaban, the prediction-corrected visual predictive check (pcVPC) and non-parametric bootstrap analysis were used. In the VPC analysis, 1,000 hypothetical datasets were simulated via random sampling using the NONMEM program. The median value and 90% prediction interval of the simulated concentrations were plotted using the observed concentrations. In the bootstrap analysis, 1,000 replication datasets were generated by random sampling using Perl-speaks-NONMEM version 4.7.0 [24]. The median and 95% prediction intervals using bootstrap analysis were compared, with the estimates of each PPK parameter obtained using the final model.
Model-based simulation
The Monte Carlo simulation was used to evaluate the impact of CLcr on the steady-state trough concentration (24 h after the last dose) of edoxaban. Using the NONMEM program, 1,000 pharmacokinetic profiles were simulated for patients with various genetic polymorphisms and CLcr values (30, 60, 90, and 120 mL/min). The oral dosing schedules of edoxaban were set according to the package insert. The oral dosage of edoxaban was set to 30 mg/day if a patient had a CLcr value of 30 mL/min; otherwise, the dosage was set to 60 mg/day.
Statistical analysis
Unless otherwise indicated, data were expressed as median values. The statistical significance of differences among 4 groups was analyzed using the Kruskal-Wallis test, followed by Dunn’s post hoc test using the Prism 6 software (GraphPad Software, San Diego, California, United States). The χ2 test was employed to evaluate the distribution of the polymorphic alleles based on the Hardy-Weinberg equilibrium. A probability value < 0.05 was considered statistically significant.
Results
Patient characteristics
In total, 131 observations from 131 patients were included in this study; their characteristics and the distribution of each genotype are summarized in Table 1. All allele frequencies in this study were consistent with the Hardy-Weinberg equilibrium.
Table 1. Clinical characteristics and demographics of AF Patients^a^Number of patients131Number of measurements131Sex (male/female)83/48Age (years)72.2 (35.2 − 92.6)Body weight (kg)61.4 (37.3 − 97.3)Number of patients administered edoxaban (15 mg/day, 30 mg/day, 60 mg/day)3, 70, 58Plasma concentration of edoxaban (ng/mL)19.5 (1.7 − 152.0)Serum creatinine (mg/dL)0.89 (0.56 − 2.00)Creatinine clearance (mL/min)61.8 (20.0 − 135.5)Aspartate amino transferase (IU/L)25 (11 − 92)Alanine amino transferase (IU/L)19 (5 − 77)Number of patients treated with CYP3A4 and/or P-glycoprotein inhibitor Amiodarone, Diltiazem, Verapamil5, 6, 5Number of patients with CYP3A5 and/or ABCB1 genotypes ABCB1 1236 C > T (C/C, C/T, T/T)56, 56, 19 ABCB1 2677G > T/A (G/G, G/T, G/A, A/A, T/A, T/T)18, 20, 48, 23, 19, 3 ABCB1 3435 C > T (C/C, C/T, T/T)43, 65, 23 *CYP3A5**3 (*1/*1, *1/*3, *3/*3)2, 38, 91^a^ Data are presented as the number or median with the range in parentheses
PPK modeling
The relationship between the CLcr and CL/F of edoxaban was first analyzed using the covariate model. When compared with the basic model, the OBJ values, with covariate models incorporating CLcr with Eqs. 5 and 6, significantly decreased by 89.8 and 69.6 respectively. Thus, the covariate model incorporating CLcr with Eq. 4 was the most reasonable to characterize the relationship between CL_R_/F and CLcr. Additionally, the stepwise forward inclusion and backward elimination method showed that CLcr significantly affected the CL_NR_/F of edoxaban, whereas covariates such as AST, ALT, concomitant CYP3A4 and/or P-glycoprotein inhibitors, CYP3A5 and ABCB1 genotypes, and haplotype of ABCB1 with 2677G > T/A and 3435 C > T did not significantly affect that of edoxaban. Additionally, there were no covariates affecting the CL_NR_/F of edoxaban in Eqs. 7 and 8.
Table 2 shows the final PPK parameter estimates of edoxaban in Japanese AF patients. The CL/F of edoxaban was estimated using the following PPK model:
Table 2PPK parameter estimates for Edoxaban in AF patients^a^ParametersOriginal data1,000 Bootstrap sample dataMean95% Confidence intervalMedian2.5th to 97.5th percentiles \documentclass[12pt]{minimal} \usepackage{amsmath} \usepackage{wasysym} \usepackage{amsfonts} \usepackage{amssymb} \usepackage{amsbsy} \usepackage{mathrsfs} \usepackage{upgreek} \setlength{\oddsidemargin}{-69pt} \begin{document}$$CL{\text{/}}F\,\,(L{\text{/}}h)={\theta _1} \cdot {\left( {\frac{{CLcr}}{{61.8}}} \right)^{{\theta _3}}}$$\end{document}
\documentclass[12pt]{minimal} \usepackage{amsmath} \usepackage{wasysym} \usepackage{amsfonts} \usepackage{amssymb} \usepackage{amsbsy} \usepackage{mathrsfs} \usepackage{upgreek} \setlength{\oddsidemargin}{-69pt} \begin{document}$${\theta _1}\,\,(L{\text{/}}h)$$\end{document} 28.226.9−29.528.126.6−29.3 \documentclass[12pt]{minimal} \usepackage{amsmath} \usepackage{wasysym} \usepackage{amsfonts} \usepackage{amssymb} \usepackage{amsbsy} \usepackage{mathrsfs} \usepackage{upgreek} \setlength{\oddsidemargin}{-69pt} \begin{document}$${\theta _3}$$\end{document} 0.6920.582−0.8010.6930.578−0.804 \documentclass[12pt]{minimal} \usepackage{amsmath} \usepackage{wasysym} \usepackage{amsfonts} \usepackage{amssymb} \usepackage{amsbsy} \usepackage{mathrsfs} \usepackage{upgreek} \setlength{\oddsidemargin}{-69pt} \begin{document}$$Vd/F\,\,(L)={\theta _2} \cdot \left( {\frac{{BW}}{{70}}} \right)$$\end{document}
\documentclass[12pt]{minimal} \usepackage{amsmath} \usepackage{wasysym} \usepackage{amsfonts} \usepackage{amssymb} \usepackage{amsbsy} \usepackage{mathrsfs} \usepackage{upgreek} \setlength{\oddsidemargin}{-69pt} \begin{document}$${\theta _2}\,\,\left( L \right)$$\end{document} 336.4 fixed−336.4 fixed−Inter- and residual variabilities ^b, c^ω1 (CV%)26.4 (27.4)18.8−34.025.916.4−32.7σ (CV%)58.7 fixed−58.7 fixed−^a^The θ2 and σ values were set to the literature values [22]^b^The ω1 and σ values were expressed as the coefficient of variations of the inter-individual variability for CL/F and residual variability, respectively^c^This value was presented as the mean with the shrinkage (%) in parenthesisBW; body weight; CLcr, creatinine clearance; CL/F, apparent oral clearance; Vd/F, the apparent volume of distribution; θ, population mean parameters
\documentclass[12pt]{minimal} \usepackage{amsmath} \usepackage{wasysym} \usepackage{amsfonts} \usepackage{amssymb} \usepackage{amsbsy} \usepackage{mathrsfs} \usepackage{upgreek} \setlength{\oddsidemargin}{-69pt} \begin{document}$$CL{\text{/}}F\,\,\left( {L{\text{/}}\text{h}} \right)=28.2 \cdot {\left( {\frac{{CLcr}}{{61.8}}} \right)^{0.692}}$$\end{document}The population mean of CL_NR_/F was constant, and calculated to be 0.01 L/h. Therefore, this value was judged to be negligible. A non-linear correlation existed between the CL/F of edoxaban and CLcr. The population mean of CL/F for a typical patient (CLcr value of 61.8 mL/min) was estimated to be 28.2 L/h, and the coefficient of variation of the inter-individual variability in CL/F was 26.4%.
Model evaluation
Figure 1 shows the goodness-of-fit plots for the final pharmacokinetic model. The OBS correlated with PRED, and the relationship between OBS and IPRED approached the line of identity. No obvious deviation was observed in the plots of CWRES against time after the last dose, and PRED. Additionally, the median values of the PPK parameters from 1,000 bootstrap re-samplings were similar to the mean estimates in the final pharmacokinetic model (Table 2). The pcVPC plot for plasma edoxaban concentrations versus time after the last dose indicated reasonable predictability of the final pharmacokinetic model (Fig. 2).
Fig. 1. Goodness-of-fit plots for the final pharmacokinetic model of edoxaban. The observed plasma concentrations (OBS) versus population predictions (PRED; panel A) or individual predictions (IPRED; panel B) are shown, as well as conditional weighted residuals (CWRES) versus the time after the last dose (panel C) or PRED (panel D). Open circles show the observed values, and each dotted line shows a line of identity
Fig. 2. Prediction-corrected visual predictive check plot for the final pharmacokinetic model of edoxaban. Open circles show the observed concentrations. The top dotted, middle solid, and bottom dotted lines represent the 95th, 50th, and 5th percentiles, respectively, calculated from 1,000 simulated datasets
Model-based simulation
Figure 3 shows the simulated steady-state trough concentrations of edoxaban using the final PPK parameters. These predicted concentrations were consistent with previously observed concentrations (median: 25.0 ng/mL, inter-quartile range: 13.9–47.4 ng/mL) [10].
Fig. 3. Simulations of trough concentrations of edoxaban using the final pharmacokinetic model. The 1000 replication datasets of a patient administering a typical dose of 30 or 60 mg once daily were simulated. These simulations were conducted using the final pharmacokinetic model. Box-and-whisker plots are presented according to three quartiles and the minimum and maximum values. The gray shaded area and the dotted line show the interquartile range and median trough concentration in Asians reported by Chao et al. [10], respectively. The chain line shows the lower limit of quantification (1 ng/mL) in this study. * P < 0.001 via the Kruskal-Wallis test, followed by Dunn’s multiple comparison test
Discussion
In this study, we examined the impact of ABCB1 and CYP3A5 polymorphisms and clinical laboratory data on pharmacokinetic parameters of edoxaban via non-linear mixed-effects modeling. To the best of our knowledge, this is the first PPK and pharmacogenomic analysis of edoxaban to see if genetic polymorphisms of drug metabolizing enzymes and drug transporters affect edoxaban pharmacokinetics.
Multiple pharmacokinetic parameters could not be mathematically estimated due to only a single sampling data on the elimination phase. Previous studies have suggested that sampling points at peak concentration of drug and on the elimination phase were required to accurately estimate the means of Vd/F and CL/F, respectively, for a one-compartment model without first-order absorption [25–27]. Therefore, in this study, the CL/F of edoxaban was estimated whereas the Vd/F was fixed at the reported value for Asian in the clinical trial [22]. Several PPK studies of edoxaban have reported that the correlation between the CLcr and CL/F of edoxaban can be described using a linear [8, 20, 22] or power [19] model. As shown in Table 2, our analysis demonstrated a non-linear correlation between CL/F and CLcr, suggesting that our model is similar to those in previous studies.
The CL/F value of edoxaban for a typical patient (CLcr = 61.8 mL/min) was 28.2 L/h in this study, which is comparable to the population mean in previous PPK studies (24.7–32.1 L/h) [8, 19, 21]. The population mean of CL_NR_/F in this study was too small compared with that of CL_R_/F, in which the CL/F of edoxaban was approximated as its CL_R_/F. On the contrary, the reported CL_R_ value of edoxaban was estimated to be 10.7 L/h in healthy subjects after intravenous administration; this corresponds with 49.1% of its CL [28], suggesting that the CL_NR_/F of edoxaban is unable to be negligible. In this study, it was difficult to separately estimate the CL_R_/F and CL_NR_/F of edoxaban due to no collection of its urine and metabolite samples. The CL/F values of edoxaban in patients with normal renal function (CLcr = 100 mL/min), mild (CLcr = 60 mL/min) and severe (CLcr = 30 mL/min) renal impairment using our final pharmacokinetic model were estimated to be 39.3 L/h, 27.6 L/h, and 17.1 L/h, respectively. These values are comparable to previously reported values (normal renal function: 34.6 L/h; mild renal impairment: 24.8 L/h; severe renal impairment: 18.5 L/h) [22]. Additionally, bootstrap, pcVPC showed that the final pharmacokinetic model provided a robust and unbiased fit to the data (Fig. 2; Table 2). As shown in Fig. 3, simulation analysis suggested that the predicted trough concentrations of edoxaban in hypothetical patients with CLcr value of 90 and 120 mL/min using the final PPK parameters tended to be lower than the median of previously observed concentrations [10]. However, the predicted concentrations were considered to be generally consistent with previously observed concentrations.
In this study, AST and ALT levels did not affect the edoxaban pharmacokinetics, which is comparable with a clinical study on the effect of mild or moderate hepatic impairment on edoxaban pharmacokinetics [29]. These results suggest that the edoxaban dose for patients with mild or moderate hepatic impairment is similar to that for patients with normal hepatic function.
Considering an edoxaban CL_R_ value of 10.7 L/h in healthy subjects, and its protein binding value of 0.55 [22], the CL_R_ value of edoxaban corrected by the unbound edoxaban concentration was calculated to be 396. 3 mL/min, which is higher than the normal glomerular filtration rate of approximately 100 mL/min. Drug-drug interactions between edoxaban and P-gp inhibitors (quinidine, verapamil, amiodarone, dronedarone, cyclosporine, ketoconazole, and erythromycin) [30, 31] or inducers (rifampicin) [32] were observed in healthy subjects. These results suggest that the variation of the expression and/or function of ABCB1 can partly account for the variability of edoxaban pharmacokinetics. The effects of the ABCB1 polymorphisms on pharmacokinetics of drugs remains controversial, even when the same drugs — such as cyclosporine [33–35], digoxin [36–38] and tacrolimus [39–41] — are evaluated. The effect of the haplotype with ABCB1 2677G > T/A and 3435 C > T polymorphisms on pharmacokinetics of drugs has been examined since these polymorphisms were known to show strong linkage disequilibrium [42]. However, contradictory results have been reported concerning the association of this haplotype with the pharmacokinetics of drugs such as cyclosporin [43, 44] and tacrolimus [39, 45, 46]. In the present study, the ABCB1 1236 C > T, 2677G > T/A, and 3435 C > T polymorphisms, and the haplotype with ABCB1 2677G > T/A, and 3435 C > T did not affect the edoxaban pharmacokinetics. This is consistent with previous pharmacogenomic studies of edoxaban indicating the lack of effect of ABCB1 genotypes on the plasma trough concentration of edoxaban [17, 18]. Therefore, at least three ABCB1 genotypes are unlikely to be associated with the efflux of edoxaban via P-gp.
The *CYP3A5**3 polymorphism also had no effect on the edoxaban pharmacokinetics, which is consistent with a previous pharmacogenomic study of edoxaban [18]. These results support the finding that edoxaban is metabolized via CYP3A4/5 to form M-4, although the exposure of M-4 is < 10% of the total exposure of edoxaban [11].
The concomitant use of P-gp and/or CYP3A4 inhibitors (amiodarone, diltiazem, and verapamil) did not affect the CL/F of edoxaban, which is contrary to the results in previous drug-drug interaction studies [30, 31]. It was reported that concomitant use of quinidine, amiodarone, verapamil, and dronedarone increased the area under the concentration-time curve of edoxaban and its maximum plasma concentration, while concomitant use of these drugs did not increase its plasma concentration at 24 h after oral administration [30]. A previous PPK study indicated that the concomitant use of P-gp inhibitors (including quinidine, verapamil, dronedarone, ketoconazole, and erythromycin) had impacts on both the CL/F and bioavailability of edoxaban [22]. These results suggested that the impacts of P-gp and/or CYP3A4 inhibitors on both the CL/F and bioavailability of edoxaban may be associated with drug–drug interactions in intestinal absorption or metabolism via CYP3A4 in the small intestine and liver. In the present study, the effect of P-gp and/or CYP3A4 inhibitors on the bioavailability and CL/F of edoxaban could not be detected in our PPK model, as there were no data on the absorption phase.
Our study has several limitations. First, in the PPK analysis, the parameters such as Vd/F and absorption rate constant were not estimated due to only one sampling data on the elimination phase in each patient. Second, the population mean of CL_NR_/F could be underestimated due to a lack of data on urine and metabolite samples as well as one sampling data in each patient, which may lead to the potential biases in estimating its CL/F. However, considering the mental and physical burden of patients, it is difficult to obtain multiple sampling on the absorption phase and urine samples from patients in clinical practice. Third, the number of patients with *CYP3A51/*1 genotype and patients treated with CYP3A4 and/or P-glycoprotein inhibitor were small. Therefore, the PPK and pharmacogenomic study of edoxaban in a larger number of Japanese population and plasma samples including metabolites in each patient should be conducted in the future to estimate parameters accurately and examine the effect of *CYP3A53 genotype and CYP3A4 and/or P-glycoprotein inhibitor on edoxaban pharmacokinetics in more detail.
Conclusions
Our results suggest that genetic polymorphisms of CYP3A5 and ABCB1 are not considered intrinsic factors for edoxaban pharmacokinetics in Japanese AF patients. These results may help to prevent adverse events without reference to genetic polymorphisms of CYP3A5 and ABCB1 and to provide individualized anticoagulant therapy with edoxaban.