Using Personalized Intervention Criteria in a Mobile Just-in-Time Adaptive Intervention for Increasing Physical Activity in University Students: Pilot Study
Mai Ikegaya, Jerome Clifford Foo, Taiga Murata, Kenta Oshima, Jinhyuk Kim

TL;DR
A pilot study tested personalized vs. uniform criteria for mobile interventions to boost physical activity in university students, finding short-term benefits with personalized approaches.
Contribution
This study is one of the first to compare personalized versus uniform criteria in JITAI for physical activity, highlighting the potential of precision health approaches.
Findings
Personalized intervention criteria (PIC) increased physical activity more than uniform criteria (UIC) in the first hour after intervention.
Over the course of a week, JITAI did not significantly increase overall physical activity levels.
PIC led to more calories burned, steps taken, and distance moved compared to UIC in the first hour.
Abstract
While the health benefits of physical activity are well-known, adherence to regular physical activity remains a major challenge. Just-in-time adaptive intervention (JITAI) has been proposed as one method to increase physical activity by delivering an intervention at a time when individuals are more likely to make behavioral changes. However, most studies that have implemented JITAI have used uniform intervention criteria (UIC) across participants rather than personalized intervention criteria (PIC) for the individual. The objective of this paper was to examine the effectiveness of using JITAI implemented with PIC to increase physical activity. Healthy university students wore a wrist activity monitor for 2 weeks. Participants were divided into 2 groups, which received JITAI to promote physical activity according to either PIC or UIC. In the first week, the mean distance moved and…
Genes, proteins, chemicals, diseases, species, mutations and cell lines named across the full text — each resolved to its canonical identifier and authoritative record.
Click any figure to enlarge with its caption.
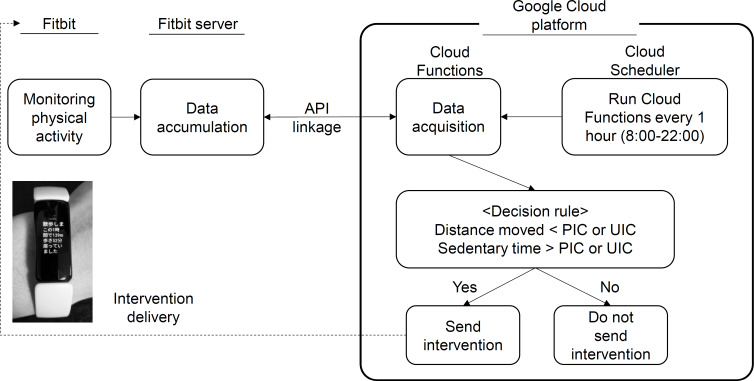 Figure 1
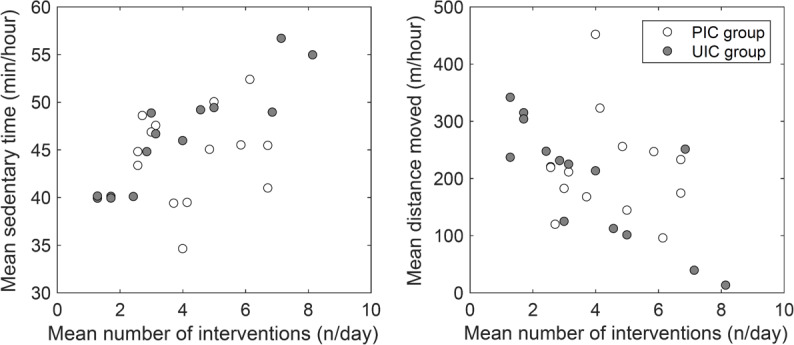 Figure 2
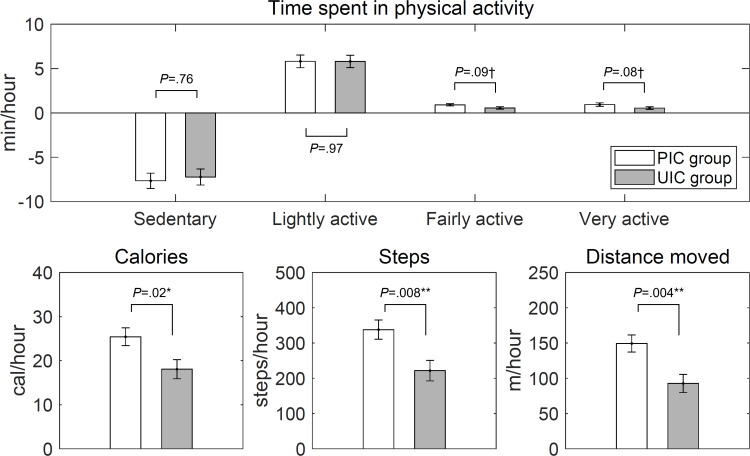 Figure 3
| Characteristics | All participants (n=28) | PIC | UIC | |||
|---|---|---|---|---|---|---|
| Age (years), mean (SD) | 20.6 (1.7) | 20.6 (1.4) | 20.6 (1.2) | 0.00 (26) | — | ≥.99 |
| Height (cm), mean (SD) | 166.2 (7.3) | 168.2 (6.9) | 164.3 (7.2) | 1.41 (26) | — | .17 |
| Weight (kg), mean (SD) | 54.8 (6.6) | 53.3 (5.7) | 56.3 (7.2) | −1.18 (26) | — | .25 |
| BMI (kg/m2), mean (SD) | 19.8 (1.9) | 18.8 (1.1) | 20.8 (2.0) | –3.24 (26) | — | .003 |
| Sex |
| 210.58 (1) | .45 | |||
| Male, n (%) | 16 (57) | 9 (64) | 7 (50) | |||
| Female, n (%) | 12 (43) | 5 (36) | 7 (50) |
| ID | Distance moved (m) | Sedentary time (min) |
|---|---|---|
| PIC | 151 | 50 |
| PIC2 | 127 | 52 |
| PIC3 | 125 | 52 |
| PIC4 | 164 | 46 |
| PIC5 | 263 | 41 |
| PIC6 | 105 | 51 |
| PIC7 | 93 | 55 |
| PIC8 | 152 | 50 |
| PIC9 | 148 | 50 |
| PIC10 | 140 | 51 |
| PIC11 | 39 | 56 |
| PIC12 | 18 | 57 |
| PIC13 | 57 | 55 |
| PIC14 | 294 | 42 |
| UIC | 139 | 52 |
| Physical activity | PIC | UIC | ||||
|---|---|---|---|---|---|---|
| Before intervention | After intervention | Before intervention | After intervention | |||
| Sedentary time (min), mean (SE) | 55.83 (0.54) | 48.21 (1.07) | <.001 | 57.11 (0.58) | 49.88 (1.10) | <.001 |
| Lightly active time (min), mean (SE) | 4.02 (0.53) | 9.80 (0.94) | <.001 | 2.95 (0.56) | 8.76 (0.97) | <.001 |
| Fairly active time (min), mean (SE) | −0.04 (0.10) | 0.86 (0.10) | <.001 | 0.08 (0.11) | 0.65 (0.11) | .003 |
| Very active time (min), mean (SE) | 0.01 (0.12) | 0.95 (0.12) | <.001 | 0.04 (0.13) | 0.59 (0.13) | .01 |
| Calories (kcal), mean (SE) | 74.54 (3.08) | 99.83 (3.08) | <.001 | 68.97 (3.24) | 87.10 (3.24) | <.001 |
| Steps (n), mean (SE) | 66.35 (28.70) | 403.35 (28.70) | <.001 | 63.80 (30.48) | 285.67 (30.48) | <.001 |
| Distance moved (m), mean (SE) | 26.82 (12.52) | 175.70 (12.52) | <.001 | 27.06 (13.31) | 119.85 (13.31) | <.001 |
| Physical activity | PIC group | UIC group | ||||
|---|---|---|---|---|---|---|
| Week 1 | Week 2 | Week 1 | Week 2 | |||
| Sedentary time (min), mean (SE) | 43.01 (1.36) | 42.26 (1.36) | .55 | 44.82 (1.36) | 45.38 (1.36) | .76 |
| Lightly active time (min), mean (SE) | 14.01 (1.19) | 14.52 (1.12) | .92 | 12.81 (1.19) | 11.94 (1.12) | .69 |
| Fairly active time (min), mean (SE) | 1.48 (0.21) | 1.75 (0.29) | .67 | 1.35 (0.21) | 1.70 (0.30) | .50 |
| Very active time (min), mean (SE) | 1.44 (0.19) | 1.41 (0.19) | ≥.99 | 1.06 (0.19) | 1.02 (0.19) | ≥.99 |
| Calories (kcal), mean (SE) | 116.91 (4.36) | 119.06 (5.81) | .94 | 106.99 (4.34) | 105.32 (5.80) | .97 |
| Steps (steps), mean (SE) | 590.46 (58.36) | 564.56 (62.62) | .94 | 525.15 (58.00) | 497.16 (62.50) | .93 |
| Distance moved (m), mean (SE) | 257.31 (26.14) | 245.49 (27.81) | .93 | 230.32 (25.98) | 214.77 (27.75) | .85 |
Peer Reviews
No public reviews on file for this paper yet. If you reviewed it on a platform where reviews are public (OpenReview, ICLR, NeurIPS, ICML), you can paste yours below so the community can read it here.
Videos
No videos yet. Explain this paper in a talk, walkthrough, or lecture? Add one.
Taxonomy
TopicsPhysical Activity and Health · Mobile Health and mHealth Applications · Obesity, Physical Activity, Diet
Introduction
The benefits of physical activity for prevention and management of chronic diseases and mortality have been well established [1-3]. To promote physical activity for better health, the World Health Organization (WHO) has recommended 150‐300 minutes of moderate-intensity aerobic physical activity per week, or 75‐150 minutes of vigorous-intensity aerobic physical activity throughout the week, or an equivalent combination of moderate- to vigorous-intensity activity [4]. However, a pooled analysis of 507 population-based surveys (n=5.7 million) found that 31.3% of adults worldwide do not meet this recommended amount of physical activity [5]. Low levels of daily physical activity have become a global health problem, and methods to increase physical activity using mobile health (mHealth) have started to be implemented [6-8].
mHealth is defined as health care services supported through the use of mobile devices such as mobile phones [9]. The aim of mHealth is to enhance users’ health and well-being through mobile devices and other wireless technologies by monitoring and analyzing their health status, providing support for disease prevention and treatment, and management and introduction of interventions for disease in everyday environments [10]. Previous studies incorporating mHealth interventions have shown beneficial effects in promoting health behaviors and support for behavioral change (eg, increasing physical activity [91112]).
Just-in-time adaptive intervention (JITAI) is an intervention design that adapts the timing, type, and intensity of intervention support to changes in an individual’s status and behavior [13]. The goal is to provide support at the timing and in the context that the individual most needs and is most likely to accept it. JITAI has shown promising effects for improving physical activity in research settings. For example, van Dantzig et al [14] found that when they encouraged a 5-minute break after 60 minutes of continuous sitting, the amount of sedentary time decreased. Finkelstein et al [15] found that reminders promoting exercise sent when participants took 15 or fewer steps per hour significantly decreased sedentary behavior compared to when they did not receive reminders. Bond et al [16] found that 3-minute break reminders after 30 minutes of sitting decreased sedentary time and significantly increased the amount of time spent doing light physical activity compared to no reminder. Fiedler et al [17] found that delivering the prompt when the participant was inactive for more than 60 minutes significantly increased moderate to vigorous physical activity (MVPA). Mair et al [18] showed the feasibility of using personalized smartphone-delivered JITAI in elderly people. JITAI was tailored to the individual based on real time physical activity, daily physical activity goal, time of day, and weather conditions [18].
In most JITAI studies to date, however, the criteria for the intervention have been uniform (eg, 15 steps fewer per hour and sitting continuously for 30 or 60 minutes), and have not reflected the different activity patterns of the individual [1218]. Uniform intervention criteria (UIC) do not accommodate varying levels of preexisting physical activity, and as such may not be the most effective way to promote uptake. In this study, we compared the effects of increasing activity in groups that received physical activity interventions using UIC versus groups that received an intervention using personalized intervention criteria (PIC) tailored to the individual’s activity patterns. We hypothesize that the intervention using PIC is more effective in increasing physical activity than the intervention using UIC.
Methods
Participants
A total of 31 healthy university students in Japan aged 18‐23 years old participated in the study. Healthy university students under 30 years of age were eligible to be included in the study. Participants who had current medical problems or were using medication that could influence physical activity were not eligible to participate. This prospective 2-week randomized comparative study took place between December 2022 and January 2023. The participants were randomly assigned into 2 groups in a 1:1 ratio by using a random number table (integers 0 and 1): PIC group, which received the intervention with personalized intervention criteria, and UIC group, which received the intervention with uniform intervention criteria. While a within-persons design was considered (both PIC and UIC in a single individual), due to the time limitations and potential mixing of effects of both types of intervention criteria, a between-persons design was used. Details are reported in the CONSORT-EHEALTH V 1.6.1 checklist (see Checklist 1).
Ethical Considerations
The study was approved by the institutional review board at Shizuoka University, Japan (19‐8). Participants provided written informed consent after receiving a full explanation about the purpose of the study, methods, and precautions for participation in the study. Participants who completed the study received an Amazon gift card worth JP ¥5000 (approximately US $35).
All procedures performed in studies involving human participants were in accordance with the ethical standards of the institutional and national research committee. Participants provided written informed consent. All data used in this study were anonymized to protect participants’ privacy and ensure confidentiality.
Assessments
Questionnaires
Participants completed a questionnaire before the 2-week study to collect their age, sex, height, weight, medical history, and drug use. Participants who had current medical problems or used medication were excluded from the study.
Activity Monitor
Physical activity was measured using a wrist-worn wearable activity monitor (Fitbit Inspire 2). The active monitor estimates sedentary time (minutes), lightly active time (minutes), fairly active time (minutes), very active time (minutes), calories (kcal), steps (n), and distance moved (m). Steps are calculated by the 3-axis accelerometer, while distance moved is automatically calculated based on the number of steps and the participant’s stride length. Time spent at different activity levels are also calculated by the activity monitor (sedentary time, lightly active time, fairly active time, and very active time). Activity monitor and participant’s smartphone were synchronized via Bluetooth by installing the Fitbit app on their smartphones, and activity data were recorded on the Fitbit server via the smartphone. The activity monitor was worn on the nondominant wrist at all times during the study period. Participants were instructed to remove the monitors when showering or bathing.
Intervention
Intervention Criteria (PIC vs UIC)
The intervention criteria used were distance moved (m) and sedentary time (minutes). For distance moved, 1 SD lower than the mean (mean distance, SD) was used, and for sedentary time, 1 SD longer than the mean (mean sedentary time + SD) were used. The reason for extending the intervention criteria to include SD rather than using only the mean of physical activity was to ensure that interventions are not triggered when activity levels differed only slightly from the mean. That is, interventions might be too frequent and difficult to adhere to if the threshold was strictly set at the mean values.
Set points for interventions were determined differently for the 2 groups. PIC group received interventions based on individual activity data measured during week 1. The UIC group received interventions based on group data from a 2-week preliminary study conducted a year earlier using the same devices looking at physical activity in a sample of university students (n=47). The UIC were determined using a different sample because the timing of the study period was different for each participant; participants were recruited and participated during different dates so the UIC could not be calculated at the start of the intervention period for all participants.
Intervention Structure and Flow
Figure 1 shows the intervention structure and flow. The intervention was performed using the tools “Cloud Functions” and “Cloud Scheduler” of the Google Cloud platform via the Fitbit application programming interface (API). Cloud Functions is a serverless runtime environment used to build and connect cloud services and to run the process of retrieving physical activity data from activity monitor, calculating intervention criteria with the physical activity data and delivering feedback to participants as an intervention for increasing physical activity. Cloud Scheduler is a scheduling function for processing functions at a specific time, and was used to repeatedly run the process as needed. Cloud Scheduler was set up to trigger Cloud Functions at the 34-minute mark every hour (ie, 10:34 AM, 11:34 AM, 12:34 PM…) to evaluate the physical activity in the past hour (ie, 9:34 AM-10:33 AM, 10:34 AM-11:33 AM, 11:34 AM-12:33 PM…). Cloud Functions were used to retrieve 1-minute interval data from the Fitbit server through the Fitbit API. When both (1) “Distance moved” was less than the intervention criteria and (2) the “Sedentary time” was longer than the intervention criteria, participants were notified. Intervention decisions were based on data on distance moved and sedentary time in the past hour.
Intervention structure and flow. API: application programming interface; PIC: personalized intervention criteria; UIC: uniform intervention criteria.
Intervention Timing
An intervention decision was made once per hour by the programmed Cloud Scheduler of the Google Cloud platform, and the intervention message was delivered when the intervention criteria met the predefined conditions (ie, UIC or PIC). The intervention schedule was run from 8:00 AM to 10:00 PM.
Intervention Contents
The intervention consisted of sending an email to the participant’s email address. The email included a message encouraging physical activity and stating the participant’s distance moved and sedentary time in the last hour. One message (in Japanese) was chosen at random each time from the following 5 messages: “Would you like to take a walk?” “Would you like to exercise?” “Move your body!” “Let’s exercise!” and “Let’s move a little!” The Fitbit app on the smartphone allowed email notifications, and when the email was received, the activity monitor vibrated, and the contents of the email were displayed on the Fitbit screen.
Statistical Analysis
Analysis was performed using SAS 9.4 (SAS Institute Inc). The physical activity data acquired are longitudinal and repeatedly measured from individuals, and thus have a hierarchical structure. We used multilevel modeling, a widely used analytical method for such data structures [19]. We specified 2 different sets of models to examine the effectiveness of using JITAI implemented with PIC to increase physical activity. Model set A was specified to examine the effects of PIC or UIC on physical activity after the intervention. To examine the change in physical activity after 1 hour of intervention by different intervention criteria, the mean level of physical activity was estimated for the group using UIC and the group using PIC at the hour before and the hour after the intervention. The physical activity types estimated were sedentary time (minutes), lightly active time (minutes), fairly active time (minutes), very active time (minutes), calories (kcal), steps (n), and distance moved (m). We ran 7 different models, using each of these physical activity parameters as dependent variables. The intervention group (ie, PIC group and UIC group) and before or after intervention (ie, the hour before and the hour after the intervention) were used as independent variables.
Model Set A
Level 1 model (within-participant):
Level 2 models (between-participants):
where “Physical Activity_ti_” indicates the dependent variable (sedentary time, lightly active time, fairly active time, very active time, calories, steps, or distance moved) at the tth recording for the ith participant; β0i is participant i’s intercept; β1i is participant i’s slope; γ00 is the average intercept across all participants; γ01, γ02, γ03, and γ11 are all participants’ slopes; γ10 is the slope of β1i; εti is the within-individual residuals; υ0i and υ1i are the random effects of intercept and slope, respectively. The random or fixed effect of slope was determined by comparing Akaike information criterion (AIC) to find the best-fitting parameters for each. As an example, we have shown Equation 3 which has a random effect of slope (υ1i). To test the differences before or after intervention in mean level of physical activity, we added a categorical variable representing “Before or After Intervention_ti_” into the right-hand side of Equation 1. In addition, to test the difference in mean level of physical activity between PIC and UIC groups, we added a categorical variable representing “Intervention Group_i_” into the right-hand side of Equations 2 and 3. The slope (γ11) of an interaction term between “Before or After Intervention_ti_” and “Intervention Group_i_” represents the difference in physical activity for the group using UIC and the group using PIC at the hour before and the hour after the intervention in the combined multilevel model. In Equation 2, BMI and sex were adjusted for in the Level 2 (between-participants) models.
Model set B was specified to examine changes in physical activity from Week 1 (without intervention) to Week 2 (with intervention) associated with the different intervention criteria (UIC or PIC). A total of 7 separate models were specified using the hourly mean of each physical activity parameter (as above) as a dependent variable. Intervention group and week were specified as independent variables.
Model Set B
Level 1 model (within-participant):
Level 2 models (between-participants):
where “Physical Activity_ti_” indicates the dependent variable (sedentary time, lightly active time, fairly active time, very active time, calories, steps, or distance moved) at the tth recording for the ith participant; β0i is participant i’s intercept; β1i is participant i’s slope; γ00 is the average intercept across all participants; γ01, γ02, γ03, and γ11 are all participants’ slopes; γ10 is the slope of β1i; εti is the within-individual residuals; υ0i and υ1i are the random effects of intercept and slope, respectively. The random or fixed effect of slope was determined by comparing AIC to find the best-fitting parameters for each. As an example, we have shown Equation 6 which has a random effect of slope (υ1i). To test the change in physical activity from Week 1 without intervention to Week 2 with intervention, we added a categorical variable representing “Week 1 or Week 2_ti_” into the right-hand side of Equation 4. In addition, to test the difference in mean level of physical activity between PIC and UIC groups, we added a categorical variable representing “Intervention Group_i_” into the right-hand side of Equations 5 and 6. In Equation 5, BMI and sex were adjusted for in the Level 2 (between-participants) models. In an effort to compare intervention effects more precisely, we used the hourly averaged physical activity to minimize variation due to factors such as sleep length and the time participants did not wear the activity monitor.
For all analyses, data were excluded when participants were sleeping and not wearing the activity monitor. A P<.05 was considered significant. The Tukey-Kramer method was used to adjust for multiple comparisons.
Results
Participant Characteristics
While 31 participants were recruited for the study, 3 participants did not participate for more than 4 days during their 2-week periods and were excluded from the analysis. There were no significant differences in characteristics between the intervention groups, except for in BMI (Table 1).
The PIC group received interventions based on individual activity data measured during week 1. The UIC group received interventions based on group data from a 2-week preliminary study conducted a year earlier using the same devices looking at physical activity in a sample of university students (n=47; see Table 2).
The mean number of interventions for the PIC group was 4.4 per day (SD 1.5; range 1.3‐8.1), and the mean number of interventions for the UIC group was 3.8 per day (SD 2.3; range 2.6‐6.7). No significant difference in the mean number of interventions was found between the PIC and UIC groups. However, some participants in the UIC group who had higher average levels of physical activity received a lower number of interventions (ie, a mean of 1‐2 interventions per day) to increase activity, while some participants who had lower average physical activity levels received a higher number of interventions (ie, a mean of 7‐8 interventions per day; see Figure 2).
Mean number of interventions per day in accordance with physical activity level in personalized intervention criteria (PIC) versus uniform intervention criteria (UIC) group.
Model Set A: Effects of PIC and UIC on Physical Activity for the Hour Before and the Hour After the Intervention
In model set A, the best models for sedentary time and lightly active time used random intercepts and slopes, while the best models for fairly active time, very active time, calories, steps, and distance moved used random intercepts and fixed slopes. For both the PIC and UIC groups, sedentary time significantly decreased after the intervention (PIC group: before B=55.83, SE=0.54; after B=48.21, SE=1.07; P<.001 and UIC group: before B=57.11, SE=0.58; after B=49.88, SE=1.10; P<.001; see Table 3). The other 6 physical activity types (ie, lightly active time, fairly active time, very active time, calories, steps, and distance moved) significantly increased after the intervention in intervention groups (P<.001; see Table 3). See Table S1 in Multimedia Appendix 1 for detailed information.
Calories burned (PIC group: B=25.29, SE=2.03 and UIC group: B=18.13, SE=2.18; P=.02), Steps taken (PIC group: B=336.99, SE=27.45 and UIC group: B=221.88, SE=29.45; P=.008), and distance moved (PIC group: B=148.89, SE=12.19 and UIC group: B=92.79, SE=13.07; P=.004) showed significant differences in the increase in physical activity the hour before and after the intervention between the PIC group and the UIC group (Figure 3). Specifically, the number of calories burned per hour was estimated to increase by 7.16 kcal more in the PIC group than in the UIC group after the intervention. Steps taken increased by 115.11 steps and distance moved increased by 56.10 m in the PIC group compared with the UIC group. There were no significant differences in change observed between groups in the other activity types (see Table S1 in Multimedia Appendix 1 for details).
*Changes in physical activity from the hour before to the hour after the intervention in personalized intervention criteria (PIC) versus uniform intervention criteria (UIC) group. The values represent time spent (min) doing physical activity (top), calories burned (kcal), steps taken (steps), or distance moved (m) per hour (bottom). *P<.05 *P<.01 †P<.10.
Model Set B: Effects of PIC and UIC on Physical Activity From Week 1 Without Intervention to Week 2 With Intervention
In model set B, the best models for lightly active time, fairly active time, calories, steps, and distance moved used random intercepts and slopes, while the best models for sedentary time and very active time used random intercepts and fixed slopes. In both PIC and UIC groups, there were no significant changes in physical activity (all parameters) between week 1 and week 2 (see Table 4). See Table S2 in Multimedia Appendix 1 for detailed information.
Discussion
Principal Findings
In this study, we examined the differences between in the impact of interventions based on personalized intervention criteria and uniform intervention criteria on physical activity in daily life. We found that in the first hour after JITAI was delivered, physical activity in the PIC group increased more than in the UIC group. However, the use of JITAI (both criteria) did not significantly increase physical activity over the whole study period.
There was a significant difference in increase in calories burned, steps taken, and distance moved between the PIC and UIC groups. This indicates that interventions based on PIC were more effective, suggesting that interventions to promote physical activity need to use individually developed intervention criteria based on physical activity in daily life. It has been reported that low feasibility of intervention suggestions is likely to lead to dissatisfaction [2021]. It is possible that the setting of individually optimized intervention criteria that presented highly feasible goals (eg, proper number of interventions; see Figure 2) based on their physical activity level may have made it easier for them to change their behavior. Further studies need to identify the optimal number of interventions per day to promote physical activity.
Interestingly, in contrast to previous studies, we did not observe differences in overall physical activity between the first week without intervention and the week with intervention in either group. This may be due to the length of the intervention period used in this study. A previous study using UIC showed found an increase in physical activity after 21 days of intervention [16], while another study that sent contextually tailored intervention messages for 6 weeks showed an increase in the number of steps, although the increase diminished over time [22]. Taken together, it is possible that a longer intervention period is needed to effectively promote increased physical activity. A possible additional factor explaining this was that all but one participant had never worn activity monitors before, and simply wearing the monitors during the first week might have affected their baseline activity levels [23]. Future studies may need to set a burn-in period to precisely identify the baseline of physical activity before starting intervention.
This study had several limitations. Participants were university students, and the number of participants was small (n=28). Considering the sample size and the limited number of personal characteristics available to include as covariates (ie, age, BMI, and sex), it is possible that group differences (PIC vs UIC) may be related to other hidden third variables. Further studies need to examine the effectiveness of JITAI using PIC in larger samples with more personal characteristics, especially for participants who have low average levels of physical activity (eg, obese and elderly people who need more personalized intervention criteria). In addition, the variables of physical activity (ie, sedentary time and distance moved) we used for intervention were limited and in the future, more criteria could be used to determine thresholds to trigger interventions, and more sophisticated approaches to determine intervention decisions (eg, machine learning classification) could be used with additional physical activity features. A technical limitation was that the time of the intervention decision could not be randomized and was fixed. In future JITAI research, a finer grained approach ensuring that it is possible to intervene at the timing when the intervention criteria are met might lead to more optimal timing of the intervention. Finally, this study was limited to 2 weeks in duration and did not include any follow-up. Programs for increasing physical activity require the promotion of long-term behavioral changes. Further studies need to consider maintenance of benefits and sustainability of programs over longer periods of time.
Conclusion
We found that personalized intervention criteria were more effective than uniform intervention criteria in increasing physical activity levels, supporting the idea that precision health approaches tailored to the individual may lead to beneficial effects on health. The findings of this pilot study warrant further investigation; JITAI PIC programs need to be assessed over longer durations and in different populations.
Supplementary material
10.2196/66750Multimedia Appendix 1Supplementary tables providing detailed information on the effects of intervention criteria on physical activity.
10.2196/66750Checklist 1CONSORT-EHEALTH checklist. CONSORT: Consolidated Standards of Reporting Trails.
The reference list from the paper itself. Each links out to its DOI / PubMed record.
- 1Warburton DER Nicol CW Bredin SSD Health benefits of physical activity: the evidence Can Med Assoc J Mar 1420061746801809 doi 10.1503/cmaj.05135116534088 PMC 1402378 · doi ↗ · pubmed ↗
- 2Mandsager K Harb S Cremer P Phelan D Nissen SE Jaber W Association of cardiorespiratory fitness with long-term mortality among adults undergoing exercise treadmill testing JAMA Netw Open Oct 5201816 e 183605 doi 10.1001/jamanetworkopen.2018.3605 Medline 30646252 PMC 6324439 · doi ↗ · pubmed ↗
- 3Stamatakis E Ahmadi MN Gill JMR et al Association of wearable device-measured vigorous intermittent lifestyle physical activity with mortality Nat Med Dec 2022281225212529 doi 10.1038/s 41591-022-02100-x Medline 36482104 PMC 9800274 · doi ↗ · pubmed ↗
- 4Bull FC Al-Ansari SS Biddle S et al World Health Organization 2020 guidelines on physical activity and sedentary behaviour Br J Sports Med Dec 2020542414511462 doi 10.1136/bjsports-2020-102955 Medline 33239350 PMC 7719906 · doi ↗ · pubmed ↗
- 5Strain T Flaxman S Guthold R et al National, regional, and global trends in insufficient physical activity among adults from 2000 to 2022: a pooled analysis of 507 population-based surveys with 5·7 million participants Lancet Glob Health Aug 2024128 e 1232 e 1243 doi 10.1016/S 2214-109X(24)00150-5Medline 38942042 PMC 11254784 · doi ↗ · pubmed ↗
- 6Zhang M Wang W Li M Sheng H Zhai Y Efficacy of mobile health applications to improve physical activity and sedentary behavior: a systematic review and meta-analysis for physically inactive individuals Int J Environ Res Public Health Apr 1820221984905 doi 10.3390/ijerph 19084905 Medline 35457775 PMC 9031730 · doi ↗ · pubmed ↗
- 7Sohaib Aslam A van Luenen S Aslam S van Bodegom D Chavannes NH A systematic review on the use of m Health to increase physical activity in older people Clinical e Health 202033139 doi 10.1016/j.ceh.2020.04.002 · doi ↗
- 8Wang JW Zhu Z Shuling Z et al Effectiveness of m Health app-based interventions for increasing physical activity and improving physical fitness in children and adolescents: systematic review and meta-analysis JMIR Mhealth Uhealth Apr 30202412 e 51478 doi 10.2196/51478 Medline 38687568 PMC 11094610 · doi ↗ · pubmed ↗