Healthy lifestyle moderates the association between recent negative life events and depressive symptoms: a cross-sectional study
Yang Yang, Yuhua Liao, Yanzhi Li, Huimin Zhang, Yifeng Liu, Guangduoji Shi, Jiejing Hao, Ruiying Chen, Ye Xu, Zhiyao Xin, Subinuer Yiming, Wanxin Wang, Lan Guo, Ciyong Lu, Beifang Fan

TL;DR
This study finds that adopting a healthy lifestyle can reduce the impact of recent negative life events on depressive symptoms.
Contribution
The study demonstrates that a healthy lifestyle moderates the link between negative life events and depression.
Findings
High RNLEs significantly increase the odds of depressive symptoms.
Adopting a favorable lifestyle is associated with lower odds of depressive symptoms.
Healthy lifestyle factors moderate the association between RNLEs and depression.
Abstract
Both recent negative life events (RNLEs) and lifestyle factors were associated with depressive symptoms, but it is unclear whether adopting a healthy lifestyle can mitigate the association between RNLEs and depressive symptoms. We aim to explore the modifying role of adopting a healthy lifestyle in the association between RNLEs and depressive symptoms. A cross-sectional study was conducted among 4,278 participants aged 18–70 years. RNLEs includes 12 common negative life events that have occurred in the past year, and were classified as low RNLEs (0 RNLEs), intermediate RNLEs (1–5 RNLEs), and high RNLEs (6–12 RNLEs). A healthy lifestyle score in adulthood was constructed as the sum of five modifiable lifestyle factors (i.e., smoking status, drinking status, regular physical activity, sleep duration, and living alone), and was classified as unfavorable [0–2 points], intermediate [3…
Genes, proteins, chemicals, diseases, species, mutations and cell lines named across the full text — each resolved to its canonical identifier and authoritative record.
Click any figure to enlarge with its caption.
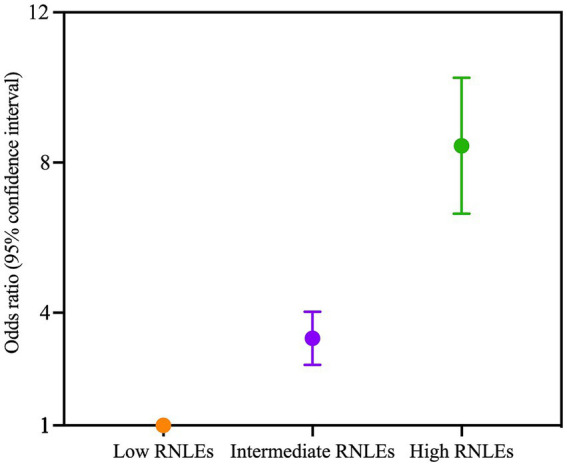 Figure 1
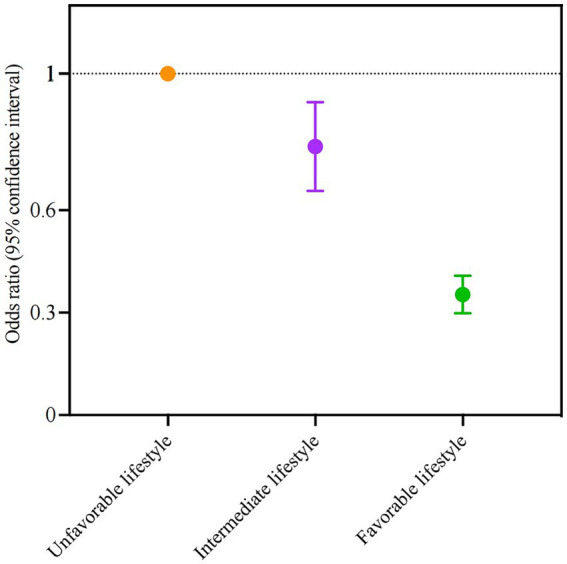 Figure 2
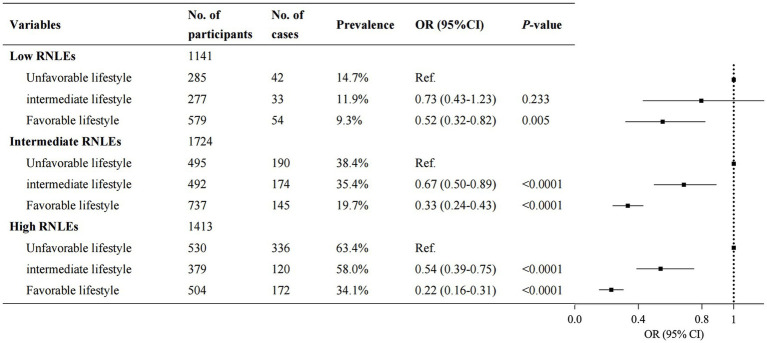 Figure 3
| Variables | Total ( | Depressive symptoms | ||
|---|---|---|---|---|
| Yes ( | No ( | |||
| Age, mean (SD), year | 49.0 (13.6) | 46.2 (12.6) | 49.4 (11.5) | <0.001 |
| Gender | <0.001 | |||
| Woman | 2,588 (60.5) | 872 (63.8) | 1716 (58.9) | |
| Man | 1,690 (39.5) | 494 (36.2) | 1,196 (41.1) | |
| Region | <0.001 | |||
| Urban | 2,442 (57.1) | 1,108 (81.1) | 1,334 (45.8) | |
| Rural | 1836 (42.9) | 258 (18.9) | 1,578 (54.2) | |
| Household income (¥) | <0.001 | |||
| <30,000 | 1956 (45.7) | 515 (37.7) | 1,441 (49.4) | |
| 30,000–79,999 | 967 (22.6) | 295 (21.6) | 672 (23.1) | |
| 80,000–149,999 | 817 (19.1) | 326 (23.9) | 492 (16.9) | |
| 150,000–790,000 | 504 (11.8) | 218 (16.0) | 286 (9.8) | |
| ≥800,000 | 34 (0.8) | 12 (0.9) | 22 (0.8) | |
| Only Child | <0.001 | |||
| Yes | 401 (9.4) | 201 (14.7) | 200 (6.9) | |
| No | 3,877 (90.6) | 1,165 (85.3) | 2,712 (93.1) | |
| Education level | <0.001 | |||
| Primary or below | 857 (20.0) | 190 (13.9) | 667 (22.9) | |
| Junior or senior | 1,665 (38.9) | 382 (28.0) | 1,283 (44.1) | |
| College or above | 1756 (41.0) | 794 (58.1) | 962 (33.0) | |
| Marital status | <0.001 | |||
| Single | 856 (20.0) | 474 (34.7) | 382 (13.1) | |
| Married | 3,199 (74.8) | 814 (59.6) | 2,385 (81.9) | |
| Other status | 223 (5.2) | 78 (5.7) | 145 (5.0) | |
| RNLEs | <0.001 | |||
| Low RNLEs | 1,141 (26.7) | 129 (9.4) | 1,012 (34.8) | |
| Intermediate RNLEs | 1724 (40.3) | 509 (37.3) | 1,215 (41.7) | |
| High RNLEs | 1,413 (33.0) | 728 (53.3) | 685 (23.5) | |
| Drinking status | <0.001 | |||
| Yes | 2,218 (51.8) | 808 (59.2) | 1,410 (48.4) | |
| No | 2060 (48.2) | 558 (40.8) | 1,502 (51.6) | |
| Smoking status | <0.001 | |||
| Yes | 636 (14.9) | 205 (15.0) | 431 (14.8) | |
| No | 3,642 (85.1) | 1,161 (85.0) | 2,481 (85.2) | |
| Sleep duration | <0.001 | |||
| 7–9 h | 1,215 (28.4) | 325 (23.8) | 890 (30.6) | |
| <7 h or >9 h | 3,063 (71.6) | 1,041 (76.2) | 2022 (69.4) | |
| Living alone | <0.001 | |||
| Yes | 384 (9.0) | 167 (12.2) | 217 (7.5) | |
| No | 3,894 (91.1) | 1,199 (87.8) | 2,695 (92.5) | |
| Physical activity | <0.001 | |||
| MPA or VPA ≥ 150 min/week | 2,549 (59.6) | 740 (54.2) | 1809 (62.1) | |
| MPA or VPA < 150 min/week | 1729 (40.4) | 626 (45.8) | 1,103 (37.9) | |
| Variable | Crude | Adjusted | |
|---|---|---|---|
| RNLEs | |||
| Low RNLEs | 129/1141 (11.3%) | Ref. | Ref. |
| Intermediate RNLEs | 509/1724 (29.5%) | 3.15 (2.54–3.93)*** | 3.26 (2.65–4.06)*** |
| High RNLEs | 728/1413 (51.5%) | 7.76 (6.26–9.68)*** | 8.30 (6.72–10.33)*** |
| Overall lifestyle | |||
| Unfavorable lifestyle | 568/1310 (43.4%) | Ref. | Ref. |
| Intermediate lifestyle | 427/1148 (37.2%) | 0.82 (0.69–0.98)* | 0.78 (0.66–0.92)*** |
| Favorable lifestyle | 371/1820 (20.4%) | 0.39 (0.33–0.47)*** | 0.35 (0.30–0.41)*** |
- —Ministry of Science and Technology of the People’s Republic of China
Peer Reviews
No public reviews on file for this paper yet. If you reviewed it on a platform where reviews are public (OpenReview, ICLR, NeurIPS, ICML), you can paste yours below so the community can read it here.
Videos
No videos yet. Explain this paper in a talk, walkthrough, or lecture? Add one.
Taxonomy
TopicsHealth disparities and outcomes · Psychological Well-being and Life Satisfaction · Health, psychology, and well-being
Introduction
Depression is a prevalent mental disorder, affecting approximately 280 million individuals globally, with an annual increase in prevalence. The World Health Organization (WHO) has forecast that by 2030, depression will become the leading cause of global disease burden (1, 2). In China, the National Mental Health Survey indicates that the lifetime prevalence of depression among adults is 3.4%. Currently, there are approximately 95 million people suffering from depression in China, and approximately 280,000 suicides occur each year, with 40% of these individuals having depression (3). If left unaddressed, symptoms of depression, which are often considered a subhealth condition, can escalate into full-blown depression, posing significant threats to both mental and physical health (4).
Previous research has indicated that recent negative life events (RNLEs), such as loss of relatives, physical health problems, and financial troubles, functioning as a stressor, are a significant risk factor for depression (5–9). Importantly, unlike modifiable factors such as lifestyle, RNLEs, once occurred, are unmodifiable risk factors for depression, and their impacts may persist over a lifetime. Therefore, it is necessary to identify factors that could effectively mitigate the adverse influence of RNLEs on depression among adults.
Potential protective factors in the development process of depression have been extensively studied, and healthy lifestyle, such as regular physical activities and enough sleep duration, has received particular attention (10–12). Previous observational and intervention studies that have demonstrated that adherence to a healthy lifestyle is associated with a decreased risk of developing depression. Depression is often accompanied by over-activation of the HPA axis, leading to elevated cortisol levels (13). Chronic high cortisol levels are strongly associated with mood disorders. RNLEs can activate the HPA axis (14–16), and healthy lifestyles, such as physical exercise, can help regulate the function of the HPA axis and reduce the stress response (17). Physical exercise can promote neuroplasticity, improve mood through endorphin release, and regulate the immune system, all of which can counterbalance the negative effects of chronic HPA axis activation. Additionally, sufficient sleep and other positive lifestyle behaviors can further contribute to the stabilization of the HPA axis (18–20), reducing the long-term psychological and physiological consequences of stress exposure. In order to better intervene or reduce this association, it may be better to find a moderating variable that allows people to act on their own, and lifestyle is such a moderating variable, which is more practical. However, limited research has been conducted in this area (21). Besides, previous studies tended to use single variables to represent individual lifestyle levels, which only partially reflect overall lifestyle (22). However, lifestyle factors are interrelated, and few studies have built a healthy lifestyle score to reflect overall lifestyle and to evaluate its impact on the RNLEs in mental health.
To address these gaps in knowledge, we aimed to investigate whether a healthier overall lifestyle could mitigate the likelihood of depressive symptoms among those with RNLEs.
Methods
Study design and participants
This cross-sectional study was conducted in Guangdong Province, China, covering two distinct regions: Nanshan District (urban area) of Shenzhen City and Wengyuan County (rural area) of Shaoguan City. The study utilized baseline data from an ongoing longitudinal prospective cohort study of community-dwelling residents in mainland China. The recruitment process involved selecting adults aged 18 to 70 years from communities in both regions using a convenience sampling method. The personal information of the participants remained confidential all throughout the study. Because our data collection comprised only a single wave of baseline observations, a cross-sectional design was the only feasible approach and allowed us to estimate the prevalence of recent negative life events and depressive symptoms and examine their associations across subpopulations at one point in time.
The initial sample included 5,219 adults, of which 4,970 adults participated in the survey. At last, 4278 adults completed the whole set of questionnaires. The sample consists 2,588 (60.5%) female and 1,690 (39.5%) male adults. The age range was 18–70 years (Mean, 48.95; SD, 13.57).
Assessment of depressive symptoms
Depressive symptoms were measured using the nine-item Patient Health Questionnaire (PHQ-9), ranging from 0 to 27. The PHQ-9 for the Chinese version has good internal consistency, reliability, and validity, with a Cronbach’s 0.91 (23). Various ratings describe the severity of depression symptoms, with 0–4 indicating no symptoms, 5–9 indicating mild symptoms, 10–14 indicating moderate symptoms, and 15–27 indicating severe symptoms (24). For this study, we focused on depressive symptoms rather than the disease, and considering that above 5 is the criterion for determining the presence of depressive symptoms, we set 5 as the cut-off score in this study (24). We separated the participants into two groups, with those scoring 0–4 as having no depression symptoms and those scoring 5 and above as having more than mild depressive symptoms.
Assessment of recent negative life events
Participants reported whether or not they had experienced the following 12 recent negative life events over the past year: excessive fatigue (work, study, or daily life), death of a close family member (spouse or close relatives), family discord or marital problems (serious conflicts, separation, divorce, heartbreak, or difficulty in finding a partner), career changes (retirement, resignation, job transfer, transfer, or dropping out), economic difficulties (debt, losses, and theft), difficulties in career or study, troubles in relationships (superiors, colleagues, and neighbors), issues related to the future of children (difficulties in education, employment, or marriage), poor living environment (overcrowding, noise, and relocation), serious illness or injury to a close relative, and adverse changes in personal health, involving cases. To facilitate subsequent analysis and interpretation, we categorized RNLEs into three groups based on the number of exposures: “Low RNLEs,” “Intermediate RNLEs,” and “High RNLEs,” corresponding to 0, 1–5 and 6–12 RNLEs, respectively.
Assessment of overall lifestyle
Since multiple lifestyles are interrelated and are associated with depressive symptoms, we constructed an overall lifestyle score including five modifiable lifestyle factors: smoking status, alcohol status, physical activity, sleep duration, and living alone according to previous studies (25, 26). We defined healthy and unhealthy levels for each lifestyle factor. Currently not smoking, currently not drinking, currently not living alone, optimal sleep (7–9 h/night) (27), and regular physical activity (moderate or vigorous physical activity ≥150 min/week) (28)were defined as healthy.
For each lifestyle factor, we assigned 1 point for a healthy level and 0 points for an unhealthy level. Thus, the overall lifestyle score was the sum of the points and ranged between 0 and 5, with higher scores indicating a healthier lifestyle. To balance the sample sizes and increase the statistical power, the overall lifestyle score was further categorized into three groups: unfavorable (0–2 points), intermediate (3 points), and favorable (4–5 points).
Covariates
Covariates were obtained through questionnaires, including age, gender, region, household income, only child, educational level, and marital status. Household income was categorized into less than ¥30,000, ¥30,000 to 79,999, ¥80,000 to 149,999, ¥150,000 to 790,000, and more than ¥800,000. Education was classified into three levels: primary or below, junior or senior, and college or above. Marital status was grouped into single, married, and other status.
Statistics analysis
Descriptive summaries are presented as means and standard deviations for continuous variables and as frequencies and percentages for categorical variables. Differences in each variable based on depressive symptoms (PHQ-9 ≥ 5) were evaluated by two-sample t-tests for continuous variables and Pearson chi-square tests for categorical variables.
Second, logistic regression analysis was used to examine the association of RNLEs and lifestyle with depressive symptoms among adults, and odds ratios (ORs) and 95% CIs for depressive symptoms were estimated. Two analytical models were created with the crude and adjusted models, including all covariates. Third, we assessed the prevalence of depressive symptoms associated with the joint categories of RNLEs (no, intermediate, and high) and overall lifestyle in adulthood (unfavorable, intermediate, and favorable), using the low RNLEs and favorable lifestyle as the reference. Fourth, we compared the associations of adherence to a favorable or intermediate lifestyle in adulthood with the prevalence of depressive symptoms within each RNLEs category. Finally, subgroup analyses were performed according to the age category (18–44 years, 45–59 years, and ≥60 years), gender (women and men), and region (urban and rural).
All statistical analyses were performed using R software (4.3.0). We considered two-sided p-values <0.05 as statistically significant.
Results
Population characteristics
Table 1 shows the characteristics of the study population. Of the 4,278 participants (39.5% men, mean age, 49.0 years) included in the analyses, 1,366 (31.9%) had depressive symptoms. A total of 1,141 (26.7%) participants reported not experiencing RNLEs (low RNLEs), 1724 (40.3%) participants reported experiencing 2–5 types of RNLEs (intermediate NLEs), and 1,413 (33.0%) participants reported experiencing 6 or more types of RNLEs (high RNLEs). Participants with depressive symptoms were more likely to be younger, female, urban, not-only child, single, and with lower household income and lower education level (all p values <0.001). In addition, RNLEs, drinking, smoking, inappropriate sleep duration, living alone, and inadequate physical activity were more prevalent among adults with depressive symptoms (all p values <0.001).
Associations of RNLEs with depressive symptoms
Figure 1 shows that the prevalence of depressive symptoms increased significantly across three RNLEs categories. Compared with individuals with low RNLEs (Table 2), those with high RNLEs had a higher association with depressive symptoms (OR, 95%CI: 8.30, 6.72–10.33) (Table 2). An increase in the number of RNLEs was more strongly associated with depressive symptoms in a dose–response manner (adjusted for all covariates, all p values for overall association <0.05, Supplementary Figure S1).
Association of recent negative life events (RNLEs) with the odds of depressive symptoms. Participants were divided into three exposure groups according to the number of recent negative life events (RNLEs) (low [0 RNLEs], intermediate [2–5 RNLEs], high [6 or more RNLEs]). Odds ratio (OR) with 95% confidence interval (CI) for each group was compared with the low RNLEs group. Points represent the ORs, and error bars show the 95% CIs. The model was adjusted for age, gender, region, only child, education level, household income, marital status, and overall lifestyle in adulthood.
Associations of lifestyle with depressive symptoms
The prevalence of depressive symptoms significantly decreased as the lifestyle category became more favorable (Figure 2). Participants with a favorable lifestyle were less tightly associated with depressive symptoms (0.35, 0.30–0.41). There was also a dose–response association between healthy lifestyle scores and depressive symptoms (adjusted for all covariates, p values <0.05 when healthy lifestyle score >1, Supplementary Figure S2).
Association of overall lifestyle in adulthood with the odds ratio of depressive symptoms. Participants were divided into three groups according to the number of healthy lifestyle factors in adulthood (unfavorable [0–2 point], intermediate [3 points], favorable [4–5 points]). Participants with an unfavorable lifestyle were regarded as the reference group. Points represent the odds ratios, and error bars show the 95% confidence intervals. The model was adjusted for age, gender, region, only child, education level, household income, marital status, and negative life events in adulthood.
Joint analysis of overall lifestyle and RNLEs with depressive symptoms
Supplementary Figure S4 shows the joint associations of overall lifestyle and recent negative life events with depressive symptoms. There was an upward trend in the prevalence of depressive symptoms with higher RNLEs and an increasingly unhealthy lifestyle. The overall lifestyle was observed as significant moderating role on the association between RNLEs and depressive symptoms (OR, 95%CI: 0.61 [0.40–0.95]). There was a significant interaction effect between RNLEs and overall lifestyle on depressive symptoms (p value <0.0001).
Within each stratum of RNLEs (low, intermediate, high), we observed a significant reduction in the proportion of depressive symptoms in participants who adopted a favorable or intermediate lifestyle in adulthood compared to those with an unfavorable lifestyle (Figure 3). In participants with high RNLEs, the association between RNLEs and depressive symptoms dropped by 78% (OR, 95%CI: 0.22 [0.16–0.31]) with a favorable lifestyle compared to those with an unfavorable lifestyle.
Association between overall lifestyle in adulthood and the odds ratio of depressive symptoms within each recent negative life events (RNLEs) category. Participants with an unfavorable lifestyle were considered as the reference group within each RNLEs category. Points represent the odds ratios, and error bars show the 95% confidence intervals. The model was adjusted for age, gender, region, only child, education level, household income, and marital status.
Subgroup and sensitivity analysis
Subgroup analyses by age, gender, and region were similar to our primary analyses (Supplementary Table S1). The associations of RNLEs and overall lifestyle with depressive symptoms did not materially change when using 10 points as the cut-off of PHQ-9 (Supplementary Table S2).
Discussion
Principal findings
In this cross-sectional study, we found that a healthier lifestyle and fewer recent negative life events were associated with a lower prevalence of depressive symptoms. However, our key finding was that having a favorable lifestyle in adulthood notably decreased the association between depressive symptoms and RNLEs irrespective of the RNLEs exposure category.
Comparison with previous studies
Consistent with our findings, prior studies suggested RNLEs play an important role in the prevalence of depressive symptoms. Individuals with more RNLEs are exposed to more stress, social challenges, and adversity, but have limited approaches to cope with these events, and thus are more likely to suffer from depression (29). Similarly, a meta-analysis of 30 cohort studies with 25,154 college students reported a 16% increased risk of depressive symptoms with RNLEs (30). Another meta-analysis of 11 studies with 31,528 older Chinese adults found RNLEs as significant risk factors (OR, 95%CI: 2.43 [1.87.2.98]). By comparison, our results also show that different types of RNLEs, their aggregate number, and categories were independently associated with an increased risk of depressive symptoms. Moreover, our results highlight the importance of early screening for individuals with RNLEs.
Meta-analysis and systematic analysis have indicated that healthy lifestyles are associated with the alleviation of depressive symptoms (25, 31). A systematic review and meta-analysis of 15 prospective studies including more than 2 million person-years showed an inverse curvilinear association between physical activity and incident depression, with greater differences in risk at lower exposure levels (32). A cross-sectional study comprising 176,794 individuals aged 19 years and over suggest poor sleep quality may contribute to depressive symptoms (33). These results were consistent with our findings. Further, we found that currently no drinking and no smoking were associated with a reduced prevalence of depressive symptoms. Several previous studies have also investigated the association of smoking and alcohol assumption with depression, but the results were inconsistent. For instance, a community-based survey showed that having an alcohol use disorder at least doubles the odds of depressive, anxiety, and other non-substance-use disorders (34). However, a cohort study of 12,686 individuals suggest that moderate alcohol consumption may be associated with a reduced risk of depression (35). A systematic review of 110 original research articles, eight meta-analyses and reviews, and four reports and websites revealed no cause-effect relationship (36). In addition, prior studies have found that living alone is a risk factor for depressive symptoms in both older and younger people. A prospective study of 3,011 older adults in South Korea showed a significant increase in depressive symptoms during the first, second, and third years of living alone compared with living with others (37). According to new U.S. Census Bureau data, younger adults living alone were more likely than older adults living alone to report depressive symptoms (38).
However, limited evidence is available on whether a healthy lifestyle moderates the association between recent negative life events and depressive symptoms among adults. A cohort study of 3,597 adults aged 25 years or older suggested that poor sleep has the ability to compound the effects of recent negative life events (21). Besides, a longitudinal study of 316 adolescents in America presented sleep efficiency as a modulator of stress-related risk (22). Both results support our findings to some extent. Notably, most previous studies focused the single lifestyle factors whereas we included 3 dimensions of overall lifestyle, which would have a more comprehensive assessment. Additionally, our study is the first to show a significant reduction in the association between depressive symptoms and different categories of RNLEs through adopting a healthy lifestyle in adulthood.
Subgroup analyses indicates that, after stratifying by age, gender, and region, a favorable lifestyle continues to attenuate the association between RNLEs and depressive symptoms in both the intermediate and high RNLEs groups. Moreover, this mitigating effect is particularly pronounced among participants under 60 years old, women, and urban residents. These findings indicate that promoting a favorable lifestyle may yield greater benefits for these populations.
These findings reinforce the message of policymakers and healthcare practitioners to promote healthy lifestyles (smoking and drinking cessation, engaging in appropriate physical activity, adequate sleep duration, and avoiding living alone) across the population but also highlight that those with high RNLEs may benefit most.
Strengths and limitations
To our knowledge, this is the first study to investigate the joint association between RNLEs and overall lifestyles with depressive symptoms among adults. In addition, we established overall healthy lifestyle scores and leveled RNLEs to comprehensively evaluate the stratified and joint associations of a healthy lifestyle and negative life events with depressive symptoms. We also conducted a series of sensitivity analyses to show the robustness of the findings and evaluated the moderation within different age, gender, and region groups.
This study has several limitations. First, because data collection was limited to a single baseline wave of cross-sectional observations, we were unable to infer causal relationships. Second, our measures were based on the participants’ self-report, so reporting bias and recall bias was inevitable. Finally, the sample was from Guangdong Province, China, so caution should be exercised when applying results in other regions.
Conclusion
In this cross-sectional study among adults, adopting to a greater number of healthy lifestyles was associated with a lower likelihood of depressive symptoms, and mitigated the association between RNLEs and depressive symptoms. Our findings underscore the potential role of adopting a healthy lifestyle in adulthood for those with RNLEs to reduce their risk of depression.
The reference list from the paper itself. Each links out to its DOI / PubMed record.
- 1Hu T Zhao X Wu M Li Z Luo L Yang C. Prevalence of depression in older adults: a systematic review and meta-analysis. Psychiatry Res. (2022) 311:114511. doi: 10.1016/j.psychres.2022.114511, PMID: 35316691 · doi ↗ · pubmed ↗
- 2Thapar A Eyre O Patel V Brent D. Depression in young people. Lancet. (2022) 400:617–31. doi: 10.1016/S 0140-6736(22)01012-1, PMID: 35940184 · doi ↗ · pubmed ↗
- 3Huang Y Wang Y Wang H Liu Z Yu X Yan J. Prevalence of mental disorders in China: a cross-sectional epidemiological study. Lancet Psychiatry. (2019) 6:211–24. doi: 10.1016/S 2215-0366(18)30511-X 30792114 · doi ↗ · pubmed ↗
- 4Holtfreter K Reisig MD Turanovic JJ. Depression and infrequent participation in social activities among older adults: the moderating role of high-quality familial ties. Aging Ment Health. (2017) 21:379–88. doi: 10.1080/13607863.2015.1099036, PMID: 26471453 · doi ↗ · pubmed ↗
- 5Maciejewski D Van Sprang E Spinhoven P Penninx B. Longitudinal associations between negative life events and depressive symptoms—a 9-year longitudinal study on between-person and within-person effects and the role of family history. J Pers Soc Psychol. (2021) 121:707–21. doi: 10.1037/pspp 0000381, PMID: 33507780 · doi ↗ · pubmed ↗
- 6Ji L Chen C Hou B Ren D Yuan F Liu L. A study of negative life events driven depressive symptoms and academic engagement in Chinese college students. Sci Rep. (2021) 11:17160. doi: 10.1038/s 41598-021-96768-9, PMID: 34433874 PMC 8387499 · doi ↗ · pubmed ↗
- 7Sun XJ Niu GF You ZQ Zhou ZK Tang Y. Gender, negative life events and coping on different stages of depression severity: a cross-sectional study among Chinese university students. J Affect Disord. (2017) 209:177–81. doi: 10.1016/j.jad.2016.11.025, PMID: 27923194 · doi ↗ · pubmed ↗
- 8Asselmann E Wittchen HU Lieb RHöfler M Beesdo-Baum K. Danger and loss events and the incidence of anxiety and depressive disorders: a prospective-longitudinal community study of adolescents and young adults. Psychol Med. (2015) 45:153–63. doi: 10.1017/S 0033291714001160, PMID: 25065411 · doi ↗ · pubmed ↗