No evidence of transposable element bursts in the Galápagos Scalesia adaptive radiation despite hybridization, diversification and ecological niche shifts
José Cerca, Patricia Jaramillo Díaz, Clément Goubert, Heidi Yang, Vanessa C. Bieker, Mario Fernández-Mazuecos, Pablo Vargas, Rowan Schley, Siyu Li, Juan Ernesto Guevara-Andino, Bent Petersen, Gitte Petersen, Neelima R. Sinha, Lene R. Nielsen, James H. Leebens-Mack

TL;DR
This study examines transposable elements in the Galápagos Scalesia plants and finds no evidence that these elements drive speciation or adaptation.
Contribution
The study provides new insights into the role of transposable elements in macroevolutionary processes using an adaptive radiation case.
Findings
There is little to no variation in transposable element accumulation among Scalesia species.
Shifts in ecological niches do not correlate with changes in transposable element accumulation.
Transposable elements may not actively drive evolutionary diversification but may be passive genomic features.
Abstract
Transposable elements (TEs) have been hypothesized to play a pivotal role in driving diversification by facilitating the emergence of novel phenotypes and the accumulation of divergence between species. Hybridization and adaptation to novel niches have been proposed to destabilize mechanisms constraining TE proliferation, potentially inducing a ‘TE burst’ that promotes TE accumulation on the genome. The rapid speciation and ecological diversification characteristic of adaptive radiations offer a unique opportunity to examine the link between TE accumulation and speciation, diversification, hybridization and adaptation. Here, focusing on all 15 species of the genus Scalesia (Asteraceae), a radiation endemic to the Galápagos Islands, we test whether diversification, hybridization, or shifts in ecological niche are associated with changes in TE accumulation in genomes. Our analyses reveal…
Genes, proteins, chemicals, diseases, species, mutations and cell lines named across the full text — each resolved to its canonical identifier and authoritative record.
Click any figure to enlarge with its caption.
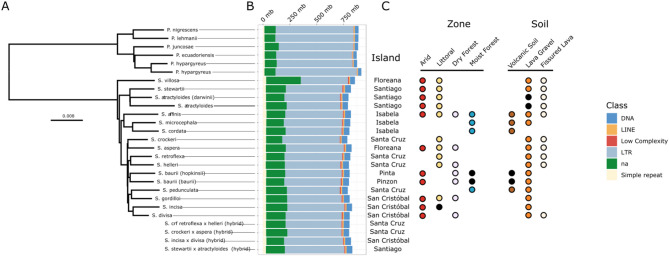 Figure 1
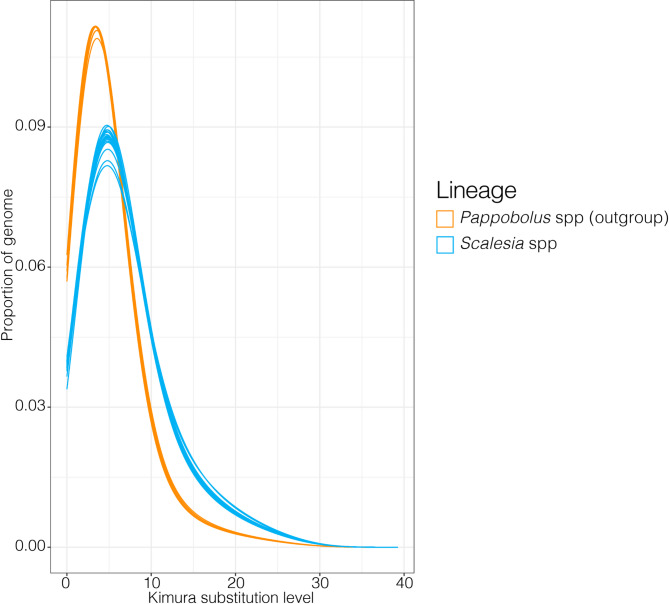 Figure 2
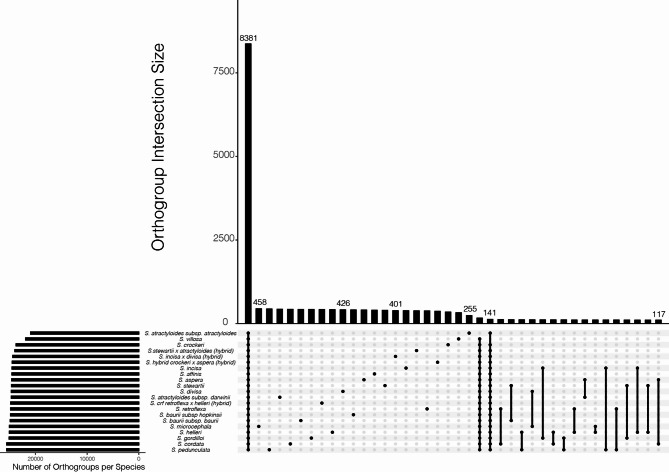 Figure 3
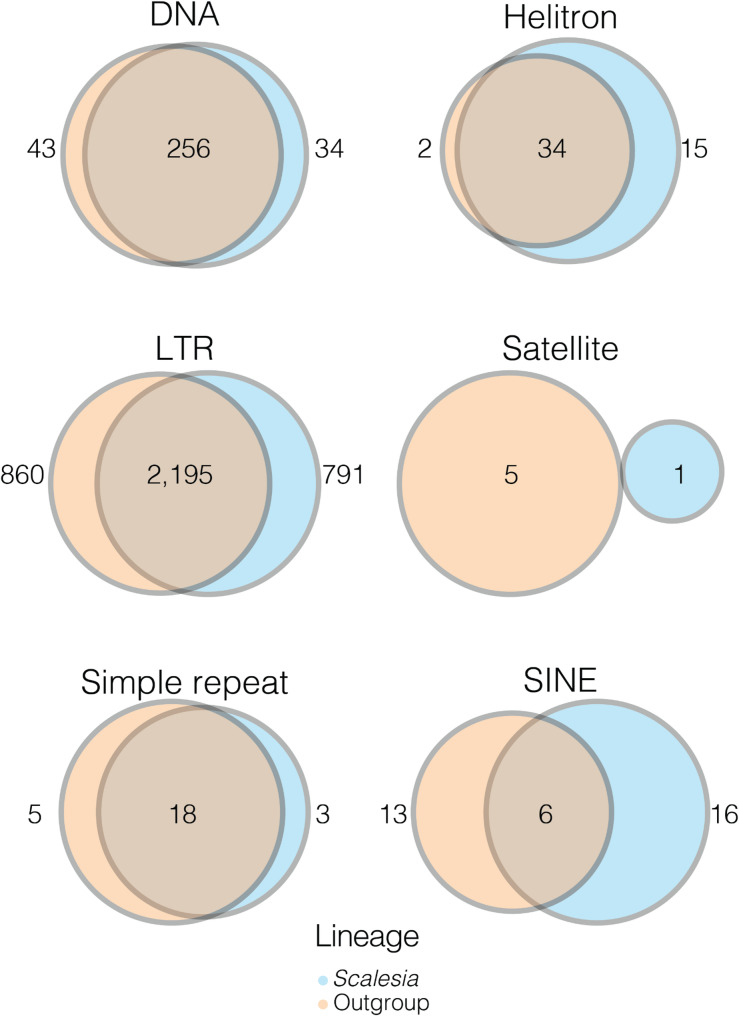 Figure 4
- —NTNU Norwegian University of Science and Technology (incl St. Olavs Hospital - Trondheim University Hospital)
Peer Reviews
No public reviews on file for this paper yet. If you reviewed it on a platform where reviews are public (OpenReview, ICLR, NeurIPS, ICML), you can paste yours below so the community can read it here.
Videos
No videos yet. Explain this paper in a talk, walkthrough, or lecture? Add one.
Taxonomy
TopicsChromosomal and Genetic Variations · Genomics and Phylogenetic Studies · Genetic diversity and population structure
Introduction
Transposable elements (TEs) are mobile DNA sequences that can relocate within a genome [1]. Through their replication and mobility, TEs generate diverse mutations, including alterations in promoter/enhancer gene sequences, frameshifts, intronic modifications and gene duplications within their hosts [2–8]. Some of these mutations have been directly linked to the evolution of novel phenotypes. A notable example is the evolution of the melanic phenotype in the peppered moth (Biston betularia)–the classical textbook example of adaptation– where the insertion of the carb-TE into an intronic region of the cortex gene alters its expression, likely contributing to the dark coloration [9].
Advances in genomic sequencing technology and processing algorithms have greatly facilitated the detection and characterization of TEs, particularly in non-model organisms with limited genomic resources [10]. The evident adaptive potential of TEs in shaping phenotypes [4, 11, 12], such as for the peppered moth, along with the evidence of substantial variation in TE diversity and accumulation across different reference genomes (e.g [13, 14])., has intensified interest in a potential relationship between TEs and diversification. One particularly speculative hypothesis is that lineages with high diversification rates also exhibit elevated rates of TE accumulation on their genomes, as a result of TE bursts [6, 15–22]. For instance, Falcon et al. (2023) hypothesize that TE expansions played a significant role in enabling major evolutionary radiations, such as the water-to-land transition, by enriching cis-regulatory elements with repeat sequences. Oliver and Greene (2009) further propose that episodic surges of TE activity can explain punctuated equilibrium-dynamics and facilitate rapid evolutionary change, particularly in species-rich lineages like rodents and bats, which exhibit high TE activity. Pimpinelli et al. (2019) extend this idea by suggesting that environmental changes can induce TE activation, generating genetic variability that underpins rapid adaptive speciation, as seen in Hawaiian Drosophila. Similarly, de Boer et al. (2007) suggest that bursts of transposon replication activity coincided with the radiation and speciation of salmonid fishes, highlighting the potential for TEs to drive lineage divergence. Belyayev (2014) emphasizes that TE bursts can provoke radical genomic rebuilding, often associated with the genesis of new phylogenetic groups. Ricci et al. (2018) further support this by showing that mammalian taxa with high speciation rates are associated with “hot” genomes characterized by active TEs, whereas those with low speciation rates have “cold” genomes. A key limitation of these studies has been their reliance on a small number of genomes, often with limited taxonomic coverage while encompassing large clades, and primarily based on correlations. While we recognize that locus-specific effects of TE insertions play a significant role in the evolution of novel phenotypes, the evidence linking global bursts of TEs to diversification may be overstated.
Adaptive radiations represent evolutionary experiments where extensive ecological variation aligns with rapid speciation, and they have been a cornerstone of our understanding of evolutionary processes and mechanisms [23–25]. Adaptive radiations can also yield valuable insights into the interplay between TEs and evolutionary success; however, the evidence available is conflicting and largely originated from cichlid radiations. For example, a study examining four species within an African cichlid adaptive radiation found higher TE counts in the genomes and transcriptomes of the radiating species compared to non-radiating lineages [26]. More recent evidence, however, suggested a lack of correlation between species richness at the tribe level in the Lake Tanganyika adaptive radiation and TE content across 245 genomes [27]. Cichlid lineages in the Americas had no discernible differences in TE content when contrasting a radiating lineage (Amphilophus citrinellus) with a non-radiating lineage (Archocentrus centrarchus; [28]. This conflicting body of evidence underscores the necessity for further exploration of TEs as facilitators of diversifications, particularly extending beyond the scope of cichlid radiations.
The Scalesia radiation (Asteraceae, Asterales, Magnoliidae), endemic to the Galápagos archipelago, presents an excellent opportunity to investigate the potential relationship between TEs and diversification. This genus comprises ~ 15 species that evolved from a single common ancestor which diversified about 1 million years ago [29]. The recent origin of this radiation facilitates the reconstruction and tracking of TE accumulation over time. Furthermore, Scalesia exhibits remarkable ecological diversity, particularly in its occupation of different soil types and various climate zones (hereafter referred to as climate niches; Fig. 1) [30]. These niches are characterized by large ecological differences involving differences in saltwater exposure, aridity, precipitation, temperature, intense solar radiation. This ecological variation provides an opportunity to explore whether transitions betwen climatic correlate with TE dynamics [14]. Specifically, because the accumulation of TEs can result in an increase in genome size, which is associated with larger stomatal cells with impaired gas exchange efficiency and poor water economy [31], natural selection may regulate genome size in species adapted to arid conditions. Furthermore, hybridization has been documented in this radiation through genomic analyses and the identification of morphological intermediate populations [29]. This provides an opportunity to test a long-standing but rarely observed hypothesis: whether hybridization triggers genomic instability by activating TEs [32–38]. Finally, the reference genome assembly for the group, ideal to understand TE accumulation dynamics [39].
Building on the premise that TEs play a role in diversification dynamics, here we test three hypotheses: (H1) Lineages undergoing rapid speciation and broadening of ecological variation exhibit an increased rate of lineage- or taxon-specific TE accumulation/expansion on their genomes; (H2) Shifts in climatic niches result in a change of selective regimes, with lineages in arid areas experiencing stronger selection for TE removal as a result of selection for smaller cells; and (H3). Hybrids have an increased accumulation of TEs as a result of genome deregulation. To test these hypotheses, we employed whole-genome resequencing of all 15 Scalesia species, four Scalesia morphologically intermediate populations (‘hybrid populations’), and outgroup species, integrating genomic results with ecological data [30, 40].
Materials and methods
Study species and data collection
Scalesia (Asteraceae) is an endemic genus to the Galápagos Islands consisting of approximately 15 species derived from a single common ancestor. The divergence of Scalesia from members of a continental sister lineage, Pappobolus, occurred around 3 million years ago, while most diversification of the group occurred within the last million years [29]. Scalesia occupies a wide array of ecological niches and soil types (Fig. 1) [30], displaying clear environment-phenotype associations [29, 39], as expected in an adaptive radiation [25]. In this study, we sequenced samples representing the entire Scalesia genus, including: S. affinis,* S. aspera*,* S. atractyloides* (var. darwinii), S. baurii (subsp. baurii and hopkinsii), S. cordata,* S. crockeri*,* S. divisa*,* S. gordilloi*,* S. helleri*,* S. incisa*,* S. microcephala*,* S. pedunculata*,* S. retroflexa*,* S. stewartii*, and S. villosa (Supplementary Table 1). Additionally, we carried out sequencing of samples from populations that show evidence of intermediate morphologies, likely as a result of hybridization (hereafter “hybrid population”). The hybridizing populations included only pairs of sister species: S. retroflexa × helleri, S. crockerii × aspera, S. incisa × divisa, and S. stewartii × atractyloides (Supplementary Table 1). We incorporated individuals from the genus Pappobolus (sister group to Scalesia) from the South American continent as the outgroup in some analyses [29, 30], including P. ecuadoriensis, P. hypargyreus, P. juncosae, P. lehmanii, and P. nigrescens. Detailed information and accession numbers regarding the sampling of outgroup species can be found in Fernández-Mazuecos et al. (2020). All samples used are from the Charles Darwin Herbarium or the Copenhagen Herbarium.
Data generation (library preparation and sequencing)
We extracted genomic DNA using the DNeasy 96 Plant Kit (Qiagen) following the manufacturer’s protocol with minor modifications. These modifications consisted of grinding dried leaf tissues in a Qiagen collection microtube with a 3-mm tungsten carbide bead and repeating the membrane washing step with an additional 800 µl of buffer AW2 to remove residual greenish color from the samples. We eluted the DNA from the membranes using 50 µl of buffer AE to obtain a high-concentration DNA yield. The DNA extracts were then sent to the commercial provider Novogene UK for shearing to a mean insert size of 350 bp, double-stranded DNA genomic library preparation, indexing and amplification via PCR, and 150-bp paired-end sequencing on the Illumina NovaSeq 6000 platform. The average sequencing depth was ~ 6x. Three samples used in this study were obtained from the Charles Darwin Research station herbarium and were prepared for genomic sequencing independently. Leaf tissue was disrupted using a Tissue Lyser II (Quiagen), followed by DNA extraction using the DNeasy Plant Mini Kit following the manufacturer’s protocol except for an additional overnight incubation step with 20 µL of proteinase K after cell lysis as described in [41]. DNA was eluted using 62 µL buffer AE. Extracts were then sent to the commercial provider Novogene for double-stranded DNA genomic library preparation, indexing and amplification via PCR, and 150-bp paired-end sequencing on the Illumina NovaSeq 6000 platform. The raw sequencing data generated for this study can be found at the European Nucleotide Archive under accession code PRJEB70770.
Low-coverage phylogenomics
We started by conducting a distance-based phylogenetic reconstruction to investigate the evolutionary history of the Scalesia genus and to establish a backbone for subsequent analyses and interpretations. This analysis was conducted to compare the resulting topology with that obtained by [29] and to assess whether hybrid populations were positioned as sister groups to their presumed parental species. We performed an additional phylogenetic reconstruction, including hybrid populations to confirm the phylogenetic placement of these putative hybrids. We started by quality-filtering the raw Illumina data by identifying and removing adapters and low-quality basepairs using AdapterRemoval v2.3.2 [42]. Subsequently, we used Skmer v3.2.1, a pipeline designed to estimate genetic distances between genomes through a k-mer-based approach. Skmer offers an approach for phylogenetic reconstruction without requiring an assembly and accounts for low-coverage of the samples [43–46]. Running Skmer involved running the module ‘skmer reference’ to process the adapter-trimmed sequencing data, followed by ‘skmer subsample’ to create 100 subsamples of the libraries, and ‘skmer correct’ to correct the distance matrices based on these subsample replicates. To construct a distance-based phylogenetic tree we employed fastme v2.1.5 [47].
TE library construction
We downloaded the reference genome of the sunflower (Helianthus annuus) from its official website (https://www.sunflowergenome.org/; version Ha412HOv2.0-20181130), and used it to generate a sunflower-based TE and repeat library, with the intention of classifying repeats in Scalesia and Pappobolus, using Repeat Modeler v2.0.2 [48]. The Sunflower genome was selected as a reference because it has a high-quality reference genome, and it is equally evolutionary distant from Scalesia and Pappobolus [49]. Building a TE and repeat library based on Scalesia alone could introduce biases when conducting comparisons with the outgroup taxa (but see below). We used the sunflower-based as the base library for subsequent TE detection using dnaPipeTE.
We used dnaPipeTE [50] to extract and characterize TEs and repeat sequences. dnaPipeTE leverages the RNA-seq assembly pipeline Trinity to extract, quantify and assemble sequences, including TEs and other repeats. While the primary objective of dnaPipeTE is to construct representative repeat library, it also detects and quantifies partially assembled TE and repeats (which suffice for estimating the relative abundances on which we rely in this study). Upon the completion of the assembly and collection process, dnaPipeTE categorises TEs and repeats into different classes based on their homology with the TE and repeat library. In the established sunflower library, TE classes included DNA, Helitron, Long interspersed nuclear element (LINE), Long terminal reads (LTR), rRNA, and Short interspersed nuclear elements (SINE). Leveraging RepeatMasker, dnaPipeTE identifies low-complexity sequences, simple repeats, and satellites, guided by a specific coverage threshold. dnaPipeTE has been successfully applied to a diverse array of species, including arthropods, mollusks, and vertebrates (reviewed in [51]), even revealing substantial variation in TE and repeat content at the population-level (e.g [52]). dnaPipeTE is designed to work low-coverage data (< 1×), identifying TEs and repeats by assembling contigs with high coverage (indicating a high copy number within the genome) and subsequently using a database to classify these genomic structures. To check whether lower coverages would not influence our results, we simulated reads using ART [53], specifying Illumina data, 150 bp read length, 10× coverage, and an insert size of 500 bp with a standard deviation of 50 bp. We simulated reads for three randomly selected Scalesia chromosomes (12, 19 and 23) and ran dnaPipeTE specifying the size of the chromosome and different coverages: (0.1×, 0.2×, 0.5×, 1×, 2×, 5×), three times for each chromosome. This showed that the major classes of TEs/repeats were quite similar (Supplementary Fig. 1). We then ran dnaPipeTE on single-end forward reads for each individual separately, downscaling the data to 0.5× coverage, specifying a genome size of 3.2 Gbp [39], one Trinity assembly iteration, and a minimal query percentage of 0.2 [50].
Exploration of patterns
We extracted three outputs from dnaPipeTE: (1) counts of TEs and repeats, which allowed a direct comparison of the number of TEs and repeats accumulated across species; (2) repeat landscape plots, which offered insights into the accumulation of TEs through time (to complement this data, we also ran a repeat accumulation analysis in the chromosome-resolved Scalesia atractyloides genome assembly [39] using RepeatMasker. We used the Kimura substitution level for repeat landscape plots as an indirect metric of TE divergence. This approach is based on the Kimura two-parameter model, which accounts for the differences in transition and transversion rates during nucleotide substitution. This metric is often used as a proxy for the age of TEs, with higher Kimura values indicating older, more diverged elements. While this approach is widely used in TE studies due to its simplicity and computational efficiency, it does have limitations. For example, it assumes a constant rate of evolution across sites and lineages, which may not always hold true; and 3) fasta files containing TE and repeat sequences. Using the sequences in a fasta format, we used OrthoFinder to group TEs and repeats based on sequence similarity [54, 55], and examined the number of TE/repeat orthogroups shared between the outgroup species and Scalesia using UpSet plots and Venn diagrams. To test for differences between groups, we performed a Mann–Whitney U test comparing hybrids vs. non-hybrids, and humid (S. cordata,* S. microcephala*,* S. pedunculata*) vs. arid (S. villosa,* S. stewartii*,* S. atractyloides*,* S. crockeri*,* S. aspera*,* S. retroflexa*,* S. helleri*,* S. gordilloi*,* S. incisa*,* S. divisa*).
We considered the possibility that the limited variation in TE and repeat content observed in some of our results was due to the use of a sunflower-based library, which might be too divergent from Scalesia and Pappobolus. To address this concern, we repeated all the aforementioned analyses using a Scalesia-specific library instead of the sunflower library. To obtain the Scalesia-specific library, we ran RepeatModeler on the Scalesia atractyloides genome [39] and ran DNApipeTE analyses using the same parameters, and running analyses involving the exploration of TE and repeats). Analyses of the Scalesia-specific library found similar patterns to the main results (Supplementary Fig. 2).
Results
Fig. 1. Phylogenetic relationships and transposable element (TE) variation in the Scalesia radiation and the outgroup (genus Pappobolus). (a) Neighbor-joining phylogeny of Scalesia and the outgroup. Hybrid populations are shown below and were not included in the phylogenetic reconstruction. (b) Stacked bar plot illustrating TE and repeat groups (for the analysis displayed here we used the sunflower library; the analysis using a Scalesia-based library is found in Supplementary Fig. 2). Color-coding of the different repeat and TE groups is found in the rightmost part of the figure, where ‘na*’* denotes unidentified TEs. (c) Labelling of the different islands, environments, and soils occupied by different Scalesia species (for hybrids we include only island labelling). Environment and soil labelling follow [30], and black dots indicate uncertainty in environmental characterization
The phylogenetic tree is comprised mostly of short internal branches in Scalesia, as expected in a rapid radiation. Scalesia villosa is positioned as the sister species to all the remaining Scalesia species (Fig. 1A; Supplementary Fig. 3). S. stewartii and S. atractyloides form a clade which is sister to the remaining 12 species. S. affinis, S. microcephala, and S. cordata are grouped together as a clade being sister to a clade including nine Scalesia species, namely S. crockeri, S. aspera, S. retroflexa, S. helleri, S. baurii, S. pedunculata, S. gordilloi, S. incisa, and S. divisa (Fig. 1A; Supplementary Fig. 3). The phylogenetic analysis including hybrid populations placed all hybrids as sister to one of the parental species (Supplementary Fig. 4).
We observed little variation in TE counts among different species, both in relative and absolute terms (Fig. 1B; Supplementary Table 2). When considering all TE classes classified by DnaPipeTE (LTR, LINE, SINE, DNA, Helitron, rRNA, Low_Complexity, Satellite, Simple_repeat, others, na), the outgroup lineages displayed a higher count of TEs and repeats, with an average of 1,382,957,707 bp (max 1‚398,040,697 bp, min 1,368,357,206 bp, standard deviation 12,799,060 bp). Scalesia species (excluding hybrids) exhibited a lower TE and repeat content, with an average of 1,249,051,887 bp (max 1,264,569,945 bp, min 1,223,889,466 bp, standard deviation 1,1922,527 bp). Hybrid Scalesia populations displayed a TE and repeat content averaging 1,253,765,218 bp (max 1,265,750,267 bp, min 1,239,589,542 bp, standard deviation 12,633,031 bp; Fig. 1B). Both Mann-Whitney U tests were non-significant (humid vs. arid: W = 16, P = 1; hybrid vs. non-hybrid; W = 41, P = 0.5744).
Long terminal repeat (LTR) retrotransposons were the largest class of TEs found in the data. Scalesia species (hybrids excluded) had an average of 518,734,809 bp of their genomes composed of LTRs (max 542,466,614 bp, min 439,269,606 bp, standard deviation 24,787,195 bp). The outgroup species had a mean of 719,315,917 bp of their genomes composed of LTRs (max 755,592,383 bp, min 693,803,469 bp, standard deviation 21,926,958 bp), while hybrid Scalesia populations had 532,048,025 bp of LTRs (max 553,999,518 bp, min 504,436,424 bp, standard deviation 23,478,054 bp). In the second largest class of TEs, DNA elements, Scalesia had an average of 53,397,161 bp composed of DNA elements (max 56,653,585 bp, min 45,126,916 bp, standard deviation 2,748,119 bp), while hybrid populations had 53,374,532 bp (max 54,154,091 bp, min 51,526,434 bp, standard deviation 1,238,711 bp). In contrast, the outgroup exhibited fewer DNA elements, with an average of 32,145,458 bp (max 34,376,438 bp, min 30,424,080 bp, standard deviation 1,414,881 bp).
Repeat landscape plots
Fig. 2. Repeat/transposable element landscape plot. The x-axis shows the Kimura substitution level as a metric to estimate the divergence of transposable elements, the y-axis shows the portion of the genome covered by TEs and repeats. Assuming a constant mutation rate, higher Kimura substitution levels indicate older TE ages. The outgroup (genus Pappobolus) is plotted in orange, and all Scalesia species in blue. Repeat accumulation landscape plots for each specimen, coloured by TE classes, are on Supplementary Figs. 7–11
The repeat landscape plot shows that all Scalesia species exhibit a similar pattern of TE and repeat accumulation (Fig. 2; Supplementary Fig. 5). All outgroup species have a similar accumulation of TEs, which is distinct from that of Scalesia. Specifically, there is a younger accumulation of TEs in the outgroup relative to Scalesia (Fig. 2; Supplementary Fig. 5). In all the landscape plots, the TE/repeat accumulation peak of Scalesia is at a Kimura substitution level of approximately 5 (Fig. 2; Supplementary Figs. 6). The repeat landscape plots decomposed in different TE and repeat classes show that the accumulation of TEs and repeats does not differ when comparing the outgroup (Supplementary Fig. 7), Scalesia (Supplementary Fig. 8–10), and Scalesia hybrids (Supplementary Fig. 11).
Organization of genome-specific elements
Fig. 3. UpSet plot of long terminal repeat elements (LTR) identified within the Scalesia radiation (other TE and repeat groups are found in Supplementary Figs. 12–16). The UpSet plot is an alternative visualisation to a Venn diagram where the y-axis on the top graphic shows a frequency of LTR orthogroups (groups of closely related LTRs) and the x-axis shows different combinations of the data (the first column includes orthogroups present in all Scalesia, the second column are orthogroups exclusive to S. retroflexa x helleri hybrids, the third column are orthogroups exclusive to S. atractyloides). Dark grey circles highlight species combinations
Using OrthoFinder, we grouped TEs and repeats into orthogroups, that are sets of orthologous sequences derived from the last common ancestor of all species under consideration (Fig. 2; Supplementary Figs. 12–16). We found that the majority of TE orthogroups are present in all Scalesia. The sole exception was in the satellite elements, for which we detected very few shared orthologs. In the largest class, LTR, we found 8,381 orthogroups present in all Scalesia genomes, while only 458 − 255 orthogroups were found to be unique to a single genome (Fig. 3).
Superfamily-level analyses show that TE figures were remarkably even in Scalesia (Table 1) and the outgroup (Table 1). With the exception of LTR/Gypsy and LTR/Copia, all TE counts were below 50,000 elements and were remarkably even across Scalesia species. LTR/Gypsy and LTR/Copia included between 2,500,000–983,398 elements (Table 1).
Fig. 4. Representation of orthogroups present in Scalesia (blue) or the outgroup (orange). Shared orthogroups are given as overlap for different TEs and repeats
We used OrthoFinder to identify orthogroups of TEs and repeats in five randomly chosen Scalesia species and five outgroup Pappobolus species, and parsed the results to compare counts of Scalesia-specific orthogroups, outgroup-specific orthogroups, and orthogroups shared between the two genera (Fig. 4). We chose to downscale the data to five random species because we observed imbalances in estimations that arose from analysing the 15 Scalesia species in comparison to only five outgroup species (two specimens of P. hypargyreus were included; Figure 4). Since we downscaled the data to only five Scalesia species, we repeated the analyses three times, finding that the results were consistent across the three iterations (Supplementary Table 3). The largest three classes of TEs (LTR, DNA and Helitron) had a majority of its orthogroups common to Scalesia and the outgroup. Scalesia had more private SINEs than the outgroup (Fig. 4).
Table 1TE superfamily counts for different Scalesia speciesSINE/RTESINE/tRNARC/HelitronLTR/PaoLTR/GypsyLTR/ERVKLTR/CopiaLTR/CaulimovirusLTR/CassandraLTRLINE/RTELINE/R1LINE/L2LINE/L1LINE/CREDNA/hATDNA/TcMarDNA/PIFDNA/MULEDNA/CMC P. ecuadoriensis 371386916,3503713,305,9845692983,12344404347460228681323235739,398689458,136419531,01241,56832,994 P. hypargyreus (a34) 507313716,0226553,462,12161851,106,01433139154519332621049922245,614664056,465451433,85646,67434,807 P. hypargyreus (a62) 490332717,8245793,245,81756471,031,93331335205499129621197479638,229759560,699482131,62142,20535,443 P. juncosae 489362316,6616933,204,9556596984,29627855088540530911152617641,903619059,839513932,29643,97836,171 P. lehmanii 463330322,8777253,303,58073831,087,98824214651586632571739888842,572617756,389406832,61047,56339,326 P. nigrescens 421364221,9758473,271,27075111,130,55117727352542136351885689343,556671860,297380133,47950,03739,566 S. affinis 156710,15512,72415312,062,55618411,117,21010,56910,179232778583577160651,78419,981127,256457133,46659,21946,262 S. aspera 153810,26012,62213922,054,92317661,130,84594709795268181713713105248,72121,387128,320470633,54956,73845,085 S. atractyloides subsp. atractyloides 149011,04111,36616041,903,21513951,075,42911,5336980243180833499104646,97419,831121,523473430,84054,04048,147 S. atractyloides subsp. darwinii 1767937712,18716061,934,23316711,117,86910,5828163216880813386117549,30820,594130,617508835,54059,71353,550 S. baurii subsp. baurii 1679974911,53015761,966,60215871,135,162729611,271208678094015117948,00918,545130,197487433,60858,12949,340 S. baurii subsp. hopkinsii 1799958815,32712391,971,28811981,161,05988568890230779553936144149,70019,138129,198505232,87354,93949,547 S. cordata 193210,61113,61717561,954,95210611,129,92476308952288882932961179344,30820,436129,685499934,62059,11948,519 S. crockeri 151910,13214,24316052,010,33010201,126,15281337828235977111968134248,43420,218129,001469833,94460,17749,633 S. divisa 174311,06011,80216751,968,86418521,125,339880310,585276278183033131047,92420,110134,834635934,27258,44847,176 S. gordilloi 1995941912,62516881,862,60313141,104,22895517757193079333512113446,69917,953128,123501732,84056,92250,052 S. helleri 164310,27511,46416591,910,3248341,134,23586206981221281864566116655,73618,181131,455530733,70561,17250,961 S. crf retroflexa x helleri (hybrid) 196110,87912,20116431,976,36810931,120,13476767716241181203053137551,21720,382129,192491135,95959,19747,648 S. crockeri x aspera (hybrid) 155610,28012,97315511,887,47718221,092,08610,7158552224175363197175745,65318,382124,401492431,96555,80746,250 S. incisa x divisa (hybrid) 133410,13813,62616702,074,43114821,171,67081339377244479144062112152,29420,908126,123494734,49260,65650,053 S. stewartii x atractyloides (hybrid) 190710,49510,71414562,116,78318911,142,462893911,942276477772604106751,78421,833124,489473734,28964,95747,572 S. incisa 1833981012,08013751,965,78111991,147,14490869953224576873302192347,57618,695126,281453532,91055,61446,353 S. microcephala 153610,06613,04218302,023,81312321,174,98710,2849920238791554019130047,64120,498129,912506634,97066,41454,403 S. pedunculata 1905983414,04115961,798,2109101,081,40994757362188683693102131848,24617,922133,988495132,76753,91345,367 S. retroflexa 206210,59611,00119582,007,46615211,144,56279918248237883314019130449,00421,464125,144527334,87963,42649,993 S. stewartii 188410,13311,47618311,990,80427001,100,148944112,371264683393255149756,63721,333130,720479532,63370,14447,267 S. villosa 1457763111,93711761,626,8771630983,39810,836561016436482319286943,47514,025116,518449226,79245,92841,713
Discussion
Transposable elements (TEs) play a crucial role in shaping genomes and in spurring phenotype diversity. Here, we tested whether rapid diversification, shifts in climatic niches or hybridization are associated with an increase of TE accumulation in the genomes of the genus Scalesia, a radiation endemic to the Galápagos (Fig. 1). Our results show that TE or repeat accumulation is consistent across the Scalesia phylogeny, with no major changes across species (Fig. 1) or over time (Fig. 2). We also found no evidence of lineage-specific TE or repeat expansions, as most TE groups were found across all species (Fig. 3), in similar numbers across the explored genomes (Table 1), and shared with the outgroup (Fig. 4). Our findings indicate that neither rapid diversification, hybridization, nor ecological niche shifts are significantly associated with TE and repeat content variation within the Scalesia adaptive radiation. This suggests that greater nuance is needed in the literature regarding the role of TEs: while they can be crucial at the locus level, driving the evolution of novel phenotypes, their macroevolutionary correlations between TE content and diversification or speciation appear tenuous.
Limited variation in TE content in Scalesia despite rapid diversification
We found no major differences in TE or repeat content in different Scalesia species in any of the analyses performed and focusing on phylogenetic comparisons, accumulation over time, and class-specific expansions (Figs. 1–05). The lack of variation may be attributable to the methods used, but this seems unlikely since dnaPipeTE retrieved variation between Pappobolus and Scalesia, suggesting that the two lineages have accumulated different TEs and repeats after their split, about 3 million years ago [29]. dnaPipeTE has been shown to detect population-level differences [52, 56–58], and between closely related species across the Tree of Life [59–65]. One tempting explanation for the lack of variation is that dnaPipeTE may be biased to find conserved old elements, thereby explaining the observed patterns. However, this is not the case as dnaPipeTE is very sensitive in detecting recent TE families, being less sensitive to older TE families due to increased divergence and short reads that limits alignments, as shown for the human genome (see supplementary data included in [50]). We therefore suggest that TEs are under phylogenetic inertia, as shown for various Drosophila species [66]. Our findings suggest that the fundamental TE composition remains conserved across Scalesia lineages.
The lack of variation in TE and repeat content in Scalesia is noteworthy. In our dataset, we observe a variation of 4.60% in LTRs, and 4.58% of variation in DNA elements. This variation is very little when compared to other works focusing on congeneric species. For instance, in the plant genus Passifora, Tekay LTR-elements varied between 8.52 and 35.71% and Angela LTR-elements between 1.96 and 29.05% (absolute estimates considering the whole genome; [67]. In oaks (Quercus) LTRs varied between 34.07 and 55.05% (relative TE content; [68]. In Rhodnius bugs, with different ecologies, Tc1/Mariner elements varied between 14.3 and 25% [65], while in Diabrotica beetles MITE elements varied between 150 and 610 MegaBasepairs [64].
One potential explanation for the observed lack of species-specific TEs is the high repeat content of the Scalesia genome. Our previous analyses revealed that approximately 80% of the Scalesia atractyloides genome is composed of repetitive sequences [39]. This high repeat content could be due to the presence of numerous repeat families that actively replicate with a strong phylogenetic signal, rather than a dynamic turnover of species-specific repeat families with a low copy number. In this regard, Novák and colleagues (2020) found that TE content reaches a plateau at around 80% across angiosperms with genome sizes between 5 and 10 Gbp [69]. It is possible that a plateau of TE content could be maintained, with few families represented at high numbers, and that a dynamic turnover occurs within families, rather than between TE families.
Our findings challenge the notion that lineages with high diversification and speciation rates also display elevated rates of TE content accumulation. One caveat to this interpretation is that the sister lineage to Scalesia, including Pappobolus, may have undergone similar diversification on the mainland [29]. In any case, the role of TEs in adaptive radiation remains debated, with some studies demonstrating their importance as drivers of radiation [70, 71], while others proposing a less significant role [27, 28]. This discrepancy likely stems from the scale and data employed. Specifically, the correlation between TE content and diversification is mostly based on limited genomic data, correlational analyses and a narrow taxonomic scope, and this might have led to an overestimation of TEs’ role. For instance, an initial analysis of four transcriptomes and genomes of East African cichlids, compared to tilapia and other teleosts, suggested a higher accumulation of TE counts during the radiation [26]. In contrast, recent evidence involving analyses of hundreds of genomes found no relationship between species diversity and TEs within different tribes of the Tanganyika radiation [27]. While this does not negate the compelling experimental evidence supporting the role of TEs in driving the evolution of specific phenotypic change, such as the elegant findings of Kratochwil and colleagues demonstrating that a TE insertion triggered the emergence of a novel phenotype, the cichlid gold morph [11], it casts doubt on a macroevolutionary role of TEs in diversification dynamics. Our data, which spans an entire adaptive radiation, seems to support the notion that TE accumulation and diversification are not correlated. Considering this, we suggest that caution should be taken with potential overestimation of the role of TEs as major driving forces in speciation and ecological diversification at the macroevolutionary scale in all cases (e.g [15–22, 72–74]). While TEs offer a convenient explanation for rapid evolution, it is likely that they are merely “along for the ride” and may only be purged when they reach problematic levels of replication.
TEs and ecological variation
The minimal variation in TE accumulation observed in Scalesia suggests that the climatic niche does not significantly influence TE content within the radiation. In adaptive radiations, closely related species typically occupy distinct ecological niches [24, 25, 75]. In Scalesia, species exhibit distinct climatic niches (Fig. 1) [29, 30, 40], with temperature and the presence of arid environments being key factors shaping the evolution of the radiation [29, 39, 40]. Various studies have demonstrated that aridity exerts a significant selective pressure on plant genome size reduction (e.g [14, 76])., as this correlates nearly 1-to-1 with smaller cell sizes [77]. Smaller cells improve water economy as smaller stomata respond more efficiently to water stress, enhance gas exchange regulation, and optimize photosynthetic performance [31, 78, 79]. Given that arid environments favor smaller cells, aridity is hypothesized to be an important selective pressure regulating genome size [14]. Therefore, it would be expected that TEs are being purged in species occupying arid coastal areas (e.g. S. affinis), where temperatures frequently reach 40 °C throughout the year and water stress is pervasive, compared to species found in the humid highlands (e.g., S. pedunculata), where conditions are consistently moist and cooler. This leads to an alternative hypothesis: selection is unable to effectively remove TE as the removal of a single TE, only a few kilobases in size, might be ‘invisible’ in a genome of 3–4 gigabases [80].
TEs and hybridization
The four putative hybrid populations, diagnosed based on intermediate morphology, examined in this study exhibited similar TE content to non-hybrid populations, excluding the possibility of TE burst as a result of hybridization. Traditionally, hybridization has been perceived as a detrimental force to the integrity of species [81], and it has been proposed that hybridization may lead to genome destabilisation by promoting TE activity [1, 82]. The presence of more TEs in hybrid populations would be expected in a scenario involving TE bursts triggered by multi-generational hybridization. In such cases, increased TE transcription should lead to more TEs insertions in the hybrid genomes, and a consequent increase of genome size. However, the case in Scalesia, as evidenced by the absence of supporting patterns in the repeat accumulation curves (Fig. 2), the lack of superfamily expansion or super-family level (Fig. 3), and absolute accumulation (Fig. 1). These findings are in agreement with those of [83], who demonstrated no evidence of LTR retrotransposon proliferation when comparing multiple hybrid populations of Helianthus annuus (sunflower) × H. petiolaris. This result suggests that post-transcriptional repression mechanisms may prevent the proliferation of LTRs [83]. A similar scenario may be at play in Scalesia, but additional data would be required to confirm this hypothesis.
Conclusions
Our results highlight the importance of distinguishing between the locus-specific effects of TEs and their global genomic impact (‘bursts of TEs’). Transposable elements are undeniably important drivers of locus-specific and phenotypic-specific evolution, as evidenced by numerous studies demonstrating their role in generating novel genetic variation and facilitating adaptive traits [9, 11]. However, our findings in the Scalesia radiation challenge the notion that global bursts of TE activity are a primary driver of diversification at macroevolutionary scales. Despite rapid speciation, ecological niche shifts, and hybridization events within Scalesia, we observed remarkably stable TE accumulation across species, with no significant variation linked to diversification, climatic adaptation, or hybridization. This suggests that while TEs may play a critical role in generating localized genetic variation and phenotypic innovation, their broader impact on lineage-wide diversification and adaptive radiation may be overstated.
Electronic supplementary material
Below is the link to the electronic supplementary material.
Supplementary Material 1
The reference list from the paper itself. Each links out to its DOI / PubMed record.
- 1Conart C, Saclier N, Foucher F, Goubert C, Rius-Bony A, Paramita SN et al. Duplication and Specialization of NUDX 1 in Rosaceae Led to Geraniol Production in Rose Petals. Mol Biol Evol [Internet]. 2022;39. Available from: 10.1093/molbev/msac 00210.1093/molbev/msac 002PMC 885792635022771 · doi ↗ · pubmed ↗
- 2Cerca J, Armstrong EE, Vizueta J, Fernández R, Dimitrov D, Petersen B et al. The Tetragnatha kauaiensis Genome Sheds Light on the Origins of Genomic Novelty in Spiders. Genome Biol Evol [Internet]. 2021;13. Available from: 10.1093/gbe/evab 26210.1093/gbe/evab 262PMC 869371334849853 · doi ↗ · pubmed ↗
- 3Oliver KR, Greene WK. Transposable elements and viruses as factors in adaptation and evolution: an expansion and strengthening of the TE-Thrust hypothesis [Internet]. Ecology and Evolution. 2012. pp. 2912–33. Available from: 10.1002/ece 3.40010.1002/ece 3.400PMC 350164023170223 · doi ↗ · pubmed ↗
- 4Cerca J, Cotoras DD, Bieker VC, De-Kayne R, Vargas P, Fernández-Mazuecos M et al. Evolutionary genomics of oceanic island radiations. Trends Ecol Evol [Internet]. 2023; Available from: 10.1016/j.tree.2023.02.00310.1016/j.tree.2023.02.00336870806 · doi ↗ · pubmed ↗
- 5Brawand D, Wagner CE, Li YI, Malinsky M, Keller I. The genomic substrate for adaptive radiation in African cichlid fish. Nature [Internet]. 2014; Available from: https://www.nature.com/articles/nature 1372610.1038/nature 13726 PMC 435349825186727 · doi ↗ · pubmed ↗
- 6Lata D, Coates BS, Walden KKO, Robertson HM, Miller NJ. Genome size evolution in the beetle genus Diabrotica. G 3 [Internet]. 2022;12. Available from: 10.1093/g 3journal/jkac 05210.1093/g 3journal/jkac 052PMC 898239835234880 · doi ↗ · pubmed ↗
- 7Castro MRJ, Goubert C, Monteiro FA, Vieira C, Carareto CMA. Homology-Free Detection of Transposable Elements Unveils Their Dynamics in Three Ecologically Distinct Rhodnius Species. Genes [Internet]. 2020;11. Available from: 10.3390/genes 1102017010.3390/genes 11020170 PMC 707358232041215 · doi ↗ · pubmed ↗
- 8Sessegolo C, Burlet N, Haudry A. Strong phylogenetic inertia on genome size and transposable element content among 26 species of flies. Biol Lett [Internet]. 2016;12. Available from: 10.1098/rsbl.2016.040710.1098/rsbl.2016.0407 PMC 501403527576524 · doi ↗ · pubmed ↗