NCAPG2 is a diagnostic biomarker associated with immune infiltration in cholangiocarcinoma
Zhaojun Huang, Xiaohang Niu, Mingjin Zhang, Xiaoming Wei

TL;DR
NCAPG2 is a potential biomarker for diagnosing cholangiocarcinoma and is linked to immune cell activity in the tumor environment.
Contribution
This study identifies NCAPG2 as a novel diagnostic biomarker and explores its association with immune infiltration in cholangiocarcinoma.
Findings
NCAPG2 is overexpressed in cholangiocarcinoma and has diagnostic significance.
Higher NCAPG2 levels correlate with immune cell infiltration in cholangiocarcinoma.
NCAPG2 is functionally linked to DNA-related processes and pathological classification of CHOL.
Abstract
Cholangiocarcinoma (CHOL) is the second largest malignant tumor in the bile duct, only after primary liver cancer. Their high invasiveness can lead to poor prognosis. Over the past decade, research on CHOL has been ongoing, but there have been no breakthrough advancements. According to the literature, NCAPG2 is associated with the progression of various tumors, but its relevant role and value in CHOL have not been extensively studied. We studied the expression of NCAPG2 in CHOL and its clinical and pathological diagnostic value based on TCGA and GEO datasets. We evaluated the association between NCAPG2 and immune-related cells in CHOL using the TISIDB database. We found that NCAPG2 has a higher expression level in CHOL and diagnostic significance in patients with CHOL. Additionally, we observed a correlation between immune cell infiltration and NCAPG2 levels in CHOL. Furthermore,…
Genes, proteins, chemicals, diseases, species, mutations and cell lines named across the full text — each resolved to its canonical identifier and authoritative record.
Click any figure to enlarge with its caption.
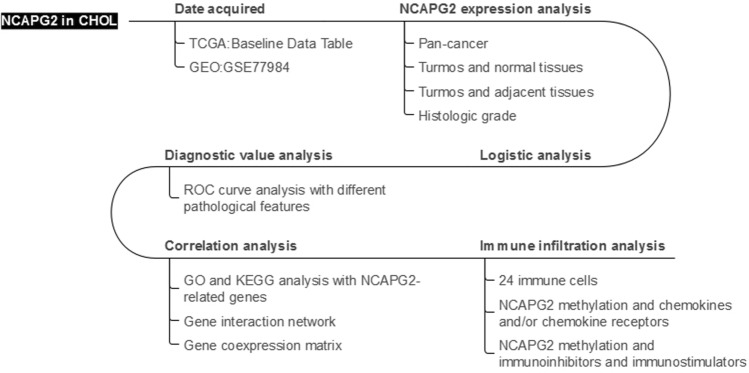 Figure 1
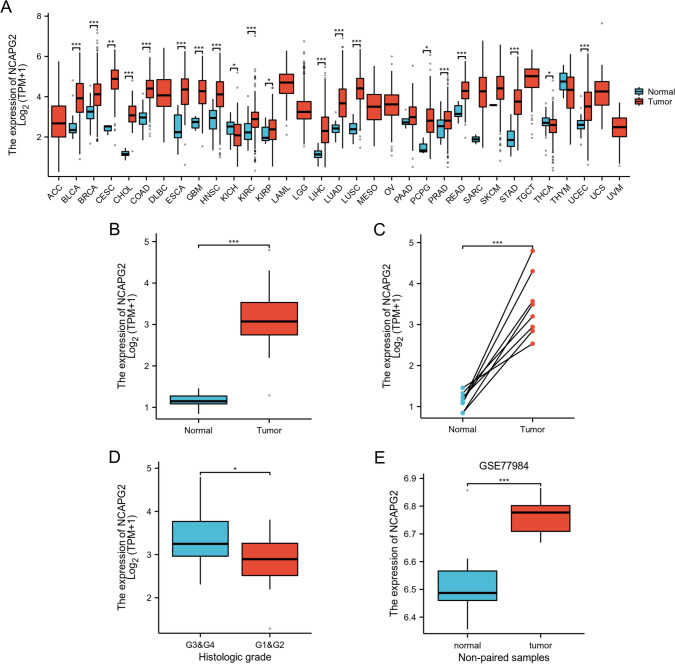 Figure 2
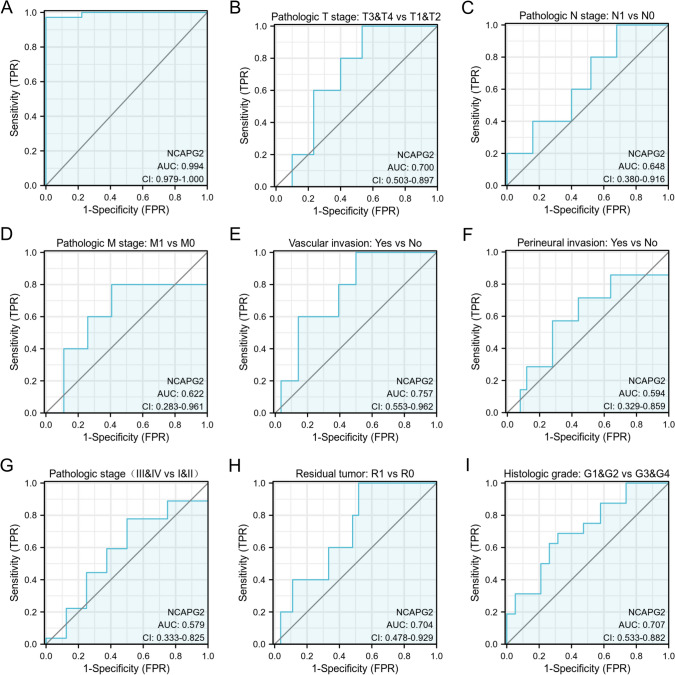 Figure 3
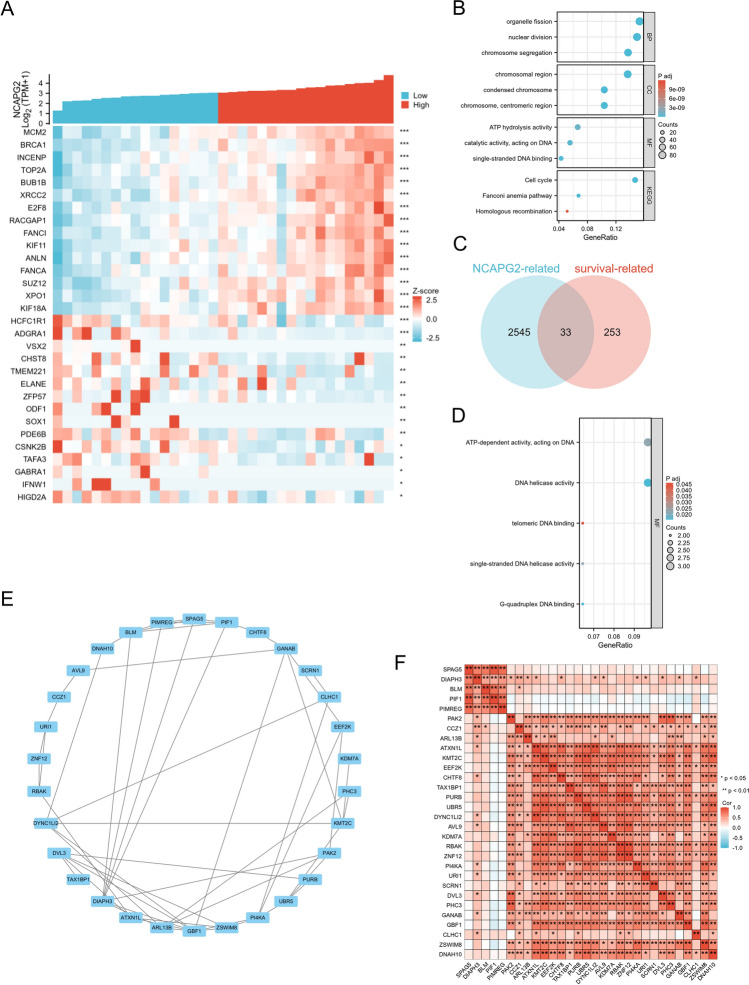 Figure 4
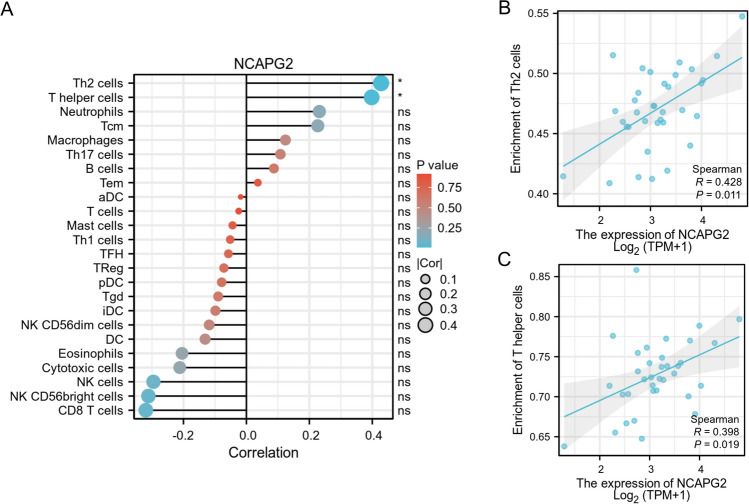 Figure 5
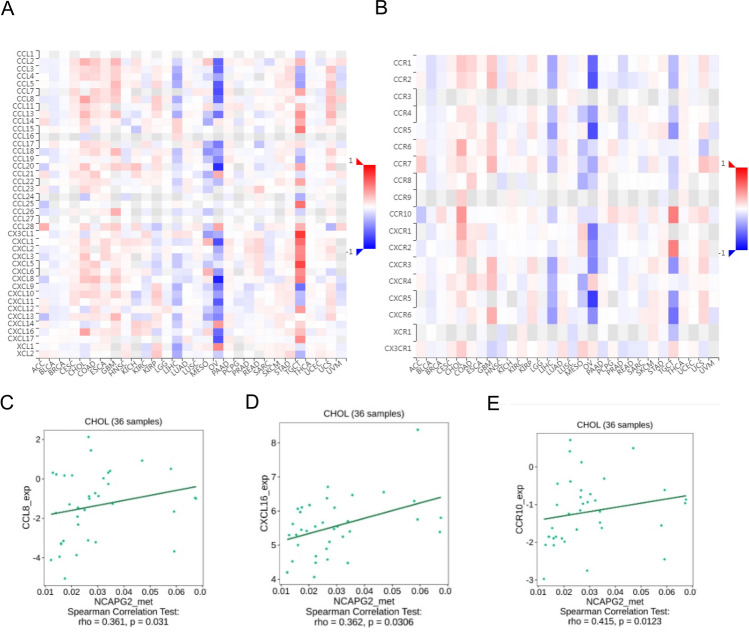 Figure 6
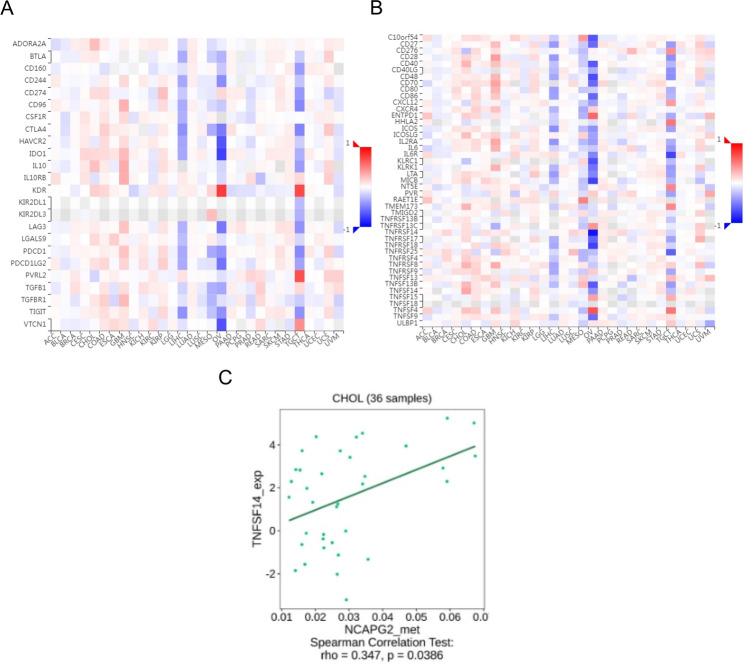 Figure 7
- —The 901st Hospital of PLA
Peer Reviews
No public reviews on file for this paper yet. If you reviewed it on a platform where reviews are public (OpenReview, ICLR, NeurIPS, ICML), you can paste yours below so the community can read it here.
Videos
No videos yet. Explain this paper in a talk, walkthrough, or lecture? Add one.
Taxonomy
TopicsCholangiocarcinoma and Gallbladder Cancer Studies · RNA modifications and cancer · Ferroptosis and cancer prognosis
Introduction
Cholangiocarcinoma is a type of cancer that originates from the epithelial cells of the bile duct, which poses significant clinical challenges due to its often late diagnosis and aggressive nature [1–3]. This disease not only inflicts considerable morbidity and mortality on affected individuals but also imposes a substantial economic burden on healthcare systems, particularly in regions with high prevalence rates [4, 5]. Current treatment modalities for CHOL primarily include surgical resection, liver transplantation, and palliative care, with chemotherapy and targeted therapies being employed in advanced stages [1]. However, these approaches are frequently limited by factors such as late-stage presentation, inherent resistance to conventional therapies of tumors, and the lack of early detected biomarkers [2]. As a result, there is an urgent requirement for novel diagnostic and treatment approaches aimed at enhancing patient results and bridging the considerable knowledge gaps in the pathogenesis and advancement of CHOL. This underscores the necessity of further research in this domain to enhance clinical management and therapeutic efficacy for CHOL.
The current investigation centers on the phenotypic effects associated with NCAPG2, a gene known to play a role in multiple cellular mechanisms, such as regulating the cell cycle and maintaining chromosomal stability [6, 7]. Previous research has established a relationship between NCAPG2 expression levels and tumorigenesis, particularly in cancers such as breast and colorectal cancer, where its overexpression has been associated with poor prognosis and aggressive disease phenotypes [8, 9]. Furthermore, NCAPG2 has been linked to the modulation of immune responses, suggesting its potential role in the tumor microenvironment [10, 11]. These associations underscore the significance of NCAPG2 in the pathophysiology of cancer, highlighting its potential for targeted therapy and biomarkers in disease progression, thereby emphasizing the innovative nature of our investigation into its functional roles and clinical implications.
In our research, we used a comprehensive bioinformatics approach utilizing data from The Cancer Genome Atlas (TCGA) to investigate the expression of NCAPG2 in CHOL and its potential diagnostic value. This methodology is advantageous as it allows for the integration of large-scale genomic data, facilitating the identification of biomarkers that may enhance diagnostic accuracy and therapeutic strategies. In this study, our main objective was to elucidate the role of NCAPG2 in CHOL, particularly its expression levels and their correlation with tumor immune response and methylation patterns. Through the examination of the relationship between the expression of NCAPG2 and several clinical factors, such as tumor staging and the infiltration of immune cells, we aim to provide insights into the potential of NCAPG2 as a diagnostic marker and its implications in tumor immunity.This research enhances the comprehension of the pathophysiology associated with CHOL and underscores the importance of NCAPG2 within the realm of cancer immunotherapy.
Materials and methods
Data acquisition
We obtained a dataset of mRNA expression that includes 44 samples of CHOL and 9 adjacent non-tumor samples, utilizing RNA sequencing with transcripts per million (TPM) metrics. This dataset was obtained from TCGA database (https://cancergenome.nih.gov) [12]. Through the GEO database (https://www.ncbi.nlm.nih.gov/geo/) [13], we accessed gene expression profiles of the GSE77984 dataset [14], which comprises 10 CHOL samples and 12 normal human cholangiocyte samples.
Protein–protein interaction network
We obtained the data of protein–protein interactions from the STRING database (https://cn.string-db.org/) and constructed the protein–protein interaction network of genes co-expressed relate to NCAPG2 [15].An interaction was considered statistically significant if it had a combined score > 0.15. The Cytoscape 3.10.1 application was used to construct the network [16].
Functional enrichment analysis
We conducted a thorough analysis to find the biological processes and pathways that NCAPG2 probably influence. We began by identifying 2,578 genes associated with NCAPG2 in CHOL using data from TCGA. Additionally, we found 286 genes related to survival outcomes in CHOL. These genes were then subjected to enrichment analysis through Gene Ontology(GO), which includes biological processes, cellular components, and molecular functions, as well as Kyoto Encyclopedia of Genes and Genomes(KEGG) pathway analyses.The Database for Annotation,Visualization, and Integrated Discovery (DAVID) was used to perform this analysis [17], and the R package was used to visualize the results. We set a significance threshold with a corrected p-value of less than 0.05 to ensure the reliability of our findings.
Immune infiltration analysis
We used the single-sample gene set enrichment analysis (GSEA) method to perform the analysis of immune infiltration in CHOL samples. 24 different types of immune cell were analysed, and the relationships between CHOL and each specific immune cell subset were explored with Spearman’s correlation coefficient.
LinkedOmics database analysis
We explored the expression profile of NCAPG2 by the LinkedOmics database (http://www.linkedomics.org). Furthermore, we conducted an analysis of GO and KEGG pathways related to NCAPG2. And we employed GSEA to analysed its co-expressed genes within the Link Interpreter module [18].
TISIDB database analysis
To identify interactions between cancers and immune system, we used the TISIDB (http://cis.hku.hk/TISIDB/) [19]. To investigate the immunological importance of NCAPG2 in cancer, we explored the relationship between NCAPG2 methylation levels and immune checkpoint gene expression through the immune regulatory function of the TISIDB database. Furthermore, the correlation between the expressions of NCAPG2 methylation levels and chemokines along with their corresponding receptors was analyzed through the"chemokine"module.
Statistical analysis
We used the box plots to evaluate the expression levels of the NCAPG2 in patients with CHOL. The median expression value of NCAPG2 served as the threshold for categorizing gene expression. The Wilcoxon signed-rank test and logistic regression analyses were used to investigate the relationship between NCAPG2 expression in CHOL and clinical characteristics. Furthermore, we conducted diagnostic receiver operating characteristic(ROC) analysis to evaluate the potential diagnostic utility of NCAPG2 expression, which also helped clarify its influence on other clinical parameters. All statistical analyses were performed using R statistical software (version4.2.1), and a p-value of less than 0.05 was deemed statistically significant. Figure 1 presents a workflow of the study.Fig. 1. Workflow of the study
Results
Patient baseline data sheet
A total of 35 patients diagnosed with (CHOL), along with their clinical characteristics, were obtained from the TCGA database. Table 1 details demographic and clinical characteristics. There were 19 females (54.3%) and 16 males (45.7%) in the study。In the study, a total of 35 patients were analyzed, with 17 individuals (48.5%) being 65 years old or younger, and 18 individuals (51.4%) being over the age of 65. According to CHOL stage, 18 patients (51.4%) in stage I, 9 (25.7%) in stage II, one (2.9%) in stage III and 7 (20%) in stage IV. Moreover, five patients (15.1%) had vascular invasion, while seven patients (21.8%) had perineural invasion. According to histological grade, one patient in grade 1 (2.9%), 15 in grade 2 (42.9%), 17 in grade 3 (47.6%) and two in grade 4 (5.8%). Table 1. Clinical characteristics of patients with CHOLCharacteristicsLow expression of NCAPG2High expression of NCAPG2P valuen1718Pathologic stage, n (%)0.657 Stage I7 (20%)11 (31.4%) Stage II5 (14.3%)4 (11.4%) Stage III1 (2.9%)0 (0%) Stage IV4 (11.4%)3 (8.6%)Pathologic T stage, n (%)0.276 T17 (20%)11 (31.4%) T26 (17.1%)6 (17.1%) T34 (11.4%)1 (2.9%) T40 (0%)0 (0%)Pathologic N stage, n (%)1.000 N012 (40%)13 (43.3%) N12 (6.7%)3 (10%)Pathologic M stage, n (%)0.333 M012 (37.5%)15 (46.9%) M14 (12.5%)1 (3.1%)Gender, n (%)0.505 Female8 (22.9%)11 (31.4%) Male9 (25.7%)7 (20%)Weight, n (%)1.000 ≤ 706 (17.1%)6 (17.1%) > 7011 (31.4%)12 (34.3%)Age, n (%)0.181 ≤656 (17.1%)11 (31.4%) > 6511 (31.4%)7 (20%)BMI, n (%)0.457 ≤256 (17.6%)4 (11.8%) > 2510 (29.4%)14 (41.2%)Residual tumor, n (%)0.645 R012 (37.5%)15 (46.9%) R13 (9.4%)2 (6.2%)Histologic grade, n (%)0.082 G11 (2.9%)0 (0%) G210 (28.6%)5 (14.3%) G35 (14.3%)12 (34.3%) G41 (2.9%)1 (2.9%)CA19-9 level, n (%)0.711 Normal8 (27.6%)5 (17.2%) Abnormal8 (27.6%)8 (27.6%)Vascular invasion, n (%)0.335 No15 (45.5%)13 (39.4%) Yes1 (3%)4 (12.1%)Perineural invasion, n (%)0.394 No11 (34.4%)14 (43.8%) Yes5 (15.6%)2 (6.2%)OS event, n (%)1.000 Alive8 (22.9%)9 (25.7%) Dead9 (25.7%)9 (25.7%)DSS event, n (%)1.000 No9 (26.5%)9 (26.5%) Yes8 (23.5%)8 (23.5%)BMI body mass index, DSS disease-specific survival, OS overall survival, NCAPG2 non-SMC condensin II complex subunit G2
The expression of NCAPG2 is upregulated in CHOL
To investigate the difference of NCAPG2 expression levels between normal and tumor tissues, the mRNA expression data for NCAPG2 was obtained from a variety of tumors and their corresponding normal tissues, as provided in the TCGA database. Then, we analysed its expression using the R programming language. The findings revealed a significant increase in the expression of NCAPG2 across a range of tumor tissues. This elevation was observed in various cancers, including CHOL, breast cancer, bladder urothelial carcinoma, hepatocellular carcinoma, lung adenocarcinoma and so on, when compared to their normal tissue counterparts (Fig. 2A). We compared the mRNA expression levels of NCAPG2 from tumor tissues with the adjacent non-tumor tissues. For normal tissues, our results indicated that the expression of NCAPG2 in CHOL was significantly higher. (p < 0.001; Fig. 2B). This increase was consistent in both CHOL and adjacent coupled cancer tissues (Fig. 2C). We analyzed the mRNA expression data of NCAPG2 across various clinical subcategories within the TCGA database. These results showed that elevated expression of NCAPG2 had an obviously correlation with histologic grade (p < 0.05) (Fig. 2D). Following this, we explored the relationship between different clinical parameters and patient prognosis using logistic regression analysis, which showed a link between histologic grade and overall survival (OS) (Table 2). These results suggest that NCAPG2 is notably upregulated in CHOL. To verify the expression profile of NCAPG2 in CHOL, we also examined an independent external dataset from GEO (GSE77984), focusing on the transcription levels of NCAPG2 in cancerous versus normal tissues. The results confirmed that NCAPG2 transcription levels in CHOL were obviously higher than in normal tissues (Fig. 2E). Overall, these findings support the conclusion that NCAPG2 is highly expressed in CHOL.Fig. 2. The expression level of NCAPG2 in different human cancers. A NCAPG2 expression in datasets from the TCGA database between multiple types of tumors and normal tissues. B–D NCAPG2 expression in normal tissues and paired adjacent tissues [unmatched tissues B and matched tissues (C)] and tumor tissues from patients with different clinical characteristics in TCGA [Histologic grade (D)]. E Expression of NCAPG2 in tumor and normal tissues in the GSE77984 datasets in the Gene Expression Omnibus (GEO) database.*p < 0.05, **p < 0.01, ***p < 0.001Table 2Logistic analysis of the association between NCAPG2 expression and clinical characteristicsCharacteristicsTotal (N)OR (95% CI)P valuePathologic T stage (T1&T2 vs. T3&T4)355.231 (0.521–52.549)0.160Pathologic N stage (N0 vs. N1)300.722 (0.102–5.095)0.744Pathologic M stage (M0 vs. M1)325.000 (0.492–50.830)0.174Pathologic stage (Stage I&Stage II vs. Stage III&Stage IV)352.083 (0.412–10.529)0.375CA19-9 level (Abnormal vs. Normal)291.600 (0.362–7.073)0.535Gender (Male vs. Female)350.566 (0.148–2.168)0.406BMI (> 25 vs. ≤25)342.100 (0.467–9.440)0.333Age (> 65 vs. ≤ 65)350.347 (0.088–1.371)0.131Weight (> 70 vs. ≤ 70)351.091 (0.270–4.408)0.903Height (> = 170 vs. < 170)340.385 (0.093–1.596)0.188Histologic grade (G1&G2 vs. G3&G4)350.210 (0.050–0.879)0.033Child–Pugh grade (B vs. A)200.800 (0.043–14.886)0.881Perineural invasion (Yes vs. No)320.314 (0.051–1.940)0.213Vascular invasion (Yes vs. No)334.615 (0.456–46.671)0.195
Diagnostic value of NCAPG2 expression in CHOL
We created a receiver operating characteristic (ROC) curve using NCAPG2 gene expression data sourced from TCGA database and assessed its diagnostic value in CHOL. The area under the ROC curve (AUC) was calculated to be 0.994, indicating a strong diagnostic capability, as shown in Fig. 3A. Additionally, subgroup analyses demonstrated that higher levels of NCAPG2 expression were significantly linked to improved diagnostic accuracy in CHOL across various parameters. Specifically, for the T stages (T1, T2, T3, and T4), the AUC was 0.700; for the N stages (N0 and N1), it was 0.648; for the pathological M stage, the AUC was 0.622; for vascular invasion, it was 0.757; for perineural invasion, it was 0.594; for pathological stages III and IV as well as I and II, the AUC was 0.579; for the presence of residual tumors, it was 0.704; and for histological grade, it was 0.707. These results are illustrated in Fig. 3B through 3I.Fig. 3. Diagnostic value of NCAPG2 expression in CHOL. A Receiver operating characteristic (ROC) curve analysis for NCAPG2 expression in CHOL and adjacent tissue. B–I Subgroup analysis for Pathologic stage T3&T4 and T1&T2 (B), Pathologic stage N1 and N0 (C), Pathologic stage M1 and M0 (D), Vascular invasion (E), Perineural invasion (F), Pathologic stage III&IV and I&II (G), residual tumor (H) and Histological grade (I)
Functional enrichment and analyses of NCAPG2-related genes in CHOL
In order to investigate the biological role of NCAPG2 in CHOL, we utilized the LinkFinder module available on the LinkedOmics platform to analyze the co-expression patterns of NCAPG2 within the TCGA database specific to CHOL. Our analysis revealed the top 15 genes that exhibited a positive correlation with NCAPG2, alongside the bottom 15 genes that displayed a negative correlation (illustrated in Fig. 4A). To further elucidate the functional implications of these NCAPG2-associated genes (top 600), we employed the DAVID Functional Annotation Bioinformatics Microarray Analysis tool to assess the enriched GO categories and the pathways derived from the KEGG. The findings revealed a notable enrichment in biological processes, including chromosome segregation, nuclear division, and organelle fission, associated with these genes (as shown in Fig. 4B and detailed in Table 3).To pinpoint genes exhibiting a concordant regulatory direction in patients with high NCAPG2 expression and poor survival outcomes, we intersected the 2578 genes (with an absolute value of correlation coefficient ≥ 0.4) that were most closely correlated with NCAPG2 and the 286 upregulated genes associated with survival (p Cox < 0.05) in CHOL. This analysis yielded 33 genes which are linked to NCAPG2 and survival in CHOL (depicted in Fig. 4C). These genes have the potential to serve as genetic biomarkers for patients diagnosed with CHOL. Subsequently, we conducted GO and KEGG analyses on these 33 genes, revealing that the genes were obviously enriched in ATP-dependent activities, particularly those acting on DNA, as well as in DNA helicase activity (illustrated in Fig. 4D and summarized in Table 4). Additionally, we performed analyses to investigate the interactions between proteins and their correlations, aiming to elucidate the relationships among these 33 proteins. Our findings revealed a significant enrichment network that includes these proteins (as shown in Fig. 4E). The analysis of gene co-expression correlations indicated that the majority of proteins within this network exhibited a strong positive relationship with one another, as illustrated in Fig. 4F. Therefore, it is evident that the genes linked to NCAPG2 show a considerable level of interconnectivity and could potentially function as multigene biomarkers for predicting survival outcomes in patients diagnosed with CHOL.Fig. 4NCAPG2 functional clustering and interaction network analysis of NCAPG2-related genes. A Heatmap showed the positively top 30 genes with red and negatively top 30 genes with blue which related to NCAPG2. B GO and KEGG analyses of genes related to NCAPG2 in CHOL. C Venn diagram of upregulated genes related to NCAPG2 and survival in CHOL. D GO and KEGG analyses of genes related to NCAPG2 and survival in CHOL. E Interaction network of genes related to NCAPG2. F Gene co-expression matrixTable 3Gene sets enriched in the NCAPG2-related genes (top 600)OntologyIDDescriptionGeneRatioBgRatioP valuep.adjustBPGO:0007059Chromosome segregation76/555348/188002.85e−441.09e−40BPGO:0000280Nuclear division83/555446/188001.1e−422.1e−39BPGO:0048285Organelle fission85/555493/188004.99e−416.36e−38BPGO:0098813Nuclear chromosome segregation66/555287/188005.96e−405.7e−37BPGO:0000070Mitotic sister chromatid segregation51/555171/188004.56e−373.49e−34CCGO:0098687Chromosomal region79/579366/195941.65e−458.2e−43CCGO:0000775Chromosome, centromeric region60/579227/195944.81e−401.2e−37CCGO:0000793Condensed chromosome60/579255/195946.86e−371.14e−34CCGO:0000779Condensed chromosome, centromeric region45/579156/195944.74e−325.89e−30CCGO:0000776Kinetochore42/579146/195946.31e−306.27e−28MFGO:0003697Single-stranded DNA binding24/558120/184101.6e−139.37e−11MFGO:0140097Catalytic activity, acting on DNA31/558222/184101.25e−123.66e−10MFGO:0016887ATP hydrolysis activity37/558325/184104.6e−128.98e−10MFGO:0008017Microtubule binding30/558272/184101.09e−091.4e−07MFGO:0015631Tubulin binding36/558376/184101.19e−091.4e−07KEGGhsa04110Cell cycle37/252126/81648.81e−272.27e−24KEGGhsa03460Fanconi anemia pathway17/25254/81642.08e−132.69e−11KEGGhsa03440Homologous recombination13/25241/81641.38e−101.19e−08KEGGhsa04114Oocyte meiosis21/252131/81644.19e−102.7e−08KEGGhsa03013Nucleocytoplasmic transport16/252108/81641.69e−078.75e−06BP biological process, Bg background, CC cellular component, ES enrichment score, KEGG Kyoto Encyclopedia of Genes and Genomes, MF molecular function; Gene sets with NOM p-value < 0.05 were considered as significantly enrichedTable 4Gene sets enriched in the 33 genes at the intersection that were related to NCAPG2 and CHOL survivalOntologyIDDescriptionGene ratioBgRatioP valuep.adjustMFGO:0051880G-quadruplex DNA binding2/3110/184100.00010.0156MFGO:0003678DNA helicase activity3/3172/184100.00020.0156MFGO:0017116single-stranded DNA helicase activity2/3123/184100.00070.0223MFGO:0008094ATP-dependent activity, acting on DNA3/31103/184100.00070.0223MFGO:0042162telomeric DNA binding2/3137/184100.00180.0462MF molecular function, ES enrichment score. Gene sets with NOM p-value < 0.05 were considered as significantly enriched
Correlation between NCAPG2 expression and immune characteristics
We analyzed immune infiltration in CHOL using the TCGA database, focusing on how varying levels of NCAPG2 expression impacted this response. Our findings indicated that the expression of NCAPG2 is positively correlated with the presence of Th2 cells and T helper cells (Fig. 5A). A deeper examination of the relationship between NCAPG2 expression and immune cell infiltration in CHOL showed that higher NCAPG2 levels were positively associated with the infiltration of Th2 cells (r = 0.428, p = 0.011; Fig. 5B) and T helper cells (r = 0.398, p = 0.019; Fig. 5C). Additionally, to explore the link between NCAPG2 methylation and immune cell chemokines along with their respective receptors in CHOL, we utilized the TISIDB database. The resulting heat map demonstrated a correlation between NCAPG2 methylation levels and the presence of various chemokines and their receptors in CHOL (Fig. 6A, B). These results showed that NCAPG2 methylation may significantly influence tumor immunity. Then we further analyzed its relationship with chemokines and chemokine receptors, revealing a positive correlation between NCAPG2 methylation and the expression levels of CCL8 (r = 0.361, p = 0.031), CXCL16 (r = 0.362, p = 0.0306), and CCR10 (r = 0.361, p = 0.031; Fig. 6C–E). This indicates a positive relationship between NCAPG2 methylation and the expression of chemokines and their receptors in CHOL. Immune checkpoint inhibitors have emerged as a revolutionary approach in tumor immunotherapy, progressively improving the prognosis for patients with various cancer types. Therefore, we assessed the correlation between NCAPG2 methylation and the expression of immunoinhibitors and immunostimulators across different human cancers (Fig. 7A, B). Notably, NCAPG2 methylation showed a positive correlation with TNFSF4 (r = 0.347, p = 0.0386; Fig. 7C).Therefore, NCAPG2 may linked to regulate tumor immunity.Fig. 5. The relationship between NCAPG2 expression and immune infiltration in cancer. A Relative trend of 24 immune cells and NCAPG. B, C Th2 cell and T helper cell infiltration level related to NCAPG2Fig. 6Relationship between NCAPG2 methylation and chemokines or their receptors. A Heatmap between NCAPG2 methylation and chemokines in cancers. B Heatmap between NCAPG2 methylation and chemokine receptors in cancers. (C–E) CCL8, CXCL16, CCR10 have a positive correlation with NCAPG2 methylation in CHOLFig. 7Relationship between NCAPG2 methylation and immunoinhibitors or immunostimulators. A Heatmap between NCAPG2 and immunoinhibitors in cancers. B Heatmap between NCAPG2 and and immunostimulators in cancers. C TNFSF14 has a positive correlation with NCAPG2 methylation in CHOL
Discussion
Cholangiocarcinoma is highly aggressive and heterogeneous resulting in poor prognosis [1, 2]. Pathologic features for prognosis included vascular invasion, tumor multiplicity, local extension, periductal infiltration and lymph nodal metastasis [20]. The diagnosis and prognosis of CHOL has not improved in the past decade. The development of CHOL is insidious [21]. Surgery remains the cornerstone of CHOL treatment [3, 22, 23]. For surgeons, early diagnostic markers are more needed. NCAPG2, a subunit of the chromosomal condensin II complex, is increasingly recognized for its role in tumor evolution [7–10]. Currently, there is very little research on NCAPG2 in CHOL. We utilized various bioinformatics methods to study the expression of NCAPG2 in CHOL and its potential regulatory network. According to this research, we assessed the expression levels of NCAPG2 across different types of cancer and then confirmed its elevated expression specifically in CHOL. Its high expression is related to the occurrence and pathological histological classification of CHOL, as well as vascular/nerve invasion, and has crucial value for the accurate diagnosis and pathological staging of CHOL. NCAPG2 can treat as an early diagnostic biomarker for CHOL, and its pathological diagnostic value can assist surgeons in better designing surgical plans before the operation. However, elevated NCAPG2 expression in cholangiocarcinoma diagnosis does not definitively exclude other malignancies, necessitating careful clinical consideration by surgeons.
To clarify the potential molecular mechanisms whereby NCAPG2 affects the prognosis of CHOL, this study identified a total of 33 genes within the NCAPG2 gene network, which we designated as our primary focus. This includes a total of 286 genes that have a significant association with the prognosis of CHOL, along with 2,578 genes that show the strongest correlation with NCAPG2. We then performed a thorough analysis of the biological processes and signaling pathways linked to the key genes by utilizing GO functional enrichment and KEGG pathway analysis. The enrichment findings suggest that the majority of key genes are linked to biological processes including such as ATP-dependent activity and DNA helicase activity, which are essential for cellular processes such as DNA replication and repair. The Fanconi anemia pathway and homologous recombination, which is crucial for DNA repair and maintaining genomic stability, was also significantly associated with NCAPG2. This finding aligns with previous studies that have highlighted the importance of DNA repair mechanisms in cancer biology, where dysregulation can lead to genomic instability and tumorigenesis [24, 25]. Additionally, the pathways related to chromosome segregation and nuclear division are particularly relevant in the context of cancer biology [26–28]. Aberrant chromosome segregation can result in aneuploidy, contributing to tumor heterogeneity and resistance to therapy [26, 27]. The significant enrichment of NCAPG2-associated genes in these pathways suggests that NCAPG2 may play a critical role in ensuring proper mitotic processes, thereby influencing the overall survival and proliferation of CHOL cells. Further studies are warranted to elucidate the mechanisms underlying NCAPG2's role in CHOL.
Numerous studies have shown a significant link between cancer progression and the tumor microenvironment, which consists of immune cells, extracellular matrices, and inflammatory mediators. These components work together to promote tumor cell growth, survival, and spread [29, 30]. While a strong immune response can help fight tumors, cancer cells have developed ways to escape immune detection, such as impairing antigen presentation and attracting immunosuppressive cells. Previous research has indicated that the extent of immune cell infiltration in tumors can affect patient outcomes, with tumor-infiltrating lymphocytes being an independent prognostic factor for cancer patients [31, 32]. The current research showed the relationship between NCAPG2 expression and immune infiltration levels in CHOL.The findings indicated that the expression of NCAPG2 is positively correlated with Th2 cells and T helper cells. This aligns with previous studies that have highlighted the role of Th2 cells in promoting tumor progression through the secretion of cytokines that can enhance tumor growth and metastasis [33]. These results show that NCAPG2 may regulate the tumor immune microenvironment as well as in the advancement of CHOL.
Chemokines and their corresponding receptors are crucial in guiding the directional movement of immune cells. Chemokines play a crucial role in directing immune cell migration, and their dysregulation is often associated with poor prognosis in cancer [34, 35]. This research explored how the methylation status of NCAPG2 in CHOL correlates with the expression levels of chemokines and their receptors linked to immune cells, using data sourced from the TISIDB database. The findings revealed that the methylation status of NCAPG2 is positively correlated with the expression levels of CCL8, CXCL16, and CCR10. This suggests that NCAPG2 methylation might hinder the migration of immune cells into tumor microenvironment. Immune checkpoint blockade is an immunotherapy that has been applied in multiple tumors. TNFSF4 was explored to be closely related to breast carcinoma [36]. The positive correlation of NCAPG2 methylation with TNFSF4, an immunostimulatory molecule, further suggests that NCAPG2 may enhance the immune response against tumors, potentially serving as a therapeutic target for immune checkpoint inhibitors. This could elucidate the process through which NCAPG2 governs immune infiltration in CHOL.
In summary, we found that NCAPG2 is upregulated in CHOL and has significant value for early diagnosis and pathological classification, which can assist in surgical decision-making. At the same time, NCAPG2 can influence the progression of CHOL through immune infiltration.
Limitation
This study still has limitations include the absence of functional validation, restricted cohort size and insufficient mechanistic explanation, which may introduce potential overestimation of clinical significance. These constraints highlight the need for multicenter validation and mechanistic investigations in future research. The next phase will include both in vivo and in vitro studies designed to clarify the role of NCAPG2 in CHOL, in order to enhance the reliability of the current research. Our research center will initiate the collection of cholangiocarcinoma specimens from recent years, with plans to conduct immunohistochemical analyses when resources permit. Our results indicate that NCAPG2 has strong diagnostic value for CHOL. But the observed AUC range indeed falls below the threshold for standalone clinical utility. Subsequent experiments will validate this through solid specimens and related tests of NCAPG2 in peripheral blood.