Antibiotic resistance, virulence gene, phylogenetic group and genetic diversity of Escherichia coli isolated from Tibetan pig farms in Garze Tibetan Autonomous Prefecture, Sichuan, China
Xing Zhao, Jun Liang, Zhaobin Xia, Chaoxi Chen

TL;DR
This study examines antibiotic resistance, virulence, and genetic diversity of E. coli from Tibetan pig farms in China to help control infections and reduce antibiotic overuse.
Contribution
The study provides new insights into the correlation between antibiotic resistance and pathogenicity in E. coli from Tibetan pig farms.
Findings
84.43% of E. coli isolates showed multidrug resistance, with high resistance to chloramphenicol, sulfadiazine, and sulfamethoxazole.
EAEC 5-12, a multidrug-resistant strain, exhibited strong biofilm formation and carried numerous virulence genes.
Most E. coli strains belonged to phylogenetic group A, and 64 isolates were identified as diarrheagenic E. coli, primarily EAEC.
Abstract
To investigate the correlations among antibiotic resistance, virulence gene, phylogenetic group, and genetic diversity, providing essential data for Escherichia coli (E. coli) infection prevention and control in Tibetan pigs. A total of 244 E. coli isolates were collected. Antimicrobial susceptibility was assessed using the microdilution method. PCR was used to detect antibiotic resistance genes (ARGs), virulence genes, and phylogenetic groups. Genetic diversity was analyzed using enterobacterial repetitive element sequence-based PCR. Enteroaggregative E. coli (EAEC) 5-12, a representative strain with multidrug resistance and strong biofilm-forming ability, harboring abundant virulence genes, was selected for whole-genome sequencing (WGS) to validate PCR results. Among the 244 isolates, 84.43% showed multidrug resistance (MDR), with the highest resistance rates for chloramphenicol…
Genes, proteins, chemicals, diseases, species, mutations and cell lines named across the full text — each resolved to its canonical identifier and authoritative record.
Click any figure to enlarge with its caption.
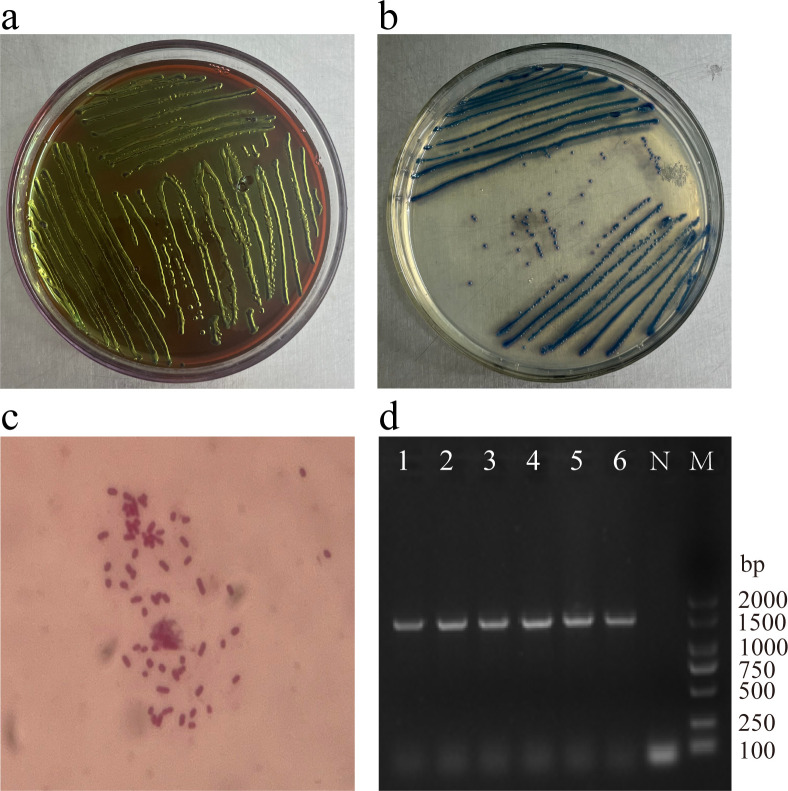 Figure 1
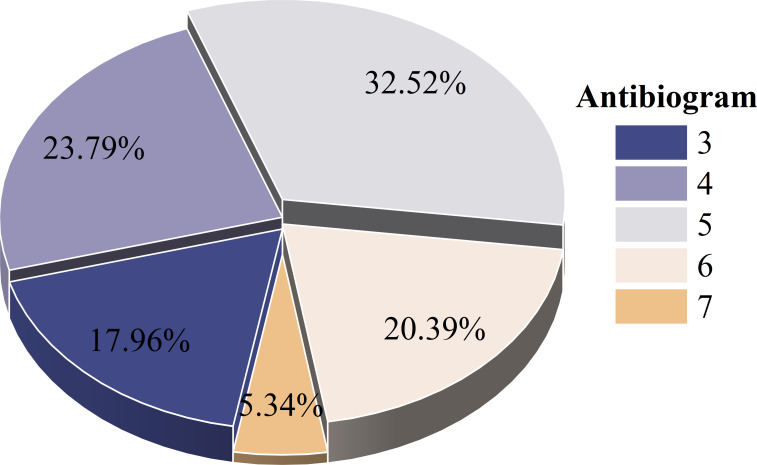 Figure 2
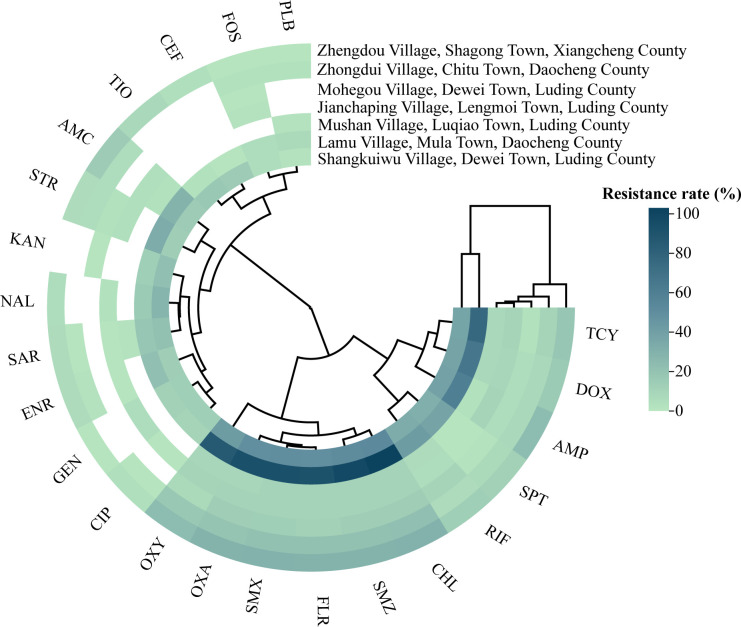 Figure 3
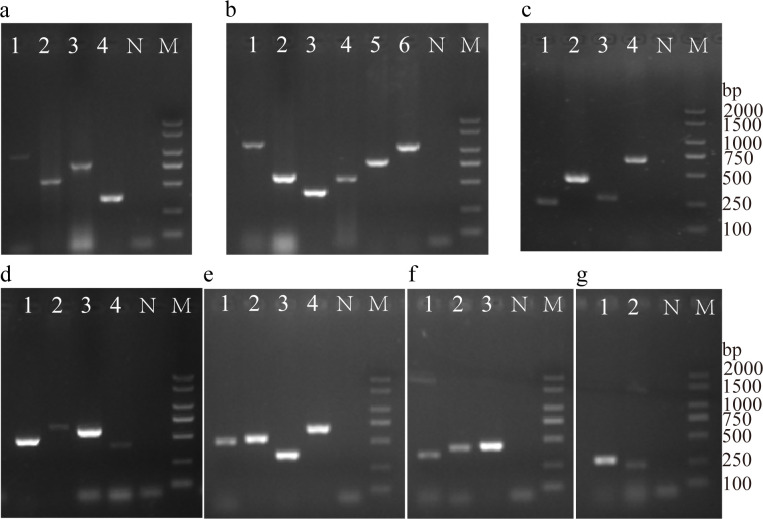 Figure 4
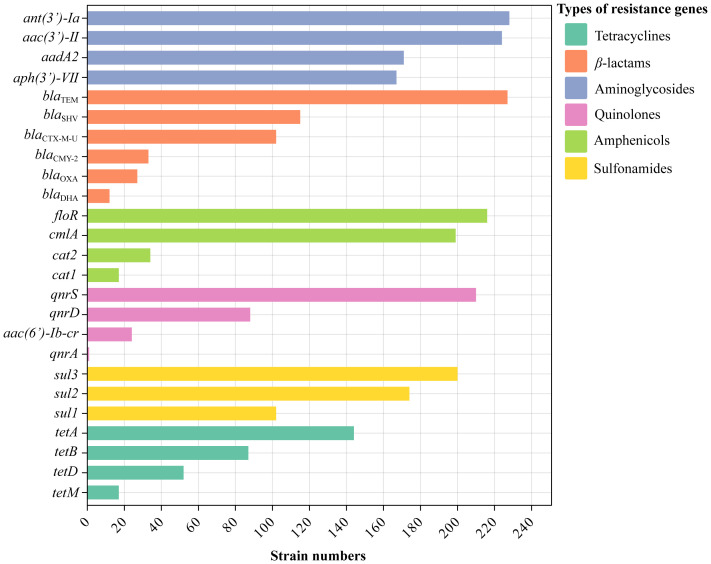 Figure 5
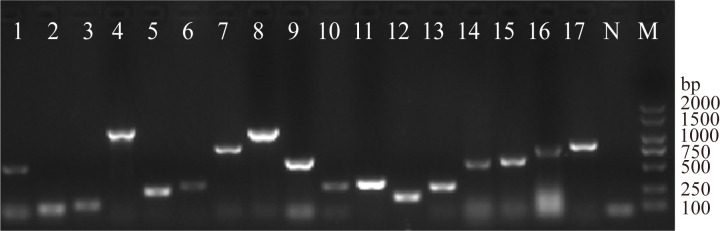 Figure 6
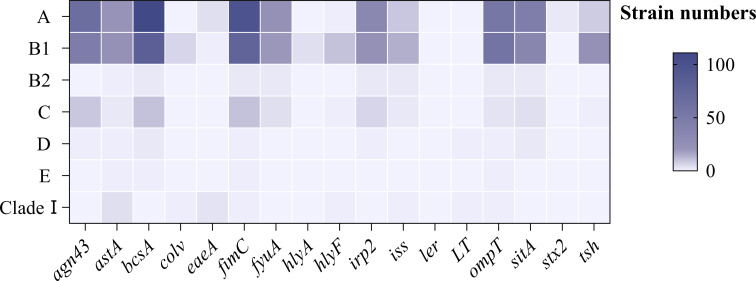 Figure 7
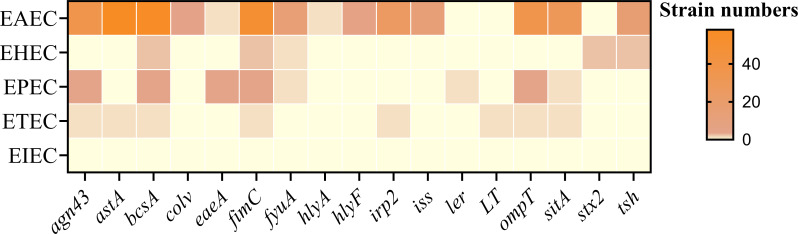 Figure 8
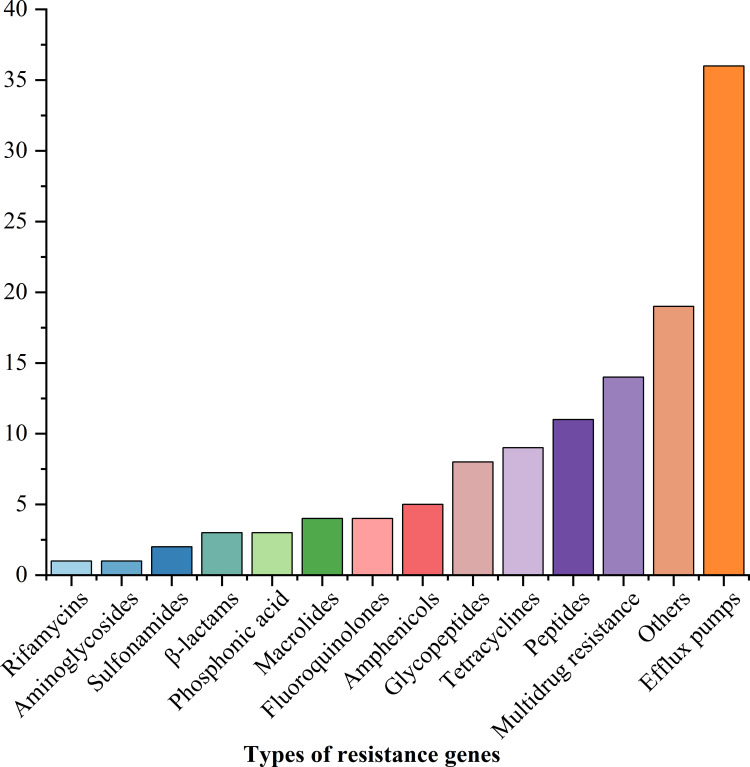 Figure 9
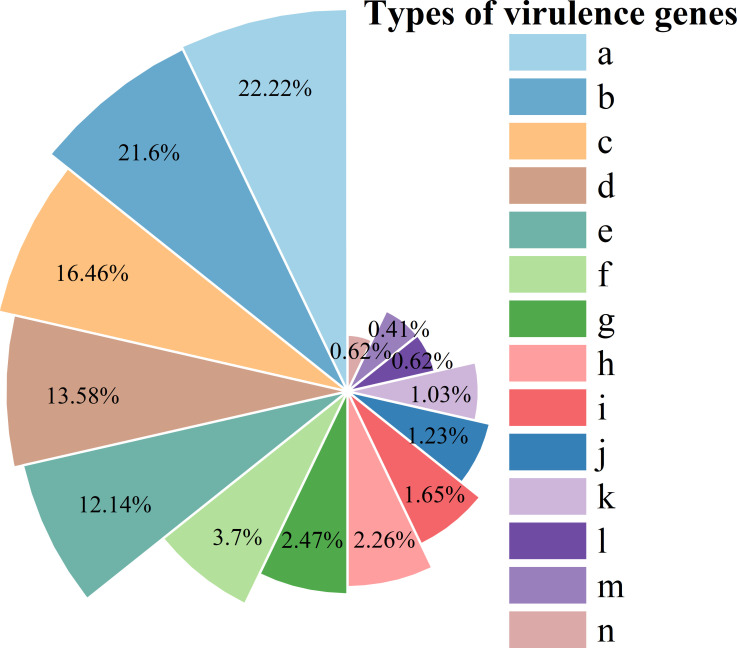 Figure 10
| Antibiotic classes | Names of antibiotics | R (%) | I (%) | S (%) | MIC50 | MIC90 | MIC range |
|---|---|---|---|---|---|---|---|
| Tetracyclines | OTC | 69.67 | 10.25 | 20.08 | 64 | 256 | 0.5 - 256 |
| DOX | 51.64 | 9.84 | 38.52 | 8 | 32 | 0.25 - 128 | |
| TCY | 64.34 | 2.05 | 33.61 | 64 | 256 | 0.25 - 256 | |
| Sulfonamides | SMZ | 96.31 | 0.00 | 3.69 | 512 | 512 | 32 - 512 |
| SMX | 93.85 | 0.00 | 6.15 | 512 | 512 | 8 - 512 | |
|
| AMP | 59.84 | 1.23 | 38.93 | 256 | 256 | 2 - 256 |
| OXA | 62.70 | 29.10 | 8.20 | 32 | 256 | 2 - 256 | |
| AMC | 6.56 | 22.54 | 70.90 | 8 | 16 | 0.5 - 64 | |
| TIO | 10.25 | 1.23 | 88.52 | 0.25 | 8 | 0.25 - 256 | |
| CEF | 7.38 | 0.82 | 91.80 | 0.25 | 1 | 0.25 - 256 | |
| Amphenicols | FLR | 79.10 | 13.11 | 7.79 | 32 | 256 | 0.5 - 256 |
| CHL | 99.59 | 0.00 | 0.41 | 256 | 256 | 2 - 256 | |
| Rifamycins | RIF | 8.61 | 38.52 | 52.87 | 4 | 8 | 1 - 64 |
| Aminoglycosides | STR | 26.64 | 0.00 | 73.36 | 16 | 256 | 0.5 - 256 |
| GEN | 12.30 | 0.41 | 87.30 | 0.5 | 16 | 0.25 - 256 | |
| SPT | 24.59 | 13.11 | 62.30 | 32 | 256 | 1 - 256 | |
| KAM | 14.75 | 0.00 | 85.25 | 4 | 256 | 0.5 - 256 | |
| Fluoroquinolones | NAC | 21.31 | 0.00 | 78.69 | 4 | 256 | 0.25 - 256 |
| CIP | 10.25 | 1.64 | 88.11 | 0.25 | 1 | 0.25 - 16 | |
| ENR | 14.75 | 3.69 | 81.56 | 0.25 | 8 | 0.25 - 128 | |
| SAR | 8.61 | 11.48 | 79.92 | 0.25 | 1 | 0.25 - 16 | |
| Polypeptides | PLB | 6.15 | 0.00 | 93.85 | 1 | 2 | 0.25 - 256 |
| Polyphosphates | FOS | 2.87 | 4.10 | 93.03 | 4 | 64 | 0.25 - 256 |
| Clusters | Biofilm-forming ability | |||
|---|---|---|---|---|
| Strong | Moderate | Weak | Absent | |
| I | 0 | 0 | 3 | 1 |
| II | 3 | 14 | 28 | 8 |
| III | 0 | 0 | 2 | 0 |
| IV | 0 | 0 | 4 | 0 |
| V | 0 | 0 | 1 | 0 |
| 3 (4.69%) | 14 (21.88%) | 38 (59.38%) | 9 (14.06%) | |
Peer Reviews
No public reviews on file for this paper yet. If you reviewed it on a platform where reviews are public (OpenReview, ICLR, NeurIPS, ICML), you can paste yours below so the community can read it here.
Videos
No videos yet. Explain this paper in a talk, walkthrough, or lecture? Add one.
Taxonomy
TopicsAntibiotic Resistance in Bacteria · Escherichia coli research studies · Pharmaceutical and Antibiotic Environmental Impacts
Introduction
1
Escherichia coli (E. coli), a facultative anaerobe, is widely present in the gastrointestinal tracts of warm-blooded animals. When the immune response of the host is impaired, certain serotypes of E. coli can invade deeper tissues or organs, causing diseases such as diarrhea, pneumonia, and septicemia to acquire antibiotic resistance genes (ARGs) and virulence genes, adapt to environmental changes, and lead to gut microbiota disturbance (Geurtsen et al., 2022). Nearly 70% of antibiotics globally are used in animal production, with this widespread usage contributing significantly to bacterial resistance in pathogens like E. coli due to selective pressure and environment acquisition of resistance genes (Gasparrini et al., 2020; McKernan et al., 2021). China is the largest producer and user of antibiotics, with a large share applied in animal production and agriculture (Zhang et al., 2015). In 2023, E. coli isolated from Tibetan pigs in Nyingchi, Tibet, China, demonstrated resistance to multiple antibiotics (Cao et al., 2023). Similar resistance was observed in E. coli isolated from pigs, yak, beef and dairy cattle, reducing the efficacy of diminished the efficacy of β-lactams, quinolones, and aminoglycosides (Kylla et al., 2020; Wang et al., 2021).
Bacteria acquire resistance genes is a significant mechanism for the spread of resistance among bacteria. Integrons, a mobile genetic element, capture and integrate foreign genes, particularly resistance genes, through integrase enzymes (Hall and Collis, 1995).
E. coli acquires specific virulence factors through horizontal gene transfer and adaptive evolution, which enhances its adaptability and enables it to infect the host (Kaper et al., 2004; Arnold et al., 2022). Its pathogenicity is linked to virulence factors, typically encoded by genes on chromosomes, plasmids, or other genetic elements. Previous studies have shown that these factors are linked to gastrointestinal diseases (Singh et al., 2019).
E. coli is classified into phylogenetic groups based on the presence/absence of genes like chuA, yjaA, TspE4.C2, arpA, and trpA. Experimental results show differences in pathogenicity, phenotype, and genotype among strains from different phylogenetic groups (Tenaillon et al., 2010). Compared to other phylogenetic groups, E. coli in group B2 exhibits a longer survival time in the host’s intestine, which is suspected to be related to the virulence genes carried (Johnson and Kuskowski, 2000; Johnson and Stell, 2000; Escobar-Páramo et al., 2004). Potential pathogenic strains were also found in group D, while strains in groups A and B are mostly commensal E. coli (Picard et al., 1999; Duriez et al., 2001).
Tibetan pigs, physiologically adapted to high altitudes, are food animals vulnerable to outbreaks of fatal diarrhea caused by pathogenic E. coli, raising serious concerns for both animal and human health. Understanding the virulence genes, phylogroups, and phenotypic resistance characteristics in E. coli strains in Tibetan pigs is essential.
The linkages between virulence determinants and antibiotic resistance are still not clear despite several studies. It is important to assess the risk of antibiotic resistance and virulence factors on public health and this necessitates additional studies on such neglected food animals. This study aimed to investigate antibiotic resistance, virulence genes, and phylogenetic group distribution of E. coli isolated from Tibetan pig farms in Garze Tibetan Autonomous Prefecture, Sichuan, China. Findings provide foundational data on the relationship between antibiotic resistance and pathogenicity in E. coli from Tibetan pigs, supporting the rational use of antimicrobials and helping curb the spread of bacterial resistance in the Tibetan pig industry.
Materials and methods
2
Samples collection and reference strain
2.1
From 19 June to 6 October 2022, 301 samples (247 feces, 41 soil, and 23 water) were aseptically collected from Tibetan pigs in Garze Tibetan Autonomous Prefecture, Sichuan Province (Supplementary Table S1). Seven farms were sampled (Luding, 4 farms; Xiangcheng, 1 farm; and Daocheng, 4 farms) and samples were transported to Southwest Minzu University in ice-cooled containers for E. coli isolation and identification within 72 h. Anal swabs from normal animals, surface soil, and drain water were collected from intensive farms using sterile plastic bags. The reference strain ATCC25922 was kept in the Laboratory of Veterinary Pharmacology and Toxicology of Southwest Minzu University.
Antibacterial agents, medium and molecular biology reagents
2.2
Twenty-three antibacterial agents including Tetracyclines (Doxycycline, Oxytetracycline, Tetracycline), Sulfonamides (Sulfamethoxazole, Sulfadiazine), β-lactams (Amoxicillin/clavulanic acid, Ampicillin, Cefoxitin, Cefquinome, Oxacillin), Amphenicols (Chloramphenicol, Florfenicol), Rifamycins (Rifampin), Aminoglycosides (Gentamicin, Kanamycin, Spectinomycin, Streptomycin), Fluoroquinolones (Ciprofloxacin, Enrofloxacin, Nalidixic acid, Sarafloxacin), Polypeptides (Polymyxin B), Polyphosphates (Fosfomycin) were purchased from Shanghai YuanYe Biotechnology Co., Ltd. Tryptone soy broth (TSB), MacConkey agar (MAC), E. coli coliform chromogenic agar, Eosin methylene blue agar (EMB), Mueller-Hinton broth (MH), and Gram staining kits were provided by Qingdao Haibo Biotechnology Co., Ltd. molecular biology reagents for PCR including DL2000 DNA marker and 2×Taq Master Mix were purchased from Vazyme Biotech Co., Ltd (Nanjing, China).
Isolation, identification, and DNA extraction of E. coli
2.3
A suitable volume of environmental samples (0.2 g feces, 0.5 g soil, and 5 mL water) was placed into a test tube containing 5 mL of TSB and incubated for 12 h at 37°C. A loop of the bacterial suspension was streaked on MAC agar and incubated at 37°C for 12 h. Single colonies of moderate size with pink color were sequentially inoculated to EMB, E. coli/coliform color indicator medium, and MAC. The purified single colonies were subjected to the suspected E. coli via Gram staining and microscopic examination. PCR reaction targeting the β-glucosidase gene uidA (uidA-F: ATGCCAGTCCAGCGTTTTTGC and uidA-R: AAAGTGTGGGTCAATAATCAGGAAGTG) was amplified and the PCR products were subjected to the NCBI BLAST platform for sequence analysis.
DNA was extracted using the nuclease-free water boiling method and used as the DNA template in all the following molecular biological tests.
Antimicrobial sensitivity testing
2.4
The broth microdilution method used for the antimicrobial sensitivity profile and the obtained MICs (minimum inhibitory concentration) were interpreted according to the Clinical and Laboratory Standards Institute (CLSI) guidelines (CLSI, 2013). The reference strain ATCC25922 was used as a quality control. Briefly, dispense 100 µL of MH medium into each well in the columns from 1 to 12 and 100 µL in column 1 using a 300 µL electronic multichannel pipette (Eppendorf, Germany). Then, 100 µL of appropriate 4-fold concentrated stock solutions (5012 μg/mL) was pipetted into the wells in column 1 (antibiotic concentration will be diluted this way 1:1) and mixed, 100 µL of the mixed solutions in column 1 was withdrawn and moved into the column 2. Repeat the dilution procedure up to column 10 and additionally discard 100 µl of solutions from this last column. 100 µL of the suspension (10^6^ CFU/mL) were inoculated in columns 1 to 10, columns 11 and 12 having a positive (no antibiotic) and negative growth control for medium sterility. Finally, transfer microtiter plates into the closable tray until inoculation is 12–16 h. Multi-drug resistance (MDR) was determined according to the reference (Magiorakos et al., 2021).
Detection of ARGs, integrase genes, and virulence genes
2.5
Specific primers for antibacterial resistance, integrase, and virulence genes were designed according to the literature (Supplementary Table 2) and synthesized by Sangon Biotech (Shanghai) Co., Ltd. Primers for the detection of ARGs and integrase genes were chosen based on the antibiotic categorizations. Virulence genes were chosen based on their functional characteristics. Singleplex PCR amplification reactions were carried out in 25 µL volumes comprising 2 µL genomic DNA, 12.5 µL 2×Taq Master Mix, 1 µL of each primer, and 8.5 µL ddH_2_O. The thermocycler conditions were as follows: denaturation at 95°C for 5 min followed by 35 cycles of denaturation at 95 °C for 30 s, variable annealing for 30 s, and extension at 72 °C for 15 s (Supplementary Tables S2 and S3). Finally, a final extension for 10 min at 72°C. The PCR products were analyzed using by 1% agarose gel electrophoresis staining with ethidium bromide. Concordance rates between drug-resistance phenotypes and genotypes were calculated, and the consistency rates of ARGs and integrase genes were assessed (An, 2024). Chi-Plot was used to investigate the possible association of two variables (https://www.chiplot.online/).
Phylogenetic analysis
2.6
Phylogenetic analysis of the isolated E. coli using a set of genes chuA, yjaA, TspE4.C2, arpA, arpAgpE, trpAgpC, trpBA were detected by multiplex PCR assays and the results were interpreted as previously described (Olivier et al., 2013). Primer information is listed in Supplementary Table S4. Quadruplex genotypes and steps for assigning E. coli isolates to phylogroups are listed in Supplementary Table S5.
Determination, genetic diversity, and biofilm formation of diarrheagenic E. coli (DEC)
2.7
DEC was determined according to the National Food Safety Standard GB/T 4789.6-2016 (National Health and Family Planning Commission of the People’s Republic of China, 2016). The criteria for diarrheagenic E. coli genetic typing are listed in Supplementary Table S6. ERIC-PCR typing was conducted to assess the genetic diversity of DEC by amplifying repetitive DNA sequences found in the intergenic regions and the primers information was shown in Supplementary Table S4.
ERIC-PCR reactions were performed in 25 μL volumes containing 1 μL of each primer, 12.5 μL of the master mix (CinnaGen, Iran), 2 μL of DNA template, and 8.5 μL of deionized water. The ERIC-PCR reaction program was performed following initial denaturation at 95°C for 5 min, with the next 35 cycles consisting of a denaturation step at 95°C for 1 min, annealing at 53°C for 1 min, extension at 72°C for 4 min, and a final extension for 10 min at 72°C. 5 μL of ERIC-PCR products were loaded on 1% agarose gel and conducted at 120 V for 30 min. Meanwhile, a 100-base pair-DNA marker was used as a standard measuring means. DNA bands were visualized with a ChemiDoc MP Imaging System (BIO-RAD).
ERIC-PCR bands were used to construct a dendrogram by converting into a binary matrix where each band is either present (1) or absent (0) for each isolate. The dendrogram for the 64 strains was constructed in NTSYS software using the Unweighted Pair Group Method with the Arithmetic mean (UPGMA) method.
The biofilm-forming ability of DEC was semi-quantitative determined using crystal violet assay (Chen et al., 2021), and the optical density threshold value (OD_C_) was set as the average value of the negative control plus three standard deviations. The biofilm formation ability was categorized as follows: OD_570nm_ ≤ OD_C_ indicates no biofilm formation, OD_C_ < OD_570nm_ ≤ 2 OD_C_ indicates weak biofilm formation, 2 OD_C_ < OD_570nm_ ≤ 4OD_C_ indicates moderate biofilm formation, and D_570nm_ > 4 D_C_ indicates strong biofilm formation.
Whole genome sequencing of EAEC 5-12
2.8
To confirm the presence of resistance-related genes and allelic variations in EAEC 5-12(multidrug resistance and strong biofilm-forming ability, harboring abundant virulence genes), the amino acid sequence from WGS data was analyzed using CARD’s Resistance Gene Identifier (RGI) software. A single colony was selected for enrichment in a 5 mL aliquot of TSB, and bacterial culture at the logarithmic phase was centrifuged at 4000 g for 10 min at 4°C. The supernatant was discarded, and the pellet was washed twice with sterile water. Samples were shipped with dry ice for Illumina sequencing (Beijing Novogene Bioinformatics Technology Co., Ltd). After sequencing and gene function prediction, the antimicrobial resistance genes were verified against the NCBI AMRFinderPlus database. For virulence genes, DIAMOND software was used to compare the non-redundant gene set with the VFDB core database, applying a cut-off of 80% identity and 70% coverage (parameters: BLASTP; E-value ≤ 1e-5).
Statistics and data analysis
2.9
Statistical analysis was performed using WHONET 5.6 and IBM SPSS Statistics 29. The chi-squared test and Fisher’s exact test were used to analyze differences, with P< 0.05 considered statistically significant.
Results
3
Isolation and identification of E. coli
3.1
Species identification was conducted using a combination of morphological and molecular biological methods (Figures 1a-c). The E. coli marker gene uidA was detected in 81.06% (244/301) of strains, with a molecular weight of approximately 1487 bp (Figure 1d). Of these, 64 strains (26.23%, 64/244) were identified as DEC. Among the isolates, the percentage of E. coli isolated from feces, soil, and water was 72.09% (217/301), 2.33% (7/301), and 6.64% (20/301), respectively.
Identification of E. coli by combining morphological and molecular biological methods. (a) Colonies showing greenish metallic sheen on EMB agar; (b) Dark blue to violet colonies on E. coli coliform chromogenic agar; (c) E coli Colony Gram staining (1000×); (d) E. coli marker gene uidA (Lane 1-6: Representative strains. N, Negative control; M, DL 2000 DNA Marker).
Antimicrobial resistance and multi-drug resistance analysis
3.2
The antimicrobial sensitivity testing of 244 E. coli strains against 23 antibiotics is summarized in Table 1. The strains exhibited resistance to various antibiotics, including aminoglycosides, sulfonamides, and tetracyclines, with resistance rates exceeding 50%. The highest resistance rates were observed for CHL, SMZ, and SMX, posing 99.59%, 96.31%, and 93.85%, respectively. However, the isolated strains were sensitive to PLB (93.85%), CEF (91.8%), TIO (88.52%), CIP (88.11%), GEN (87.3%), KAM (85%). 84.43% (206/244) of the E. coli strains displayed MDR, with the highest proportion (32.52%, 67/206) being resistant to five classes of antibiotics (Figure 2).
Antibiogram of MDR E. coli. (3–7 means that resistance to 3–7 kinds of antibiotics was tested).
Among the seven sampling sites, strains from Shangkuiwu Village and Lamu Village exhibited higher resistance rates to aminoglycosides and sulfonamides, followed by tetracyclines and some β-lactams. Resistant strains of all 23 antibiotics were detected in these villages. The resistance profiles of the other five sites were similar (Figure 3). Regional differences in the detection rates of antimicrobial agents were observed, with statistical significance (P< 0.05) for agents such as Ciprofloxacin, Gentamicin, and Sarafloxacin (Supplementary Table S7).
Antibacterial resistance in seven different sampling sites.
Detection of ARGs, integrase genes, and virulence genes
3.3
Twenty-five ARGs were positively detected (Figures 4, 5). The predicted fragment length (bp) and optimized annealing temperature (°C) are listed in Supplementary Table S2. For ARGs, detection rates exceeded 80% for ant (3’)-Ia (93.44%, 228/244), bla TEM (93.03%, 227/244), aac (3’)-II (91.80%, 224/244), floR (88.52%, 216/244), qnrS (86.07%, 210/244), sul3 (81.97%, 200/244), and cmlA (81.56%, 199/244). Correlation analysis between ARGs and phenotypes indicated a significant positive association between strains carrying ARGs and those without (Supplementary Table S8).
Electrophoresis of PCR amplification products of antibacterial resistance genes and integrase genes. (a) Tetracyclines (1-4, tetA, tetB, tetD, tetM); (b) β-lactams (1-6, blaCMY-2, blaCTX-M-U, blaDHA, blaOXA, blaSHV, blaTEM); (c) Aminoglycosides (1-4, aac(3’)-II, aadA2, ant(3’)-Ia, aph(3’)-VII); (d) Quinolones (1-4, aac(6’)-Ib, qnrA, qnrD, qnrS).; (e) Amphenicols (1-4, cat1, cat2, cmlA, floR); (f) Sulfonamides (1-3, sul1, sul2, sul3); (g) Integrase (1-2, intl1, intl2). (N, Negative control; M, DL 2000 DNA Marker).
The number of strains with antibacterial resistance genes.
The detection rates of intl1 and intl2 were 90.16% (220/244), and 15.16% (37/244), respectively. 14.34% (35/244) of the strains carried both intl1 and intl2 genes, and 9.02% (22/244) did not carry the intl1 and intl2 genes. Correlation analysis between ARGs and integrase genes was evaluated and shown in Supplementary Table S9. Overall, the consistency rate of the integrase gene intl1 was higher than that of intl2, and the detection rate of ARGs in strains carrying integrase genes differed significantly from the strains not carrying integrase genes.
Among the 17 positively detected virulence genes (Figure 6), the highest detection rates for bcsA, fimC, and agn43 genes were 98.77% (241/244), 89.75% (219/244), 59.43% (145/244), respectively. However, none of the isolates were positive for afa, bcsB, exhA, papC, stx1 and vat. The 244 E. coli posed106 virulence genotypes, exhibited the highest number of 11 virulence genes (agn43, astA, bcsA, colV, eaeA, fimC, hlyF, iss, ompT, sitA, tsh) and the lowest number of 1 virulence gene (bcsA). The predominant virulence pattern was agn43/bcsA/fimC (17.92%, 19/106) summarized in Supplementary Table S10.
Electropherogram of the PCR amplification product of virulence genes. Lane 1, agn43; Lane 2, astA; Lane 3, bcsA; Lane 4, colV; Lane 5, eaeA; Lane 6, fimC; Lane 7, fyuA; Lane 8, hlyA; Lane 9, hlyF; Lane 10, irp2; Lane 11, iss; Lane 12, ler; Lane 13, LT; Lane 14, ompT; Lane 15, sitA; Lane 16, stx2; Lane 17, tsh; (N, Negative control; M, DL 2000 DNA Marker).
Phylogenetic analysis
3.4
Of the 244 strains, 45.90% (112/244) mainly belonged to group A, followed by group B1(34.43%), group B2(0.82%), group C (4.10%), group D (0.82%), group E (0.41%), and Clade I (1.64%). However, 29 strains could not be classified into any phylogenetic clusters (Supplementary Figure S1). Figure 7 revealed the distribution of virulence genes in 244 E. coli among the different phylogenetic groups, the most prevalent genes in group A were agn43, bcsA, eaeA, fimC, fyuA, irp2, sitA, and stx2, and those of B1 were higher in genes astA, colV, hlyA, hlyF, iss, ompT, and tsh. For ler and LT, the predominant groups were located in D and Clade I, respectively.
Distribution of virulence genes among phylogenetic groups.
A total of 64 strains were screened and identified as DEC, the most predominant pathotype belonged to enteroaggregative E. coli (EAEC), accounting for 90.63% (58/64). Followed by enteropathogenic E. coli (EPEC), enterohemorrhagic E. coli (EHEC), and enterotoxigenic E. coli (ETEC), accounting for 4.69% (3/64), 3.12% (2/64), 1.56% (1/64), respectively. No enteroinvasive E. coli (EIEC) were identified in this study. Our results also revealed that EAEC strains (EAEC5-12) harbored various virulence genes relating to biofilm formation with a higher detection rate of virulence genes (Figure 8).
Distribution of virulence genes in DEC.
Among the 64 DEC isolates, most isolates exhibited moderate or weak biofilm-forming ability. Namely, 4.69% (3/64), 21.88% (14/64), 59.38% (38/64), and 14.06% (9/64) were classed as strong, moderate, weak, and absent producers of biofilm.
ERIC patterns based on molecular weight and markers were observed. Isolates with one to three similar or different band patterns were grouped, while those with differences in more than three bands were classified into separate types. Based on 61.2% similarity among strains, dendrograms grouped the 64 DEC isolates into five clusters (I, II, III, IV, and V). Of these, 84.38% were in cluster II, where all strong biofilm-forming strains were located (Table 2, Supplementary Figure 2).
Whole-genome sequencing
3.5
The detected antibiotic resistance profiles for EAEC5–12 largely agreed with the MIC results. Based on the verification against the NCBI AMRFinderPlus database, a total of 120 ARGs were ultimately selected, including those for tetracyclines, aminoglycosides, fluoroquinolones, glycopeptides, and macrolides, 71.67% were involved in antibiotic efflux, 14.17% were involved in antibiotic target alteration, and 15.16% were involved in multiple resistance mechanisms simultaneously (Figure 9).
Predicted mechanisms of action for drug resistance genes.
Gene function annotations for EAEC 5–12 virulence genes showed 486 annotated virulence genes, including functions in adherence, antimicrobial activity/competitive advantage, biofilm formation, effector delivery systems, and others (Figure 10).
Classification of virulence genes. (a) adherence; (b) nutritional/metabolic factor; (c) immune modulation; (d) effector delivery system; (e) motility; (f) regulation; (g) antimicrobial activity/competitive advantage; (h) biofilm; (i) stress survival; (j) exotoxin; (k) others; (l) exoenzyme; (m) invasion; (n) post-translational modification.
Discussion
4
Bacterial resistance is a growing global issue, with MDR problems becoming increasingly severe. Economic and regulatory challenges contribute to the high prevalence of MDR bacteria in some developing countries. Given the limited research on antimicrobial resistance in Tibetan pigs, in this study, we observed a higher prevalence of multidrug-resistant E. coli with virulence factors in Tibetan pigs and the environmental samples (soil and drain water), providing a basis for comparison with reports from other regions and animal populations.
In this study, 84.43% of the 244 E. coli isolates from Tibetan were MDR and were resistant to 23 antibiotics with high resistance to sulfonamides, amphenicols, tetracyclines, and β-lactams, emphasizing the urgent need to improve drug management and avoid unnecessary antibiotic use in Tibetan pig farms. The result is aligned with a study in Bangladesh, where 98% of the tested strains were MDR (Jain et al., 2021) and another report indicates that resistance rates vary significantly by region and sample types (An, 2024).
Tibetan pig farming is a key economic sector in Garze Tibetan Autonomous Prefecture, Sichuan Province. According to the drug use information provided by the farmers, Ampicillin, Florfenicol, and Doxycycline are the most commonly used antibiotics in Tibetan pig farming due to their low cost and effectiveness. Data indicates that over 75% of tetracycline antibiotics or their metabolites enter the environment through waste, increasing selective pressure and promoting antibacterial resistance (Xu et al., 2021; Larsson and Flach, 2022). In early livestock practices, sulfonamides were often combined with β-lactams and tetracyclines (Sánchez-Osuna et al., 2018). Compared with other antibiotics, tetracyclines and sulfonamides are more readily adsorbed by soil and other natural organic matter (Kumar et al., 2005). Thus, surveillance is urgent to avoid the dissemination of antibiotic resistance in Garze Tibetan Autonomous Prefecture, Sichuan Province, China.
Bacterial resistance arises from multiple factors, necessitating a comprehensive, multifaceted approach to understanding its spread. The mobility of resistance genes enables their transfer between bacterial species via mobile genetic elements, facilitating the spread of pathogenic resistance genes (Mmh et al., 2021). Integrases are one of the major causes of multidrug resistance in gram-negative bacteria. Strains with class I integrase exhibit distinct resistance profiles compared to those lacking class I integrase (Sunde and Norström, 2006). We detected 41 ARGs associated with tetracyclines, β-lactams, aminoglycosides, fluoroquinolones, amphenicols, and sulfonamides, and 25 were positively detected in this study. Detection rates of ARGs were similar to a previous study, where resistance gene detection rates for β-lactams, aminoglycosides, tetracyclines, amphenicols, macrolides, sulfonamides, and polymyxins ranged from 50% to 96% (Peng et al., 2021). A study in India also found that isolates from various animals and their handlers carry multiple resistance genes (Mitra et al., 2024). Integrase genes*, intl1* and intl2, have also been detected in pigs, chickens, and cattle (Wang et al., 2019; Yang et al., 2020). We also detected integrase genes, intl1 and intl2, with detection rates of 90.16% and 15.16%, respectively. Our results revealed a strong correlation between resistance genes and resistance phenotypes, with a significant difference between integrase gene-positive and gene-negative strains, highlighting the necessity to monitor integrase genes to prevent worsening antimicrobial resistance in Tibetan pigs.
In this experimental design, we detected 23 virulence genes, the results showed that 17 virulence genes (agn43, astA, bcsA、colV, eaeA, fimC, fyuA, hlyA, hlyF, irp2, iss, ler, LT, ompT, sitA, stx2, tsh) were positively detected, while 6 genes (afa, bcsB, ehxA, papC, stx1, and Vat) were not detected. Overall, our results indicate that most E. coli isolates are diarrheagenic pathotypes. Nevertheless, the occurrence of single or multiple virulence factors does not essentially signify its pathogenicity. Further studies via animal models or tissue cultures are needed to confirm the pathogenicity based on the observed virulence genotypes. Among the detected virulence genes, bcsA, fimC, and agn43 had the highest detection rates, with the agn43/bcsA/fimC combination being the most prevalent genotype, accounting for 17.92% (19/106). Agn43 encodes an adhesin that bacterial attachment to host cells (Sora et al., 2021). BcsA encodes bacterial cellulose synthase, which aids in biofilm formation and promotes adherence to host cells (Castiblanco and Sundin, 2018). FimC encodes the Type I flagellum adhesin, an adhesion factor critical for fimbriae synthesis; mutations in fimC can impair fimbriae formation (Gahlot et al., 2022). The above three virulence genes are all associated with biofilm formation, suggesting that E. coli isolated from Tibetan pigs may exert pathogenic effects through biofilm formation. The relationship between biofilm formation and virulence gene expression is needed in our future work.
Sixty-four strains were identified as DEC, with EAEC showing the highest isolation rate. Most of the 17 virulence genes were found in EAEC, likely due to its high prevalence. Phylogenetic analysis showed that the 17 detected virulence genes are mainly distributed in groups A and B1, aligning with Rehman et al.’s finding that virulence genes are predominantly found in group A (Rehman et al., 2017). Notably, studies have found that human-derived E. coli in group B2 is associated with the virulence genes fimH, irp2, kpsMTII (Monroy-Pérez et al., 2020). The discrepancies in these findings may be attributed to animal groups or geographical origin.
In this study, we developed a rapid and simple method to investigate the relationship between ERIC-PCR typing and biofilm formation. ERIC-PCR typing identified 11 separating DNA fragments of varying sizes ranging from 300 bp to 2000 bp. Based on a genetic similarity of 61.2%, 84.38% of the DEC were classified as cluster II, with all five clusters showing weak biofilm-forming ability. A study in Iran also found that DNA fragments of varying sizes of 115 tested strains ranged from 380 bp to 3280 bp, with different band distributions depending on the animal source: chicken samples primarily concentrated around 2800 bp, while sheep and cattle samples focused around 1200 bp (Ranjbar et al., 2017).
A total of 120 ARGs were predicted from CARD in EAEC 5-12, including genes for tetracyclines (tetA, tetB, tetD, and tetT), aminoglycosides (aadA5, aph (3’’)-Ib, and aph(6)-Id), fluoroquinolones (mfd, gyrA, and gyrB), amphenicols (cat1, cmlV, and mexN), β-lactams (CMY-63, mecC, and ompK37), and sulfonamides (sul2 and sul3). Additionally, resistance genes related to efflux pumps, macrolides, glycopeptides, and lacosamide were also predicted, and most were associated with efflux pumps. Although EAEC 5–12 is sensitive to PLB, it is predicted to carry the MCR-3 gene.
Adhesins are key proteins that facilitate pathogen-host binding, and the genes (fimA, fimB, fimC, etc.) carried by EAEC 5–12 play a role in the pathogen’s colonization process. The entA, entB, and fepA genes in EAEC 5–12 are nutritional/metabolic factors that supply essential nutrients to the pathogen. The ompA, LPS, and pbpG genes are involved in immune regulation, modulating the immune response to the pathogen. Through WGS and VFDB alignment analysis, fourteen virulence genes were predicted in EAEC 5-12, primarily including adhesins, nutritional/metabolic factors, and immune regulators. Most of the virulence genes mentioned above are linked to biofilm formation and pathogenicity, suggesting that effectively inhibiting biofilm formation could be a strategy to reduce pathogenicity in bacterial infections.
A limitation of this study is the small sample size, and our future work should increase sample sizes for WGS. Another important issue to address is that a systematic and comprehensive reference for the research on antimicrobial resistance based on machine learning methods and data mining techniques is urgent in our future work.
Conclusion
5
The present study highlights the important role of the Tibetan pigs as a potential reservoir of multidrug-resistant E. coli carrying a variety of virulence genes that evoke public health problems by spreading into the environment. The association between antibiotic resistance and virulence genes reveals that virulence characteristics in Tibetan pigs might be selected by antibiotic usage in Tibetan pig farms. In summary, it is urgent to enhance surveillance response systems for monitoring the rational use of antimicrobial agents in Tibetan pigs in Garze Tibetan Autonomous Prefecture, Sichuan province, China.
The reference list from the paper itself. Each links out to its DOI / PubMed record.
- 1An S. (2024). Study on drug resistance genes of Klebsiella pneumoniae clinical isolates in Jilin Province. [master’s thesis]. Jilin Province: Jilin University. doi: 10.27162/d.cnki.gjlin 2023.002349 · doi ↗
- 2Arnold B. J.Huang I. T.Hanage W. P. (2022). Horizontal gene transfer and adaptive evolution in bacteria. Nat. Rev. Microbiol. 20, 206–218. doi: 10.1038/s 41579-021-00650-4 34773098 · doi ↗ · pubmed ↗
- 3Cao Z.Qi M.Shang P.Zhang H.Nawaz S.Ghaffar A.. (2023). Characterization, estimation of virulence and drug resistance of diarrheagenic Escherichia coli (DEC) isolated from Tibetan pigs. Microb. Pathog. 177, 106046. doi: 10.1016/j.micpath.2023.106046 36842515 · doi ↗ · pubmed ↗
- 4Castiblanco L. F.Sundin G. W. (2018). Cellulose production, activated by cyclic di-GMP through Bcs A and Bcs Z, is a virulence factor and an essential determinant of the three-dimensional architectures of biofilms formed by Erwinia amylovora Ea 1189. Mol. Plant Pathol. 19, 90–103. doi: 10.1111/mpp.12501 27753193 PMC 6638026 · doi ↗ · pubmed ↗
- 5Chen C.Li Y.Tan M.Wang L.Huang Z. (2021). Biofilm-forming phenotype, antibacterial resistance genes, integrase genes and virulence genes detection of Escherichia coli isolated from yaks and Tibetan pigs in northwest Sichuan Plateau. Agricultural Sciences in China. 54, 5144–5162. doi: 10.3864/j.issn.0578-1752.2021.23.018 · doi ↗
- 6Clinical Laboratory Standards Institute (2013). Performance standards for antimicrobial susceptibility testing; Twenty-third informational supplement (Wayne, PA: Clinical Laboratory Standards Institute (CLSI document M 100-S 23).
- 7Duriez P.Clermont O.Bonacorsi S.Bingen E.ChaventréA.Elion J.. (2001). Commensal Escherichia coli isolates are phylogenetically distributed among geographically distinct human populations. Microbiol. (Reading) 147, 1671–1676. doi: 10.1099/00221287-147-6-1671 11390698 · doi ↗ · pubmed ↗
- 8Escobar-Páramo P.Clermont O.Blanc-Potard A.-B.Bui H.Le Bouguénec C.Denamur E. (2004). A specific genetic background is required for acquisition and expression of virulence factors in Escherichia coli . Mol. Biol. Evol. 21, 1085–1094. doi: 10.1093/molbev/msh 118 15014151 · doi ↗ · pubmed ↗