Evaluating Risk and Benefit Sensitivity for Cognitive Treatments
Kianté A. Fernandez, Brian A. Erickson, Joseph W. Kable, Roy H. Hamilton, John D. Medaglia

TL;DR
This study explores how people weigh risks and benefits when deciding whether to recommend cognitive treatments, finding that benefits are often prioritized over risks.
Contribution
The study introduces a novel ethical judgment paradigm to assess public attitudes toward cognitive treatments and their sensitivity to risks and benefits.
Findings
Participants were slightly more sensitive to benefits than risks when evaluating cognitive treatments.
There was inter-domain stability in ethical judgments across different cognitive dysfunctions.
Results suggest that prominent decision-making theories can explain the prioritization of benefits over risks.
Abstract
Ethical judgments require clinicians, researchers, research participants, and patients to weigh risks and benefits. Novel treatments for cognitive deficits are rapidly emerging, but little is known about how individual differences in risk and benefit sensitivity influence ethical judgments to administer treatments. The public plays important roles as citizens, taxpayers, and consumers of cognitive treatments, yet little is known about how they evaluate risks and benefits in ethical judgments. We examined the influence of risk and benefit sensitivity on the public’s choices about treating cognitive dysfunction. We administered surveys, cognitive measures, and an ethical judgment paradigm to 425 participants recruited via Amazon Mechanical Turk. Participants were asked to choose whether to recommend a hypothetical cognitive treatment with varying degrees of risks and benefits across seven…
Genes, proteins, chemicals, diseases, species, mutations and cell lines named across the full text — each resolved to its canonical identifier and authoritative record.
Click any figure to enlarge with its caption.
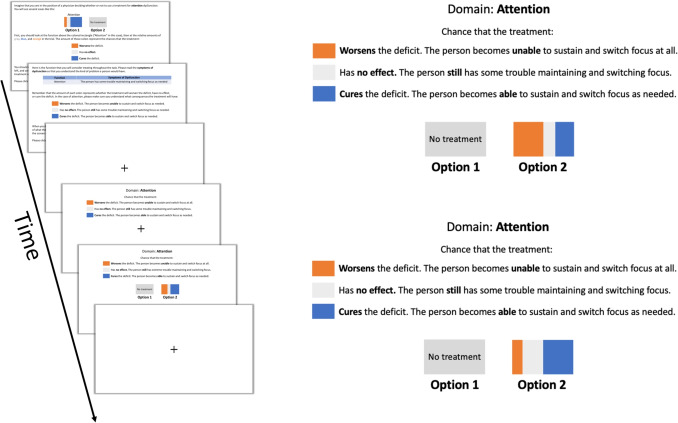 Figure 1
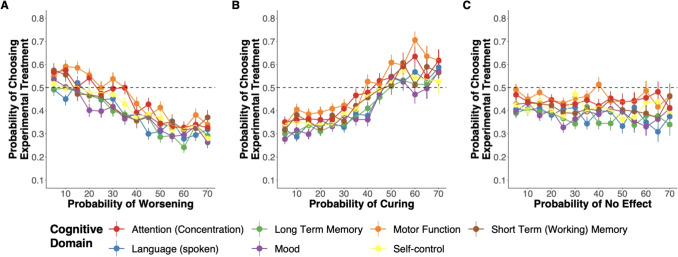 Figure 2
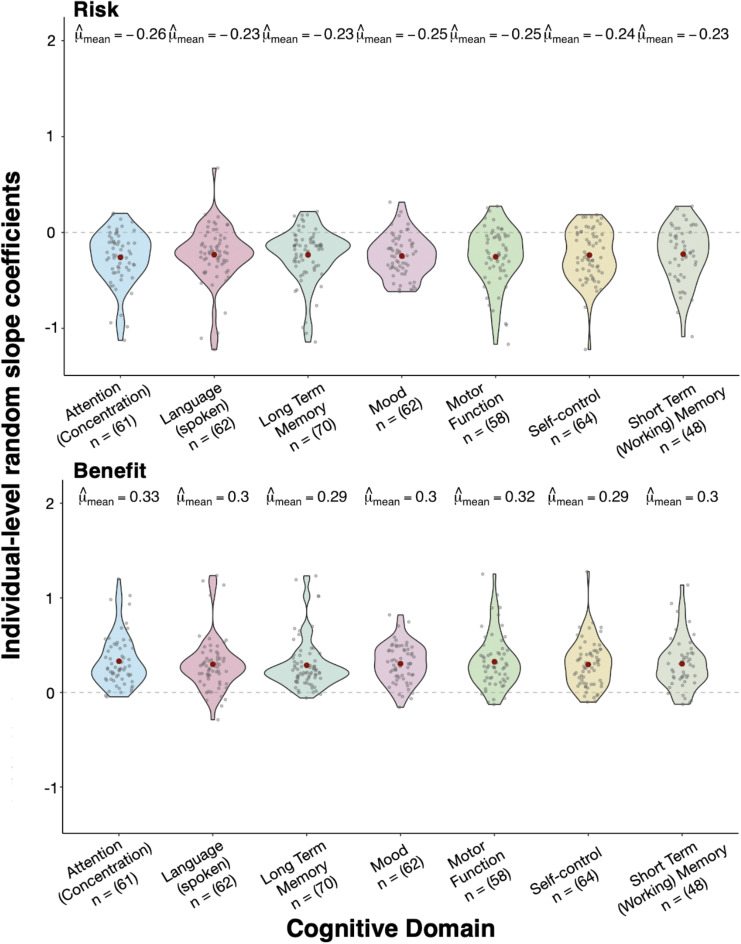 Figure 3
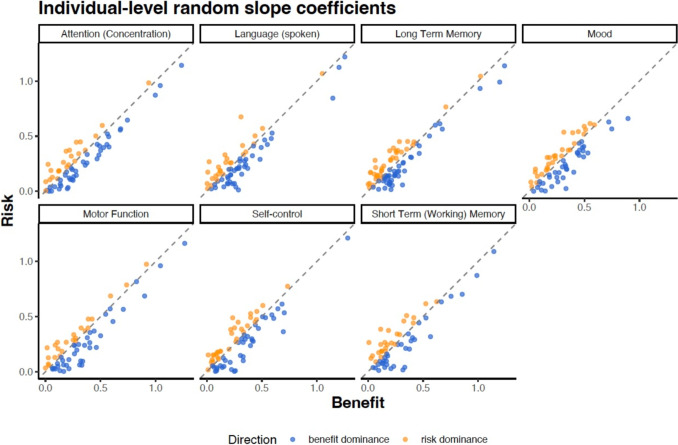 Figure 4
- —http://dx.doi.org/10.13039/100000002National Institutes of Health
- —http://dx.doi.org/10.13039/100000025National Institute of Mental Health
Peer Reviews
No public reviews on file for this paper yet. If you reviewed it on a platform where reviews are public (OpenReview, ICLR, NeurIPS, ICML), you can paste yours below so the community can read it here.
Videos
No videos yet. Explain this paper in a talk, walkthrough, or lecture? Add one.
Taxonomy
TopicsPsychology of Moral and Emotional Judgment · Neuroethics, Human Enhancement, Biomedical Innovations · Psychosomatic Disorders and Their Treatments
Introduction
Cognitive deficits can be treated by modifying the nervous system. Cognitive treatments use methods such as talk therapy, electric stimulation, chemical agents to advanced techniques such as deep brain implants, and closed-loop adaptive algorithms, which selectively target mechanisms to address cognitive and motor dysfunctions (Ezzyat et al., 2018; Johnson et al., 2016; Kim et al., 2017). As technological advancements expand our ability to modify cognitive functions, ethical considerations become increasingly crucial. Ongoing neuroethical debates inform our ability to prevent harm but also respect autonomy, agency, and personhood (Cabrera et al., 2014; Medaglia et al., 2017, 2020). However, as we continue to anticipate and address ethical questions raised by cognitive treatments, the psychological factors influencing individuals’ decisions to influence cognition and treat deficits are still largely unknown.
As these technologies and the relevant debates about modifying cognition emerge (Amadio et al., 2018), the public plays a crucial role as a key stakeholder. The public contributes to funding treatments for cognitive deficits research through taxation and some members of the public become participants and patients in research on treatments for cognitive deficits (Li et al., 2022). How individuals weigh the risks and benefits of treating cognition could determine whether or not they participate in effective treatments. A sizable portion of the public expresses apprehension about implanted neural devices, with 69% expressing that they are at least somewhat concerned (Funk et al., 2016; Klein et al., 2023). While studies have begun to reveal public attitudes toward treatments for cognitive deficits, we know little about what drives public worry.
Prior studies have provided some insight into what drives public attitudes toward interventions on cognitive function. When it comes to interventions aimed at enhancing cognition, among the public, people report being more reluctant to enhance aspects they consider fundamental to their identities (Riis et al., 2008). Additionally, research suggests that public opinions are influenced by the perceived effects and moral implications of using technologies to influence cognition. For instance, in a trinational survey, respondents reported both enthusiasm and worry about brain-computer interface technology depending on the domain of application and sociodemographic factors (Sample et al., 2019). Research on cognitive enhancement has also demonstrated that public attitudes are influenced by framing effects (Schelle et al., 2014). Furthermore, factors like peer pressure, the influence of authority figures (Conrad et al., 2019; Dinh et al., 2020), competition (Greely et al., 2008; Partridge et al., 2012), moral relevance (Cabrera et al., 2015a; Faber et al., 2015; Scheske and Schnall, 2012), familiarity with enhancement devices (Bell et al., 2013), expertise (Banjo et al., 2010; Fitz et al., 2014), and the domain of cognitive enhancement (Haslam et al., 2020) can all influence public attitudes. Moreover, the public is sensitive to the difference between cognitive enhancement and treatments. People are more willing to endorse repairing cognitive functions than enhancing them and are more hesitant when they consider the morality of a particular intervention first (Haslam et al., 2020; Medaglia et al., 2019a). Among patients, patients’ reduced compliance for cognitive treatments is caused by psychological factors (Marrero et al., 2020; Mohr et al., 2010; Velligan et al., 2017) and sociodemographic factors (Barrett et al., 2008). Overall, the evidence suggests that for cognitive enhancements and treatments, factors such as framing, evaluation, mechanism of action, and the specific cognitive target of interventions can significantly influence individuals’ willingness to use them.
Despite broader research themes, whether neuroethical principles loom large in public judgments is relatively less studied. A fundamental neuroethical guiding principle, safety, requires risks to be rigorously assessed and carefully weighed against the likely benefits of research and treatments. Psychological risk1 and benefit sensitivity have been studied in medical decision-making for many years, including in choices involving treatment recommendations (Hauber et al., 2013; Rasiel et al., 2005; Waters et al., 2007). Research suggests that individual variability in risk and benefit sensitivity is indeed evident in consumer and clinician decision-making (Galizzi et al., 2016; Nadler and Reiner, 2010; Zhang et al., 2019). If individual variability in risk and benefit sensitivity exists across consumer and clinician contexts, it is possible this variability might also exist in ethical judgments about treatments for cognitive deficits. If such variability is evident when the public or others evaluate treatments, individual differences could have real-world consequences. For instance, risk-tolerant individuals could take individual actions or suggest policies that are more likely to result in harm (Eichler et al., 2013). In addition, disagreements about treatments for cognitive deficits could motivate either enthusiasm or antagonism to ongoing research efforts, influencing funding, participation, and public understanding. However, although neuroethicists have called for more quantitative approaches to explore issues pertinent to neuroethics, quantitative approaches to studying risk and benefit sensitivity have not been applied to ethical judgments about cognitive treatment (Fernandez et al., 2022; Fitz et al., 2014; Reiner, 2019; Specker et al., 2017).
To address this gap, we examined whether risk & benefit sensitivity could (1) be detected in an ethical judgment paradigm involving a simple choice between two options — to treat or not — and (2) varied across seven different cognitive domains that are frequently affected in clinical syndromes. We hypothesized that individuals would weigh risks and benefits differently. More specifically, given evidence that individuals tend to be risk-averse in various contexts (Chauvin, 2018; Kahneman and Tversky, 1979; Thaler et al., 1997), we hypothesized that the public’s choices would be more sensitive to the risks of potential cognitive losses than benefits of potential cognitive gains. Furthermore, we predicted that participants’ risk and benefit sensitivity would vary by cognitive domain, with greater sensitivity to cognitive functions more central to personal identity, such as mood, self-control, and long-term memory (Medaglia et al., 2019a). Specifically, we expected that participants would be more risk and benefit-sensitive to treatments involving deficits in mood and self-control, as these functions tend to be regarded as more central to their personhood (Riis et al., 2008).
Methods
Overview
Before completing the primary study, we conducted initial pilot studies of our ethical judgment task to ensure that participants understood the prompts and could respond adequately to test our hypotheses (see “Initial piloting and task design” below). After piloting, we randomly assigned 616 individuals to one of 7 different cognitive conditions: attention (concentration), long-term memory, shor-term (working) memory, mood, language (spoken), self-control, and motor function. In each condition, participants were asked to complete the computerized neuroethical judgment task, then respond to a demographic questionnaire and surveys that assessed their personality (Soto and John, 2017), political ideologies (Inbar et al., 2009), values (Lindeman and Verkasalo, 2005), empathy (Davis, 1983), numeracy (Cokely et al., 2012; Fagerlin et al., 2007), moral foundations (Graham et al., 2009), and moral commitments (Lombrozo, 2009). The sample characteristics and specific procedures are described below. This study was approved by the Institutional Review Board at Drexel University and all participants provided informed consent prior to participating in the study.
Data and Code Availability
All materials, the data, and R scripts required to reproduce the analyses reported in this paper are available at https://osf.io/n3s9p.
Participants
A total of 610 participants were recruited from Amazon Mechanical Turk (MTurk). MTurk allows researchers to collect high-quality data rapidly among demographically diverse individuals (Buhrmester et al., 2011). Prior work has shown that MTurk can be reliably used to make inferences about a number of broader populations of interest (Coppock, 2019; Huff and Tingley, 2015; Johnson and Ryan, 2020). The participants were required to be located within the United States, over the age of 18, and fluent in English. Although limitations apply to MTurk studies, studies have shown that the quality of MTurk responses can improve with a priori researcher constraints (Cheung et al., 2017; Peer et al., 2014; Thomas and Clifford, 2017). Consistent with these findings, participants were also required to have previously completed at least 100 tasks and maintain at least a 95% requester approval rating on MTurk. Additional exclusions were applied to further ensure that we analyzed high-quality behavioral data (see Exclusions). The final sample included 425 participants (177 females), with a mean age M = 36.4 years of age (SD = 11). For a full breakdown of demographics, see Table 1. The participants completed the task in an average of M = 7.79 min (SD = 10.04) and surveys in an average of M = 19.27 min (SD = 13.15).Table 1. DemographicsCharacteristicN = 425SexFemale177 (42%)Male245 (58%)Other3 (0.7%)Age33 (28, 43)Race/EthnicityAmerican Indian/Alaska Native8 (1.9%)Asian44 (10%)Black41 (9.6%)Hispanic or Latino23 (5.4%)Mixed12 (2.8%)Native Hawaiian/Pacific Islander1 (0.2%)Other1 (0.2%)Prefer not to say2 (0.5%)White293 (69%)EducationUndergraduate242 (57%)Postgraduate68 (16%)High School114 (27%)Less than high school1 (0.2%)Income44,000 (26,500, 68,500)Statistics presented, n (%); median (IQR)
Exclusions
Participants were excluded according to participant quality control and data analytic criteria prior to our primary analyses. A total of 191 participants were excluded, yielding a final sample size of 425. Our overall aggressive exclusion rate of 31% is in line with studies of quality control measures on MTurk (Crump et al., 2013; Downs et al., 2010; Paolacci and Chandler, 2014).
Participant Exclusions for Quality Control
In line with recommendations for studies conducted using Amazon Mechanical Turk service, careful instructions, a priori exclusion criteria, and multi-method approaches for detecting and excluding careless/invalid responses in online samples were applied to further ensure data quality (Crump et al., 2013; Curran, 2016). Specifically, individual trials were excluded if response times were either less than 250 milliseconds (likely impulsive responses) or above 90 s (likely to be non-responses or inattention to the task/time-outs since there was no time limit to make a decision). Additionally, after we applied single-trial exclusions within each participant, some participants were left with less than half the total amount of trials. Patterns of responses with more than half of the total trials removed were likely to be due to consistent impulsive responses or computer-assisted automated completion. Thus, participants were excluded if, after single trial exclusions, they failed to retain at least 40 out of the total of 75 trials. Finally, participants were excluded for failure to pass any of four attention check items randomly administered throughout the survey or a total survey completion time below five minutes, which we found to be implausibly fast to provide valid responses in piloting.
Data Analytic Exclusions
Participants were also excluded for selecting a “yes” or “no” response on at least 90% of the total number of trials. Such patterns of stereotyped responses precluded the ability to estimate reliable coefficients in our statistical models. Additionally, these responses might more likely result from individuals not engaging with the information presented on screen during the task. Our analyses yield quantitatively similar results when a less conservative set of exclusions were applied (i.e., excluding only repeat entries or subject entry errors identified when merging survey and task data).
Experimental Design
Stimuli and Procedure
We used a two-alternative forced-choice task to measure individuals’ sensitivity to risks and benefits when serving as a physician hypothetically deciding whether to recommend a treatment for cognitive dysfunction.
Choice tasks are a useful tool in health decision science to measure preferences in which participants are presented with two or more options (Soekhai et al., 2019). Participants then choose which one they prefer. Each option can include attributes that researchers manipulate. Here, we used a discrete two-alternative forced-choice task because, in the real world, clinicians often make the dichotomous choice to recommend a particular treatment or not.
We created seven versions of this task to manipulate the cognitive domain in which participants were asked to make treatment recommendations. Each participant was assigned to one of seven conditions, one for each cognitive domain being assessed: attention/concentration, long-term memory, short-term (working) memory, mood, language (spoken), self-control, and motor function. For a description of each cognitive domain, see Table 2. Participants were randomly assigned to respond only to items containing a single cognitive function so that we could examine the within-subject effects of risk & benefit and the between-subject effect of cognitive condition on choices. For instance, if a participant was assigned to the “attention” condition, they only chose whether to recommend the treatment for attention at different benefit and risk levels.Table 2. Descriptions of cognitive functions and dysfunctionFunctionDescriptionSymptoms of dysfunctionAttention (concentration)The ability to sustain and switch focus as needed to complete tasksHas some trouble maintaining and switching focusMoodAn emotional state, such as feeling sad or happyHas some trouble feeling happyLong-term memoryThe ability to hold and recall information about the pastHas some trouble remembering people, places, and thingsShort-term (“working”) memoryThe ability to hold and work with information in mind right nowHas some trouble remembering what they just heard or sawLanguage (spoken)The ability to communicate by speakingHas some trouble speakingMotor functionThe ability to control one’s own body as intendedHas some trouble moving their bodySelf-controlThe ability to set and achieve goals by inhibiting unwanted and engaging in wanted behaviorsHas some trouble controlling their thoughts and emotions
Participants were told that they were to take the role of a physician who needed to make treatment decisions with varying potential outcomes for a patient with a cognitive deficit. The mechanism for the treatment of interest was not specified to ensure that the effect of the cognitive domain would not depend on the specifics of the treatment. Before starting the experiment, participants were instructed as follows:“We are interested in how you think about trade-offs between risk and benefits when treating cognitive deficits. We will ask you to consider a few scenarios. You will need to think about whether you would choose to use a treatment on a patient or not. In the real world, different treatments are associated with different chances of risk and benefits. Your task is to indicate whether or not you would recommend one of the treatments based on the chances that it will improve or harm the stated function all else being equal.”After reading the instructional slides, participants were shown an example slide to familiarize themselves with the main task. Then, in a sequence of 75 trials, participants were presented with scenarios and they were asked to choose between two treatment options: no treatment or a single treatment. At the start of each trial, a fixation cross was displayed for 200 ms on the center of the screen. After fixation, participants were prompted with the cognitive function and the associated dysfunction symptom for 1000 ms. The cognitive symptom reminder remained on the screen during the entire duration of the trial.
While the reminder prompt remained on the screen, participants were presented with an experimental treatment with a varying amount of risk, benefit, or no effect. In each trial, the experimental treatment appeared on the screen in the form of a visual analog painted partly orange, blue, and gray to ensure colorblindness compatibility (Cravit, 2019). Participants were instructed that (1) the amount of orange in the box was proportional to the probability that the cognitive deficit doubled in severity, (2) the amount of gray was proportional to the probability that the treatment has no effect, (3) and the amount of blue was proportional to the probability that the cognitive deficit was removed (see Fig. 1). The no effect (gray) component allowed us to evaluate the influence of risks and benefits independently across trials because they were free to vary quasi-independently (i.e., the orange, gray, and blue together always summed to 100%, but the amount of orange was free to vary from the amount of blue).Fig. 1. On the left is presented the order of the initial task instructions and a single trial fixation, a reminder of the color mapping, choice stimulus, and inter-trial fixation. On the right are two example trials with different levels of risks and benefits. We used visual analog stimuli to represent the likelihood of treatment effects in stimuli where the sum of the orange, gray, and blue always comprised 100% of the rectangle. In this example, if the participant chose the experimental treatment, she would be recommending one with relatively more risk due to the probability of worsening the deficit being higher, whereas, in the next trial, she would be recommending a treatment with relatively more benefits
The probability of a treatment outcome stated above was directly proportional to the size of the orange and blue regions of the box. The risk and benefit attributes were independently manipulated, with benefit and no effect amounts ranging from 5 to 90% in 5% increments and risk amounts ranging from 5 to 70% in 5% increments, for a total of 75 trials. Participants responded by pressing either “z” for the option on the left or “m” for the option on the right. Upon a response, trials advanced automatically. The left-right orientation of treatment and no treatment stimuli were counterbalanced across trials. See Fig. 1 for a summary of the task stimuli.
Initial Piloting and Task Design
Before implementing the primary choice task described above, we tested several paradigms to identify a design that would yield high-quality data for an online study, maintain ecological validity, and be completed in a timely manner. One initial concern when developing a task to emulate a simplified yet realistic trade-off was ensuring ecological validity. In our specific task, we focus on instances where a treatment intended to improve a function may not only have no effect but could potentially worsen other cognitive functions. We chose to limit our design and scope to this single aspect to concentrate on cases where techniques produce isolated effects including transient decrements on a targeted function. These effects can be observed in cases such as intentional “virtual lesions” or other parameters of TMS applied during cognitive processes (Giustiniani et al., 2022; Luber and Lisanby, 2014; Walsh and Pascual-Leone, 2003). While our task is designed to consider scenarios in which treatments aimed at improving a cognitive function have isolated effects or none at all, the larger context of side effects — especially those affecting functions unrelated to the targeted function — holds significant ecological relevance. For instance, even in treatment recommendations, the trade-offs involved in altering cognitive functions are not always directly related to the specific function being targeted (Giustiniani et al., 2022; Rossi et al., 2021), which contrasts with the structure we chose for our design. Future adaptations of the choice task could take these broader across-function trade-off scenarios into account. Having established the scope of our choice task to consider a trade-off directly related to the cognitive function at hand, we first piloted a version of the task with 50 online participants and received low-quality data (e.g., random responding, misunderstanding the mapping between colors, risks, and rewards). To address this, we added persistent reminders of the color mappings, which remained visible on each trial (see Fig. 1). During piloting, we found that 43% of participants showed no statistically significant responsiveness to risk and benefit. Among those who did, risk sensitivity notably diminished beyond a 70% threshold. To optimize task design, we considered restricting the range to focus on risks up to 70%. This design choice, capping risks at 70%, increased the frequency of “yes” responses, allowing for a more reliable estimation of risk sensitivity coefficients. Additionally, this approach retained the capacity to identify participants who showed no statistically significant risk response; in the pilot data, flat responders remained unresponsive across the entire range of risks. A subsequent pilot, with risk levels capped at 70%, confirmed that participants continued to reduce endorsement of treatments well before reaching this threshold. Together, the final task design used up to a 90% chance of benefits and a 70% chance of risks, enabling us to statistically model the effects of each. We ensured that the language describing the tasks and cognitive functions of interest was well understood by participants, that the task could be completed quickly without significant fatigue or disengagement, and that we obtained high-quality data from which to estimate risk and benefit sensitivity for most participants.
Demographics
After the judgment task, participants reported their sex, age, race/ethnicity, education, income, field of study, employment status, and political party. In addition, using Likert scales, participants reported their religious upbringing, current religious tradition, degree of religiosity, degree of spirituality, church or other religious meeting attendance, time spent in religious/spiritual activities, relationship status, whether they thought human minds are more like computers or souls, and whether they had ever used a device to optimize cognition before. For details of all the possible responses to the demographic categories and how each item was measured see OSF materials. In this study, we focused only on the results of the judgment task. For a complete list of measures not included in the current report please see our OSF repository https://tinyurl.com/2p8mwpwn.
Statistical Analyses
All statistical analyses were carried out using R programming language version 4.0.2. Mixed effect modeling were carried out using the lme4 package (version 1.1-23) & lmerTest package (version 3.1-2) (Bates et al., 2015; Kuznetsova et al., 2017). Visualizations were carried out using the ggplot2 package (Wickham, 2009).
Behavioral choice data were analyzed using general linear mixed-effect modeling with a logit link function. This technique is used to model binary outcome variables, in which the log odds of the outcomes are modeled as a linear combination of the predictor variables that contain both fixed and random effects. Then, within the mixed effect logistic regression, we modeled whether or not participants would recommend one of the treatments as a binary dependent variable, where 1 indicated recommending an experimental treatment and 0 indicated recommending no treatment, and the probability of worsening the defect (amount of orange: risk), and the probability of curing the deficit (amount of blue: benefit) as independent variables. We included a random intercept and slope for risks and benefits across participants. Models included maximal random-effect structures that allowed the model to converge (Barr et al., 2013).
To evaluate individual risk and benefits sensitivity, from the model we extracted the risk and benefit parameters predictions for each individual by using empirical Bayes linear unbiased predictors (EBLUP) for each participant (Henderson, 1975). In practice, because random-effects parameters are unknown, the parameters are estimated and plugged into the predictor, leading to the EBLUP. This method allowed us to estimate variance components for the risks and benefits terms using the estimated random effects for each participant. EBLUPs have been used as indicators of individual differences in the dynamic processes underlying psychological phenomena of interest. For example, clinical psychology has used random effects to quantify individuals’ emotional reactivity (Mroczek et al., 2015). To test if participants were more sensitive to losses than gains, a paired samples t-test was used to compare the participant-specific risk and benefit sensitivity estimates. Because we are interested in the difference in magnitude between risk and benefit irrespective of the direction of the effect, a sign inversion was used to ensure mean differences were not driven by the direction of the risk or benefit terms. Then, to test the effect of a cognitive domain on the difference in risk and benefit sensitivity we conducted two separate one-way ANOVAs; one each for risks and benefits.
Models were examined graphically and analytically using a simulation-based approach for assessing the residual diagnostics for multi-level models (Hartig and Lohse, 2021), and assumptions were adequately met. The alpha level for statistical significance was 0.05.Fig. 2. Experimental treatment choice results across each cognitive function domain. A Choice proportion for the experimental treatment as a function of the probability of worsening the deficit. B Choice proportion for the experimental treatment as a function of the probability of curing the deficit. C Choice proportion for the experimental treatment as a function of the probability of no effect on the deficit
Results
Descriptive Results
We obtained several descriptive statistics to first examine the behavioral data. On average, participants did not recommend the treatments presented. The probability that the no treatment option was selected across participants was 58.7% (SD = 0.17), with 74.6% of participants being more likely to select the no treatment option rather than recommend the experimental treatment. These probabilities are larger than 50%, which is the rate we would expect if choices were made by chance (t (424) = 10.41, \documentclass[12pt]{minimal} \usepackage{amsmath} \usepackage{wasysym} \usepackage{amsfonts} \usepackage{amssymb} \usepackage{amsbsy} \usepackage{mathrsfs} \usepackage{upgreek} \setlength{\oddsidemargin}{-69pt} \begin{document}$$p<$$\end{document} 0.001 when compared to 50% using a one-sample t-test).
For each trial, the average trial completion time for the task was M = 1.77 s (SD = 3.31). Participants did not respond significantly faster to reject than accept the treatment: the average decision to reject the treatment took 1.72 s, whereas the average decision to recommend the treatment took 1.83 s (difference = \documentclass[12pt]{minimal} \usepackage{amsmath} \usepackage{wasysym} \usepackage{amsfonts} \usepackage{amssymb} \usepackage{amsbsy} \usepackage{mathrsfs} \usepackage{upgreek} \setlength{\oddsidemargin}{-69pt} \begin{document}$$-$$\end{document} 0.0072 s, 95% CI [ \documentclass[12pt]{minimal} \usepackage{amsmath} \usepackage{wasysym} \usepackage{amsfonts} \usepackage{amssymb} \usepackage{amsbsy} \usepackage{mathrsfs} \usepackage{upgreek} \setlength{\oddsidemargin}{-69pt} \begin{document}$$-$$\end{document} 0.112, 0.0977], t(424) = \documentclass[12pt]{minimal} \usepackage{amsmath} \usepackage{wasysym} \usepackage{amsfonts} \usepackage{amssymb} \usepackage{amsbsy} \usepackage{mathrsfs} \usepackage{upgreek} \setlength{\oddsidemargin}{-69pt} \begin{document}$$-$$\end{document} 0135, p = 0.893).
Main Effect of Risk and Benefit Sensitivity
As expected, participants generally chose in line with not recommending treatments with a higher probability of worsening the deficit (see Fig. 2A) and, recommending treatments with a higher probability of curing the deficit (Fig. 3B). The odds of choosing to recommend the treatment decreased as the probability of worsening the deficit increased (OR = 0.79, 95% CI [0.75, 0.82], \documentclass[12pt]{minimal} \usepackage{amsmath} \usepackage{wasysym} \usepackage{amsfonts} \usepackage{amssymb} \usepackage{amsbsy} \usepackage{mathrsfs} \usepackage{upgreek} \setlength{\oddsidemargin}{-69pt} \begin{document}$$p<$$\end{document} 0.001). Additionally, we also found that the odds of choosing to recommend the treatment increased as the probability of curing the deficit increased (OR = 1.35, 95% CI [1.3, 1.41], \documentclass[12pt]{minimal} \usepackage{amsmath} \usepackage{wasysym} \usepackage{amsfonts} \usepackage{amssymb} \usepackage{amsbsy} \usepackage{mathrsfs} \usepackage{upgreek} \setlength{\oddsidemargin}{-69pt} \begin{document}$$p<$$\end{document} 0.001).
Cognitive Domains
We did not find that the domain of deficit influenced people’s treatment recommendations. Table 3 shows the average predicted participant level change in the log odds of choosing the experimental treatment for both risk and benefit across each cognitive domain. The ANOVA did not show support for any effect of the cognitive domain ( \documentclass[12pt]{minimal} \usepackage{amsmath} \usepackage{wasysym} \usepackage{amsfonts} \usepackage{amssymb} \usepackage{amsbsy} \usepackage{mathrsfs} \usepackage{upgreek} \setlength{\oddsidemargin}{-69pt} \begin{document}$$F_{6, 418}$$\end{document} = 0.11, p = 0.995). Likewise, the effect of the cognitive domain for benefit was also not significant, ( \documentclass[12pt]{minimal} \usepackage{amsmath} \usepackage{wasysym} \usepackage{amsfonts} \usepackage{amssymb} \usepackage{amsbsy} \usepackage{mathrsfs} \usepackage{upgreek} \setlength{\oddsidemargin}{-69pt} \begin{document}$$F_{6, 418}$$\end{document} = 0.23, p =.97) thus indicating inter-domain stability across the cognitive domains considered within our study.Fig. 3. Inter-domain stability. Participant-specific random slopes for risks and benefits across each of the seven cognitive domains assessed in our study. Each violin plot shows the distribution of individual-level coefficients. Red dots represent the mean coefficient ( \documentclass[12pt]{minimal} \usepackage{amsmath} \usepackage{wasysym} \usepackage{amsfonts} \usepackage{amssymb} \usepackage{amsbsy} \usepackage{mathrsfs} \usepackage{upgreek} \setlength{\oddsidemargin}{-69pt} \begin{document}$$\hat{\mu }_{\text {mean}}$$\end{document} ) for each domain, while small gray points show individual participant values. Sample sizes for each cognitive domain are displayed below the domain labels. The top panel shows risk sensitivity coefficients, which are predominantly negative across all domains, while the bottom panel displays benefit sensitivity coefficients, which are consistently positive. Notably, the pattern across cognitive domains was consistent, supporting the idea that participants evaluate risks versus benefits similarly across different cognitive domainsTable 3Average predicted participants level change in the log odds for risk and benefit for each cognitive domainDomaineBLUP \documentclass[12pt]{minimal} \usepackage{amsmath} \usepackage{wasysym} \usepackage{amsfonts} \usepackage{amssymb} \usepackage{amsbsy} \usepackage{mathrsfs} \usepackage{upgreek} \setlength{\oddsidemargin}{-69pt} \begin{document}$$_{risk}$$\end{document} SD \documentclass[12pt]{minimal} \usepackage{amsmath} \usepackage{wasysym} \usepackage{amsfonts} \usepackage{amssymb} \usepackage{amsbsy} \usepackage{mathrsfs} \usepackage{upgreek} \setlength{\oddsidemargin}{-69pt} \begin{document}$$_{risk}$$\end{document} eBLUP \documentclass[12pt]{minimal} \usepackage{amsmath} \usepackage{wasysym} \usepackage{amsfonts} \usepackage{amssymb} \usepackage{amsbsy} \usepackage{mathrsfs} \usepackage{upgreek} \setlength{\oddsidemargin}{-69pt} \begin{document}$$_{benefit}$$\end{document} SD \documentclass[12pt]{minimal} \usepackage{amsmath} \usepackage{wasysym} \usepackage{amsfonts} \usepackage{amssymb} \usepackage{amsbsy} \usepackage{mathrsfs} \usepackage{upgreek} \setlength{\oddsidemargin}{-69pt} \begin{document}$$_{benefit}$$\end{document} Attention (concentration) \documentclass[12pt]{minimal} \usepackage{amsmath} \usepackage{wasysym} \usepackage{amsfonts} \usepackage{amssymb} \usepackage{amsbsy} \usepackage{mathrsfs} \usepackage{upgreek} \setlength{\oddsidemargin}{-69pt} \begin{document}$$-$$\end{document} 0.2580.2780.3270.267Language (spoken) \documentclass[12pt]{minimal} \usepackage{amsmath} \usepackage{wasysym} \usepackage{amsfonts} \usepackage{amssymb} \usepackage{amsbsy} \usepackage{mathrsfs} \usepackage{upgreek} \setlength{\oddsidemargin}{-69pt} \begin{document}$$-$$\end{document} 0.2310.3020.2950.287Long-term memory \documentclass[12pt]{minimal} \usepackage{amsmath} \usepackage{wasysym} \usepackage{amsfonts} \usepackage{amssymb} \usepackage{amsbsy} \usepackage{mathrsfs} \usepackage{upgreek} \setlength{\oddsidemargin}{-69pt} \begin{document}$$-$$\end{document} 0.2330.2790.2840.262Mood \documentclass[12pt]{minimal} \usepackage{amsmath} \usepackage{wasysym} \usepackage{amsfonts} \usepackage{amssymb} \usepackage{amsbsy} \usepackage{mathrsfs} \usepackage{upgreek} \setlength{\oddsidemargin}{-69pt} \begin{document}$$-$$\end{document} 0.2450.2170.3010.202Motor function \documentclass[12pt]{minimal} \usepackage{amsmath} \usepackage{wasysym} \usepackage{amsfonts} \usepackage{amssymb} \usepackage{amsbsy} \usepackage{mathrsfs} \usepackage{upgreek} \setlength{\oddsidemargin}{-69pt} \begin{document}$$-$$\end{document} 0.2520.3060.3220.282Self-control \documentclass[12pt]{minimal} \usepackage{amsmath} \usepackage{wasysym} \usepackage{amsfonts} \usepackage{amssymb} \usepackage{amsbsy} \usepackage{mathrsfs} \usepackage{upgreek} \setlength{\oddsidemargin}{-69pt} \begin{document}$$-$$\end{document} 0.2350.2680.2920.246Short-term (working) memory \documentclass[12pt]{minimal} \usepackage{amsmath} \usepackage{wasysym} \usepackage{amsfonts} \usepackage{amssymb} \usepackage{amsbsy} \usepackage{mathrsfs} \usepackage{upgreek} \setlength{\oddsidemargin}{-69pt} \begin{document}$$-$$\end{document} 0.2250.2960.2990.268Note: eBLUP empirical best linear unbiased prediction, SD standard deviation
Influence of Risks and Benefits
While we expected that people would weigh the probability of a decline in cognitive function more than the probability of benefits, the paired samples t-test revealed that the difference in absolute value of EBLUPs between benefit and risk ( \documentclass[12pt]{minimal} \usepackage{amsmath} \usepackage{wasysym} \usepackage{amsfonts} \usepackage{amssymb} \usepackage{amsbsy} \usepackage{mathrsfs} \usepackage{upgreek} \setlength{\oddsidemargin}{-69pt} \begin{document}$$M_{diff}$$\end{document} = \documentclass[12pt]{minimal} \usepackage{amsmath} \usepackage{wasysym} \usepackage{amsfonts} \usepackage{amssymb} \usepackage{amsbsy} \usepackage{mathrsfs} \usepackage{upgreek} \setlength{\oddsidemargin}{-69pt} \begin{document}$$-$$\end{document} 0.035) was significant (difference = 95% CI [ \documentclass[12pt]{minimal} \usepackage{amsmath} \usepackage{wasysym} \usepackage{amsfonts} \usepackage{amssymb} \usepackage{amsbsy} \usepackage{mathrsfs} \usepackage{upgreek} \setlength{\oddsidemargin}{-69pt} \begin{document}$$-$$\end{document} 0.045, \documentclass[12pt]{minimal} \usepackage{amsmath} \usepackage{wasysym} \usepackage{amsfonts} \usepackage{amssymb} \usepackage{amsbsy} \usepackage{mathrsfs} \usepackage{upgreek} \setlength{\oddsidemargin}{-69pt} \begin{document}$$-$$\end{document} 0.025], t(424) = \documentclass[12pt]{minimal} \usepackage{amsmath} \usepackage{wasysym} \usepackage{amsfonts} \usepackage{amssymb} \usepackage{amsbsy} \usepackage{mathrsfs} \usepackage{upgreek} \setlength{\oddsidemargin}{-69pt} \begin{document}$$-$$\end{document} 7.21, \documentclass[12pt]{minimal} \usepackage{amsmath} \usepackage{wasysym} \usepackage{amsfonts} \usepackage{amssymb} \usepackage{amsbsy} \usepackage{mathrsfs} \usepackage{upgreek} \setlength{\oddsidemargin}{-69pt} \begin{document}$$p<$$\end{document} .001, Cohen’s d = \documentclass[12pt]{minimal} \usepackage{amsmath} \usepackage{wasysym} \usepackage{amsfonts} \usepackage{amssymb} \usepackage{amsbsy} \usepackage{mathrsfs} \usepackage{upgreek} \setlength{\oddsidemargin}{-69pt} \begin{document}$$-$$\end{document} 0.35, CI [ \documentclass[12pt]{minimal} \usepackage{amsmath} \usepackage{wasysym} \usepackage{amsfonts} \usepackage{amssymb} \usepackage{amsbsy} \usepackage{mathrsfs} \usepackage{upgreek} \setlength{\oddsidemargin}{-69pt} \begin{document}$$-$$\end{document} 0.45, \documentclass[12pt]{minimal} \usepackage{amsmath} \usepackage{wasysym} \usepackage{amsfonts} \usepackage{amssymb} \usepackage{amsbsy} \usepackage{mathrsfs} \usepackage{upgreek} \setlength{\oddsidemargin}{-69pt} \begin{document}$$-$$\end{document} 0.25]) with a slightly higher weight placed on benefits (M = 0.32, SD = 0.25) compared to risks (M = 0.28, SD = 0.24). To illustrate this benefit dominance, we replotted the absolute values of the individual-level coefficients shown in Fig. 3 for each cognitive domain. If participants weighted risks and benefits equally, we would expect all data points to fall on the identity line. Consistently, across each domain, we observed that participants tend to have unequal weighting, with evidence indicating that a majority are benefit-dominant (see Fig. 4).Fig. 4. Benefit dominance across cognitive functions. Points represent the absolute value of the participant random slope estimates along the identity line for each cognitive function. The color indicates where the point was above or below the identity. If a participant is above the identity, they were more sensitive to risks; below the identity indicates more sensitivity to benefits
Exploratory Analysis of Response Times
We conducted an additional exploratory analysis of response times. When making ethical judgments, how quickly someone responds may indicate how they arrived at their judgment (Baron and Gürçay, 2017). For example, longer response times may suggest that participants grappled with more decision conflict while deliberating, while shorter responses may suggest that they arrived at their judgments more easily (Konovalov and Krajbich, 2019; Krajbich et al., 2015). Therefore, when making ethical judgments, response times may provide valuable insights into the strength-of-preferences participants may have for one treatment over another. We fitted a linear mixed model to predict log response times as a function of the cognitive domain, risk, and benefit sensitivity separately for trials where participants did and did not select the experimental treatment. The model included subject-level random intercepts and slopes for risk and benefits. As in previous research (e.g., Konovalov & Krajbich, 2019), participants generally took longer on more difficult decisions. For trials where participants selected the treatment, the mixed-effects regression indicates that people choose faster as the probability of curing the deficit increased beta = \documentclass[12pt]{minimal} \usepackage{amsmath} \usepackage{wasysym} \usepackage{amsfonts} \usepackage{amssymb} \usepackage{amsbsy} \usepackage{mathrsfs} \usepackage{upgreek} \setlength{\oddsidemargin}{-69pt} \begin{document}$$-$$\end{document} 0.03, 95% CI [ \documentclass[12pt]{minimal} \usepackage{amsmath} \usepackage{wasysym} \usepackage{amsfonts} \usepackage{amssymb} \usepackage{amsbsy} \usepackage{mathrsfs} \usepackage{upgreek} \setlength{\oddsidemargin}{-69pt} \begin{document}$$-$$\end{document} 0.06, \documentclass[12pt]{minimal} \usepackage{amsmath} \usepackage{wasysym} \usepackage{amsfonts} \usepackage{amssymb} \usepackage{amsbsy} \usepackage{mathrsfs} \usepackage{upgreek} \setlength{\oddsidemargin}{-69pt} \begin{document}$$-$$\end{document} 0.01], p = 0.003. However, they were not similarly sensitive to the probability of worsening the deficit (beta = \documentclass[12pt]{minimal} \usepackage{amsmath} \usepackage{wasysym} \usepackage{amsfonts} \usepackage{amssymb} \usepackage{amsbsy} \usepackage{mathrsfs} \usepackage{upgreek} \setlength{\oddsidemargin}{-69pt} \begin{document}$$-$$\end{document} 0.02, 95% CI [ \documentclass[12pt]{minimal} \usepackage{amsmath} \usepackage{wasysym} \usepackage{amsfonts} \usepackage{amssymb} \usepackage{amsbsy} \usepackage{mathrsfs} \usepackage{upgreek} \setlength{\oddsidemargin}{-69pt} \begin{document}$$-$$\end{document} 0.04, 0.00231], p = 0.080). For trials where participants selected the no treatment option, we found the opposite: people chose no treatment faster as the probability of worsening the deficit increased (beta = \documentclass[12pt]{minimal} \usepackage{amsmath} \usepackage{wasysym} \usepackage{amsfonts} \usepackage{amssymb} \usepackage{amsbsy} \usepackage{mathrsfs} \usepackage{upgreek} \setlength{\oddsidemargin}{-69pt} \begin{document}$$-$$\end{document} 0.03, 95% CI [ \documentclass[12pt]{minimal} \usepackage{amsmath} \usepackage{wasysym} \usepackage{amsfonts} \usepackage{amssymb} \usepackage{amsbsy} \usepackage{mathrsfs} \usepackage{upgreek} \setlength{\oddsidemargin}{-69pt} \begin{document}$$-$$\end{document} 0.05, \documentclass[12pt]{minimal} \usepackage{amsmath} \usepackage{wasysym} \usepackage{amsfonts} \usepackage{amssymb} \usepackage{amsbsy} \usepackage{mathrsfs} \usepackage{upgreek} \setlength{\oddsidemargin}{-69pt} \begin{document}$$-$$\end{document} 0.01], \documentclass[12pt]{minimal} \usepackage{amsmath} \usepackage{wasysym} \usepackage{amsfonts} \usepackage{amssymb} \usepackage{amsbsy} \usepackage{mathrsfs} \usepackage{upgreek} \setlength{\oddsidemargin}{-69pt} \begin{document}$$p<$$\end{document} .001) though they were not similarly sensitive to the probability of curing the deficit (beta = \documentclass[12pt]{minimal} \usepackage{amsmath} \usepackage{wasysym} \usepackage{amsfonts} \usepackage{amssymb} \usepackage{amsbsy} \usepackage{mathrsfs} \usepackage{upgreek} \setlength{\oddsidemargin}{-69pt} \begin{document}$$-$$\end{document} 0.00859, 95% CI [ \documentclass[12pt]{minimal} \usepackage{amsmath} \usepackage{wasysym} \usepackage{amsfonts} \usepackage{amssymb} \usepackage{amsbsy} \usepackage{mathrsfs} \usepackage{upgreek} \setlength{\oddsidemargin}{-69pt} \begin{document}$$-$$\end{document} 0.03, 0.01], p = 0.377). Further investigation of these results is reported in another study.
Discussion
In a two-alternative forced-choice experiment measuring risk and benefit sensitivity in the public when recommending hypothetical treatments for cognitive deficits, we found partial support for our hypotheses. Consistent with our hypothesis, participants weighted risk and benefits differently. However, contrary to our hypothesis, participants were more sensitive to benefits than to risks. Participants also showed unexpected inter-domain stability across cognitive dysfunctions.
Typically, in monetary risky decision-making, most people are expected to be sensitive to risks — they tend to hold on to what they have instead of pursuing more (Kahneman and Tversky, 1979; Thaler et al., 1997). Therefore, the most surprising finding — that individuals were more sensitive to probabilities of benefit than risks to treat others — bears special consideration. One possible explanation draws from a prominent theory of decision-making under risk: prospect theory. Originally developed in the context of monetary decisions, prospect theory is a descriptive theory of how people make decisions under risk and uncertainty (Kahneman and Tversky, 1979). Near the turn of the 21st century, Treadwell & Lenert noted that prospect theory could conceptually account for the differential weighting of short-term and long-term treatment outcomes, the influences of choice framing, and judgments involving the chances of patient survival (Treadwell and Lenert, 1999). Since that time, prospect theory has been adapted to account for a variety of medical decisions (Phillips et al., 2011; Rasiel et al., 2005; Schwartz et al., 2008; van Osch et al., 2006; Winter and Parker, 2007). While prospect theory has been successfully applied in other treatment domains, there have not been thorough applications of prospect theory to study ethical choices about cognitive treatments (for discussion see, Fernandez et al. 2022).
In the context of prospect theory, it is possible that people make choices with respect to a reference point — a status quo starting position along a dimension of value (Kahneman and Tversky, 1979). For treatment recommendations, a reference point could be set along the healthiness of a given cognitive state. Prospect theory predicts that people tend to be risk-seeking below the reference point and risk-averse above it. In our experiment, if participants used healthy cognition as the reference point, they would be expected to weigh an improvement in a deficit more heavily than an equivalent decrement in that deficit, consistent with our finding that participants systematically weigh the prospects of curing a deficit more than expected. However, it is worth noting that an alternative explanation is that participants may assess positive outcomes differently from negative outcomes, displaying asymmetric sensitivity to changes in magnitude for these outcomes. While we designed the vignettes to maximize clarity of the symptoms and benefits of treatment, they may have made it more likely for participants to endorse treatments than respond to risks overall. In the context of our current experiment, participants may not have perceived a unit change in worsening the deficit as equivalent to a unit change in curing the deficit. This cannot be ruled out with the current data because we did not explicitly manipulate whether the worsening condition seemed as equally negative to participants as the cure condition seemed positive. Manipulating the relative value of each end of the judgments could be informative. For instance, more severe symptom levels or less guaranteed curative effects could make participants more hesitant to select the treatments.
We did not detect any statistically significant differences in risk and benefit sensitivity across domains of dysfunction. Given that we applied equal manipulations of the probability of risks and benefits across domains, participants appeared to value the different domains of dysfunction similarly. There is reason to suspect that insensitivity to domain may reflect the public’s impartiality about which particular cognitive domains are targeted by cognitive repair (Cabrera et al., 2015b). Weighing the consequences of recommending the treatment is fundamentally a choice about whether or not to help an individual or not. As our data suggest, the public may be more concerned with how likely treatments are to benefit rather than harm a patient. Alternatively, it is possible that the simplified descriptions of the deficits were not sufficiently detailed or salient to evoke differences in choices. For instance, vignette studies of medical judgments show that participants are sensitive to peripheral threat cues like the invasiveness of the treatment (Gong et al., 2013; Medaglia et al., 2019b), or perceived susceptibility to the deficit (Gallagher et al., 2011). To further test the inter-domain stability suggested here, future work could consider stronger manipulations such as using representative images rather than descriptions for each domain of dysfunction (Dan, 2017; Powell et al., 2015).
We also found that participants exhibited faster response times when selecting treatments with a higher probability of curing the deficit, or when selecting no treatment if it had a higher probability of worsening the deficit. Interestingly, response times often decrease with strength-of-preference, as supported by prior research (Konovalov and Krajbich, 2019; Krajbich et al., 2015). Strength-of-preference refers to the extent to which one option is favored over another. For instance, if a person consistently chooses to read a book over watching a movie, their strength-of-preference for reading is high. Similarly, if a participant consistently chooses not to recommend the experimental treatment, their strength-of-preference for no treatment is high. In our study, the differences in response times between treatment recommendations suggest average differences in the strength-of-preference for each treatment. Future studies should explore additional factors that may contribute to response times such as individual differences (Ratcliff and Childers, 2015; Ratcliff et al., 2015; Schubert et al., 2019). For example, researchers could investigate whether individuals with different moral attitudes have differing strengths-of-preference when selecting the treatment option mediated by their values, which could result in faster response times.
Overall, our results suggest when members of the public might be willing to recommend experimental or conventional therapies for cognitive dysfunction. In judgments where the details of the deficits are relatively sparse, choices might be dominated by the weight placed on risks and benefits relative to the domain of treatment. Though we expected the weighting between attributes to be risk-dominated, our results suggest a more equal weighting between risk and benefits, with the probability of benefits weighted slightly larger relative to other factors in treatment decisions. We suspect that these patterns could reflect the public’s preferences toward cognitive repair. This notion aligns with prior survey research showing that the public is more willing to endorse neuromodulation for repair than enhance to cognition, especially when considering its use on others (Medaglia et al., 2019a). Cabrera and colleagues have also found that the public tends to focus on personal responsibility when discussing concerns about and the efficacy of psychiatric treatments, including neuromodulation (Cabrera et al., 2018). Taken together, these findings suggest that the public places an emphasis on helping others with cognitive dysfunction, weighing the benefits of treatments equally to or slightly more heavily than the potential harms.
Limitations and Future Directions
It is worth noting some limitations of this study. First, participants were asked to respond as if they were physicians making hypothetical treatment recommendations. However, most of our participants were not physicians. Prior research has shown that participant responses to hypotheticals can differ from how they would act in that real situation (Chang et al., 2009). Future studies should investigate how risk and benefit sensitivity influence real-world choices. By doing so, we can determine whether our task-based measures of risk and benefit sensitivity mediate public opinions, clinician recommendations, and patient preferences about treatments for cognitive dysfunction. We also recommend future research test whether risk and benefit sensitivity varies for decisions made on behalf of oneself rather than others (Arrieta et al., 2017; Garcia-Retamero and Galesic, 2012; Haslam et al., 2020; Medaglia et al., 2019a; Ubel et al., 2011). Examining choices with ambiguity is an important future direction in light of known effects in other decision paradigms and given their ecological validity (see e.g., Attema et al. 2018). Moreover, given that risk and benefit sensitivity can be influenced by cognitive or mood states such as depression, additional research in clinical contexts is warranted (Bayer et al., 2019). The influence of sociocultural, religious, moral, and ideological affiliations on risk and benefit sensitivity could also be examined. Finally, while prior research suggests that well-screened survey data collected via Mechanical Turk can be representative of data acquired in a person (Buhrmester et al., 2011), future in-person studies could test for generalization.
Conclusion
Individuals’ risk and benefit sensitivity may be related to judgments involving cognitive treatments that depend on context-specific mediating factors. This insight broadens the scope of studies on risky decision-making in ethical settings and may have real-world implications in settings where the public are stakeholder in consent to research or clinical procedures. Our work also presents a novel quantitative neuroethics approach for measuring risk and benefit sensitivity when modifying cognitive functions that could inform tensions in informed consent and risk communication. By using quantitative strategies to study judgments and preferences about cognitive treatments, we can begin to develop a mature understanding of ethical judgments regarding the use of technologies to repair and enhance various cognitive functions, with the aim of informing public and professional policy, education, and biomedical interventions.
The reference list from the paper itself. Each links out to its DOI / PubMed record.
- 1Amadio, J., Bi, G.-Q., Boshears, P. F., Carter, A., Devor, A., Doya, K., . . . Singh, I. (2018). Neuroethics questions to guide ethical research in the international brain initiatives. Neuron,100(1), 19–36. 10.1016/j.neuron.2018.09.02110.1016/j.neuron.2018.09.02130308169 · doi ↗ · pubmed ↗
- 2Barr, D. J., Levy, R., Scheepers, C., & Tily, H. J. (2013). Random effects structure for confirmatory hypothesis testing: Keep it maximal. Journal of Memory and Language,68(3). 10.1016/j.jml.2012.11.00110.1016/j.jml.2012.11.001PMC 388136124403724 · doi ↗ · pubmed ↗
- 3Bates, D., Mächler, M., Bolker, B., & Walker, S. (2015). Fitting linear mixed-effects models using lme 4. Journal of Statistical Software,67(1). 10.18637/jss.v 067.i 01
- 4Cravit, R. (2019). How to use color blind friendly palettes to make your charts accessible. https://venngage.com/blog/color-blind-friendly-palette/
- 5Dan, V. (2017). Integrative framing analysis: Framing health through words and visuals. Routledge.
- 6Dinh, C., Humphries, S., & Chatterjee, A. (2020). Public opinion on cognitive enhancement varies across different situations. Psy Ar Xiv. 10.31234/osf.io/ydqru 10.1080/21507740.2020.181179733196348 · doi ↗ · pubmed ↗
- 7Downs, J. S., Holbrook, M. B., Sheng, S., & Cranor, L. F. (2010). Are your participants gaming the system? Screening Mechanical Turk workers. Proceedings of the SIGCHI conference on human factors in computing systems (pp. 2399–2402). New York, NY, USA: Association for Computing Machinery.
- 8Eichler, H.-G., Bloechl-Daum, B., Brasseur, D., Breckenridge, A., Leufkens, H., Raine, J., . . . Rasi, G. (2013). The risks of risk aversion in drug regulation. Nature Reviews Drug Discovery,12(12), 907–916. 10.1038/nrd 412910.1038/nrd 412924232377 · doi ↗ · pubmed ↗