The role of proactive therapeutic drug monitoring in guiding infliximab therapeutic optimization in pediatric patients with Crohn's disease: A retrospective study
Junya Song, Huihui Zhang, Huihua Zhang, Ximing Xu, Xiaohua Liang, Yongfang Liu, Xiaomei Song, Hong Guo, Xue Zhan, Jinlin Song, Xiaoqin Zhou

TL;DR
This study shows that adjusting infliximab treatment intervals based on drug monitoring can improve outcomes in children with Crohn's disease.
Contribution
The study demonstrates that proactive therapeutic drug monitoring can guide treatment optimization in pediatric Crohn's disease patients.
Findings
Shortening treatment intervals increased infliximab trough concentration and improved clinical outcomes.
Factors like hormone exposure and TP levels correlated with infliximab trough concentration.
Endoscopic and clinical remission rates improved after treatment adjustments.
Abstract
Therapeutic drug monitoring (TDM) plays an important role in guiding treatment plan adjustments and clinical outcomes in Crohn's disease. To evaluate the role of TDM‐guided optimization of infliximab dosage in patients with pediatric Crohn's disease. Medical records of patients with pediatric Crohn's disease who were treated with infliximab and had proactive TDM from June 2020 to June 2022 at the Children's Hospital of Chongqing Medical University were included. Baseline influencing factors for infliximab trough concentration (TC) and clinical outcomes before and after the treatment change were analyzed to assess the value of adjusting treatment in the patients. Forty‐six patients (male‐to‐female ratio = 1.55:1, age <18 years) were included. Univariate and multivariate analyses showed that hormone exposure (odds ratio: 0.042, 95% confidence interval: 0.002–0.924, p = 0.044), perianal…
Genes, proteins, chemicals, diseases, species, mutations and cell lines named across the full text — each resolved to its canonical identifier and authoritative record.
Click any figure to enlarge with its caption.
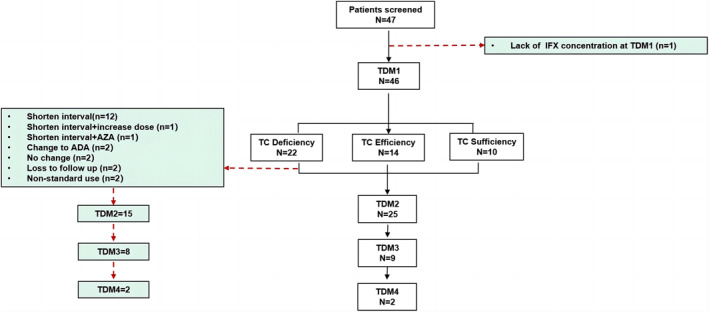 FIGURE 1
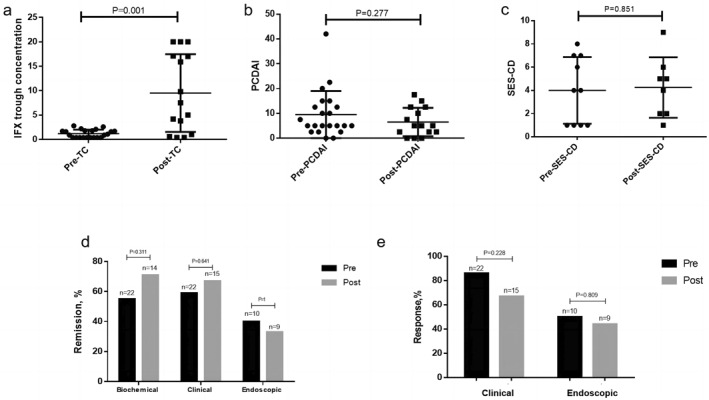 FIGURE 2
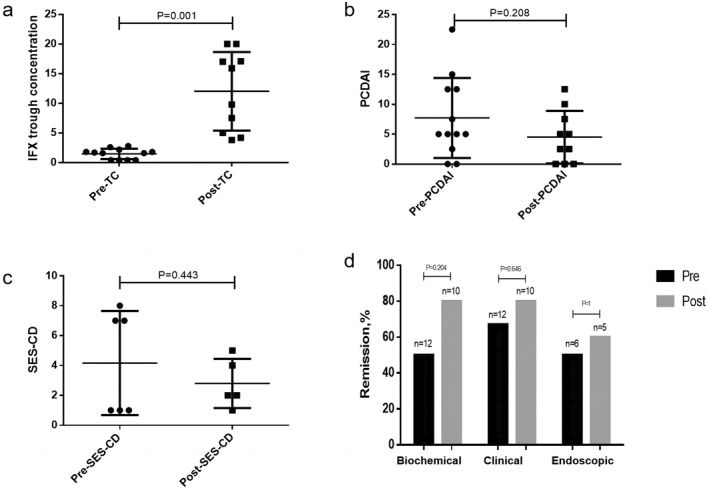 FIGURE 3
| Variables | |
|---|---|
| Number of patients | 46 |
| Age, years (IQR) | 13.42 (11–14.44) |
| Sex, | |
| Female | 18 (39.1) |
| Male | 28 (60.9) |
| Height, cm (mean ± SD) | 149.54 ± 14.64 |
| Weight, kg (mean ± SD) | 33.39 ± 9.08 |
| BMI (IQR), | 14.6 (13.3–15.43) |
| Malnutrition (%) <P10 | 33 (71.7) |
| Moderate nutritional status (%) P10–P75 | 13 (28.3) |
| Superior nutritional status (%) P75–P97 | 0 (0) |
| Overweight to obese (%) >P97 | 0 (0) |
| Time of hospitalization, | |
| 1 | 31 (67.4) |
| 2 | 7 (15.2) |
| 3 | 8 (17.4) |
| History of exposure to biological agents, | |
| Yes | 0 (0) |
| No | 46 (100) |
| Drug exposure, | |
| No | 25 (54.3) |
| Hormone | 2 (4.3) |
| 5‐ASA | 1 (2.2) |
| Others (IMM, etc.) | 18 (39.1) |
| Variables | |
|---|---|
| Diagnosis age, years, | |
| A1a 0–<10 | 10 (21.7) |
| A1b 10–<17 | 35 (76.1) |
| A2 17–40 | 1 (2.2) |
| A3 >40 | 0 (0) |
| Disease extent, | |
| L1 | 3 (6.5) |
| L2 | 3 (6.5) |
| L3 | 27 (58.7) |
| L4a | 0 (0) |
| L4b | 3 (6.5) |
| L3 + L4 | 5 (10.9) |
| L3 + L4b | 5 (10.9) |
| Behavior, | |
| B1 | 21 (45.6) |
| B2 | 23 (50) |
| B3 | 1 (2.2) |
| B2B3 | 1 (2.2) |
| Growth, | |
| G0 | 13 (28.3) |
| G1 | 33 (71.7) |
| Perianal lesions, | |
| No | 30 (65.2) |
| Yes | 16 (34.8) |
| PCDAI (mean ± SD) | 38.73 ± 15.47 |
| Remission, | 2 (4.3) |
| Mild, | 11 (23.9) |
| Moderate, | 9 (19.6) |
| Severe, | 24 (52.2) |
| SES‐CD (mean ± SD) | 6.83 ± 2.29 |
| Proactive TDM, | 46 (100) |
| TDM frequency | |
| TDM1, | 46 (100) |
| TDM2, | 25 (54.35) |
| TDM3, | 9 (19.57) |
| TDM4, | 2 (4.35) |
| Biochemical index | |
| RBC (IQR) | 4.33 (3.89–4.72) |
| Hb (mean ± SD) | 99.48 ± 13.53 |
| Hct (mean ± SD) | 32.52 ± 4.17 |
| WBC (IQR) | 8.39 (7.28–10.56) |
| ANC (IQR) | 5.92 (4.7–7.71) |
| LNC (mean ± SD) | 1.95 ± 0.61 |
| PLT (mean ± SD) | 490.39 ± 183.1 |
| CRP (IQR) | 29 (18.25–39.5) |
| ESR (mean ± SD) | 48.51 ± 26.4 |
| TP (mean ± SD) | 67.58 ± 7.59 |
| ALB (mean ± SD) | 35.9 ± 5.73 |
| PA (IQR) | 30.9 (27.15–34.33) |
| BUN (IQR) | 2.85 (2.3–4.1) |
| Cr (mean ± SD) | 43.47 ± 13.22 |
| UA (mean ± SD) | 236.6 ± 86.11 |
| Parameter | Univariate analysis OR (95% CI) |
| Multivariate analysis OR (95% CI) |
|
|---|---|---|---|---|
| Hormone exposure | 0.181 (0.019–1.691) | 0.134 | 0.042 (0.002–0.924) |
|
| SES‐CD | 1.481 (1.082–2.026) |
| 1.656 (1.065–2.577) |
|
| Age, years | 0.836 (0.655–1.067) | 0.151 | ||
| Behavior, | 0.879 (0.356–2.17) | 0.78 | ||
| Perianal lesions | 3.8 (1.044–13.83) |
| 5.813 (0.984–34.349) | 0.052 |
| Sex (male) | 1.25 (0.381–4.104) | 0.713 | ||
| Growth (G0) | 1.098 (0.303–3.975) | 0.887 | ||
| Height (m) | 0.99 (0.951–1.031) | 0.639 | ||
| Weight (kg) | 0.994 (0.932–1.06) | 0.859 | ||
| BMI (malnutrition) | 0.911 (0.252–3.297) | 0.887 | ||
| PCDAI | 0.998 (0.961–1.037) | 0.924 | ||
| Biochemical index | ||||
| TP | 0.913 (0.835–0.999) |
| 0.851 (0.749–0.967) |
|
| BUN | 0.557 (0.312–0.992) |
| 0.412 (0.153–1.114) | 0.081 |
| PA | 0.903 (0.809–1.008) |
| ||
| RBC | 1.164 (0.609–2.225) | 0.646 | ||
| Hb | 1.026 (0.981–1.073) | 0.262 | ||
| Hct | 1.095 (0.945–1.268) | 0.228 | ||
| WBC | 1.061 (0.915–1.229) | 0.433 | ||
| ANC | 1.062 (0.905–1.246) | 0.46 | ||
| LNC | 1.795 (0.657–4.905) | 0.254 | ||
| PLT | 1 (0.997–1.003) | 0.919 | ||
| CRP | 0.978 (0.943–1.014) | 0.222 | ||
| ESR | 0.995 (0.976–1.015) | 0.649 | ||
| ALB | 0.961 (0.867–1.066) | 0.457 | ||
| Cr | 0.976 (0.932–1.023) | 0.31 | ||
| UA | 1 (0.994–1.007) | 0.889 | ||
| IFX concentration, IQR/ | 1 (0.4–18)/22 |
|---|---|
| Insufficiency, | 22 (100%) |
| ATI at TDM1, | |
| + | 2 (9.1%) |
| ‐ | 20 (90.9%) |
| Treatment adjustment after TDM1, | 16 (72.7%) |
| Shorten the period, | 12 (54.5%) |
| 4w | 6 (27.3%) |
| 5w | 3 (13.6%) |
| 6w | 3 (13.6%) |
| Shorten interval + increase dose | 1 (4.5%) |
| Shorten interval + AZA | 1 (4.5%) |
| Change to ADA | 2 (9.1%) |
| Loss to follow‐up | 2 (9.1%) |
| Non‐standard use | 2 (9.1%) |
| No change | 2 (9.1%) |
| With TDM2, | 15 (68.2%) |
| With TDM3, | 8 (36.4%) |
| With TMD4, | 2 (9.09%) |
- —Science‐Health Joint Medical Scientific Research Project of Chongqing, Young and Middle‐aged Medical Talents Program
- —Chongqing Municipal Education Commission 10.13039/501100007957
Peer Reviews
No public reviews on file for this paper yet. If you reviewed it on a platform where reviews are public (OpenReview, ICLR, NeurIPS, ICML), you can paste yours below so the community can read it here.
Videos
No videos yet. Explain this paper in a talk, walkthrough, or lecture? Add one.
Taxonomy
TopicsInflammatory Bowel Disease · Microscopic Colitis · Eosinophilic Esophagitis
INTRODUCTION
1
Inflammatory bowel diseases (IBDs), including Crohn's disease (CD) and ulcerative colitis, are chronic, relapsing, progressive, and disabling conditions that affect the gastrointestinal tract.1 Patients with pediatric CD (pCD) account for approximately 15%–25% of all CD patients and usually exhibit a more severe phenotype than adults.2, 3, 4 They are more likely to experience malnutrition, impaired growth, reduced quality of life, and a higher risk of later surgery.5, 6, 7
Infliximab (IFX), an anti‐tumor necrosis factor alpha (TNF‐α) monoclonal antibody, is increasingly being used for pCD. According to European Crohn's and Colitis Organization (ECCO) and Chinese Medical Association guidelines,8, 9 IFX is used as a first‐line therapy for children with CD, which has improved treatment efficacy, lowered the rate of surgeries, and reduced utilization of other healthcare resources related to complications or worsening of the disease.10 Although IFX's clinical response (CRe) rate is high, as much as 10%–30% of the patients do not respond to induction therapy (primary loss of response, pLOR), and approximately 50% of initial responders lose response at a later time (secondary LOR, sLOR).8 LOR leads to an increase in disease recurrence, hospitalization, and surgery rates. Thus, optimizing treatment to minimize LOR is of great clinical significance.11
Therapeutic drug monitoring (TDM) of serum trough levels of IFX (TLI) and of antidrug antibodies (ADA) provides objective data to evaluate LOR and guide treatment adjustments. The use of reactive TDM according to disease recurrence, recurrent clinical symptoms, and inflammatory index activity is more common than proactive TDM.12 However, routine or proactive TDM has greater guiding value than reactive TDM, irrespective of target concentration range, lower risk of ADA, therapeutic outcomes, cost‐effectiveness, or cost‐saving.13, 14, 15, 16, 17, 18 In children, increased disease severity and substantial interpatient variability in pharmacokinetic parameters drive an even greater need for proactive TDM.8, 19 TDM‐guided IFX dose intensification is also associated with a higher rate of composite sustained greater treatment persistence, corticosteroid‐free clinical remission (CR), normal C‐reactive protein (CRP), and normal fecal calprotectin.20, 21, 22
In this study, we aimed to investigate the use of proactive TDM in pCD with IFX and its use in guiding dose intensification and efficacy evaluation.
METHODS
2
Population and research design
2.1
This retrospective study included patients from the Department of Gastroenterology at the Children's Hospital of Chongqing Medical University from June 2020 to June 2022. We first analyzed all patients who underwent TDM during the study period and included 47 patients according to the following criteria. The pCD diagnostic criteria were set according to expert consensus and guidelines on the diagnosis and management of pediatric IBD.8, 9 Proactive TDM was defined as measuring TLI and ADA levels at the end of induction without pLOR or maintenance without sLOR. Reactive TDM is defined as performing TDM at the time of the disease's active stage, pLOR, or sLOR.23 The inclusion criteria were hospitalization with a definite diagnosis of CD according to ECCO and Chinese guidelines8, 9; IFX used as induction and maintenance therapy; IFX induction at 0, 2, and 6 weeks, and maintenance at every 8 weeks, at a dose of 5–10 mg/kg according to weight; and at least one proactive TDM during maintenance. The exclusion criteria were children with undiagnosed CD, non‐standard IFX use, reactive TDM, or no TDM.
The retrospective clinical data of patients with pCD were collected by chart review from electronic medical records. The general demographic data (including age, sex, height, weight, and body mass index [BMI]) and clinical indicators (including the Paris classification of disease diagnosis phenotype,24 pCD activity index [PCDAI], simplified endoscopic score for CD [SES‐CD], and biochemical blood indexes) of patients using IFX for the first time were included. Additionally, the clinical data and disease outcome assessments corresponding to each TDM were included. TDM‐guided treatment optimization was defined as treatment adjustment according to the previous TDM results.
Classifications and definitions
2.2
Based on the ECCO and China consensus on pCD,8, 9 PCDAI <10 was classified as remission or quiescent stage, 10–27.5 as mild activity stage, 30–37.5 as moderate stage, and >40 as severe stage.
TDM was performed before subsequent IFX infusion. The IFX concentration was determined using a fluorescence immunochromatography IFX detection kit (Suzhou Herui BioMed Co., Ltd.) at the Suzhou Herui IBD Diagnostic Technology Research Center. Concentrations <3 μg/mL were considered insufficient, 3.1–7 μg/mL as efficient, and >7 μg/mL as sufficient.25 An antibody to IFX (ATI) level <30 ng/mL was defined as negative.26 The ATI detection kit (Suzhou Herui BioMed Co., Ltd.) is a quantitative fluorescence immunochromatographic assay tool.
Biological remission was defined as CRP ≤8 mg/L and erythrocyte sedimentation rate (ESR) ≤20 mm/h.27 CR was defined as PCDAI <10, and PCDAI CRe was defined as a decrease in PCDAI ≥15 from baseline and a total score of ≤30.28, 29, 30 Endoscopic remission (ER) was defined as SES‐CD ≤2, and endoscopic response (ERe) was defined as a reduction of at least 2 points and a reduction of at least 50% in the SES‐CD from the initial score.31, 32, 33
Statistical analyses
2.3
All statistical tests were performed using SPSS software version 25.0 (SPSS, Chicago, IL, USA) and GraphPad Prism version 5 (GraphPad Software, San Diego, CA, USA). For quantitative variables, data are shown as mean ± standard deviation (SD) or as median and interquartile range (IQR), according to the presence or absence of a normal distribution. Categorical variables are expressed as percentages. Independent continuous variables were compared using the Student's t‐test and Mann–Whitney U test, whereas dependent continuous variables were compared using the paired t‐test and Wilcoxon signed‐rank test. Categorical variables were compared using the chi‐square test and rank‐sum test. A multivariable binary logistic regression was performed to determine the independent effects of variables associated with IFX trough levels, including statistically significant variables from univariate analysis, based on the backward selection method. P‐values <0.05 in the final multivariate model were considered significant.
RESULTS
3
Demographic and clinical characteristics
3.1
Patient inclusion and overall experimental design are shown in Figure 1. Forty‐six pediatric patients with CD (average age: 13.42 years, age range: 11–14.44 years) were enrolled, including 28 males and 18 females, with a male‐to‐female ratio of 1.55:1. The patients' height and weight (mean ± SD) were 149.54 ± 14.64 cm and 33.39 ± 9.08 kg, respectively, and their BMI (median (IQR)) was 14.6 (13.3–15.43). The malnutrition rate was 71.7%. When IFX was used for the first time, 67.4% of patients had been hospitalized once, 15.2% twice, and 17.4% three times. None of the 46 patients had ever used biological agents; 54.3% had no history of previous drug exposure, and the rates of previous exposure to hormones, 5‐ASA, and other drugs (including immunosuppressive agents) were 4.3%, 2.2%, and 39.1%, respectively (Table 1).
Flow diagram. One patient lacked IFX concentration at TDM1, but had other results at TDM1, including ATI, and also had IFX concentration at TDM2 and TDM3. ADA, adalimumab; IFX, infliximab; TC, trough concentration; TDM, therapeutic drug monitoring.
Early onset disease with Paris classification A1a (<10 years old) and A1b (10–17 years old) accounted for 21.7% and 76.1% of patients, respectively. The disease extent was L1 in 6.5% of patients, L2 in 6.5%, L3 in 58.7%, L4b in 6.5%, L3 + L4 in 10.9%, and L3 + L4b in 10.9%. The disease behaviors of B1, B2, B3, and B2B3 accounted for 45.7%, 50%, 2.2%, and 2.2%, respectively. The growth retardation rate was 71.7%, and the perianal disease positivity rate was 34.8%. The PCDAI was 38.73 ± 15.47 before the first administration of IFX, 4.3% at the remission stage, 23.9% at the mild stage, 19.6% at the moderate stage, and 52.2% at the severe stage. The SES‐CD was 6.83 ± 2.29. Regarding the frequency of TDM monitoring, proactive TDM1 was 100%, proactive TDM2 was 54.35%, proactive TDM3 was 19.57%, and proactive TDM4 was 4.35%. In terms of biochemical indicators, blood routine indicators included red blood cell count (RBC; ×1012/L): 4.33 (3.89–4.72), hemoglobin levels (Hb; g/L): 99.48 ± 13.53, hematocrit (Hct; %): 32.52 ± 4.17, white blood cell count (WBC; ×109/L): 8.39 (7.28–10.56), neutrophil count (Neut#; ×109/L): 5.92 (4.7–7.71), lymphocyte count (Lymph#; ×109/L): 1.95 ± 0.61, platelet count (PLT; ×109/L): 490.39 ± 183.1, inflammatory index ESR (mm/hr): 48.51 ± 26.4, and CRP (mg/L): 29 (18.25–39.5). Liver and kidney function test results were as follows: total protein (TP; g/L): 67.58 ± 7.59, albumin (ALB; g/L): 35.9 ± 5.73, prealbumin (PA; mg/L): 30.9 (27.15–34.33), blood urea nitrogen (BUN; mmol/L): 2.85 (2.3–4.1), creatine (Cr; µmol/L): 43.47 ± 13.22, and uric acid (UA; µmol/L): 236.6 ± 86.11 (Table 2).
Proactive trough concentration monitoring analysis
3.2
In total, 46 patients with initial TDM results were included in the analysis. According to the trough concentration (TC) (IQR), they were divided into insufficient (1 [0.4–18], n = 22), efficient (4.15 [3.8–4.95], n = 14), and sufficient (11.5 [9.5–19.775], n = 10) groups. The difference was statistically significant (p < 0.001). Anti‐infliximab antibody (ATI) analysis showed that four cases were ATI‐positive, all in the insufficient concentration group (ATI‐negative rate 81.8%); the ATI‐negative rate in the efficient and sufficient groups was 100%. At TDM1 monitoring, the IFX usage time (IQR) was 4.5 (4–9.25), 4.5 (4–10), and 4 (3.75–5), p = 0.235 in the insufficient, efficient, and sufficient groups, respectively. The PCDAI scores were 5 (4.38–13.13), 10 (5–12.5), and 5 (0–7.5) in the insufficient, efficient, and sufficient groups, respectively (p = 0.116). According to the PCDAI score, the proportions of the three groups achieving remission were 59.1%, 50%, and 80%; mild activity was 50%, 36.4%, and 20%, respectively; and severe activity was 4.5% in the insufficient group. Twenty‐one patients completed endoscopic evaluation at TDM1, including 10 patients in the insufficient group (SES‐CD score 4 [1–7]), 8 patients in the efficient group (3 [0–3]), and 3 patients in the sufficient group (6 [3–8]) p = 0.181); biochemical response rate (80%), CR rate (80%), and CRe rate (100%) were the highest in the sufficient group. The ERe rates were 50%, 87.5%, and 33.3% in the three groups. The mucosal healing rate was 37.5% in the efficient group (Table S1).
To identify the baseline factors affecting the TLI at TDM1, patients were divided based on IFX TC into sufficient (including efficient group) and insufficient level groups. Baseline data, including age, sex, weight, height, BMI, hormone exposure, SES‐CD, PCDAI, disease diagnosis data, perianal lesions, and biochemical parameters, were analyzed using a univariate analysis. SES‐CD (p = 0.014), perianal lesions (p = 0.043), TP (p = 0.048), BUN (p = 0.047), and PA (p = 0.07) were correlated with TLI levels. Furthermore, by including indicators with p < 0.15 in the univariate analysis, the multivariate analysis showed that hormone exposure (odds ratio [OR] = 0.042, 95% confidence interval [CI]: 0.002–0.924, p = 0.044), SES‐CD (OR = 1.656, 95% CI: 1.065–2.577, p = 0.025), perianal lesions (OR = 5.813, 95% CI: 0.984–34.349, p = 0.052), and TP (OR = 0.851, 95% CI: 0.749–0.967, p = 0.014) were correlated with TC levels (Table 3).
Analysis of proactive TDM‐guided treatment optimization
3.3
Of the 22 cases with insufficient TC by TDM1 monitoring, 16 cases (72.7%) had their infliximab treatment adjusted. 12 cases (54.5%) had their treatment interval shortened, 1 case (4.54%) had shortened treatment interval + increased dose, 1 case (4.54%) had shortened treatment interval + azathioprine, and 2 cases (9.1%) were switched to adalimumab. Two (9.1%) patients were lost to follow‐up, two (9.1%) did not continue on standard treatment, and two (9.1%) did not accept treatment adjustment (Table 4).
The 22 patients were followed up, and proactive TDM monitoring showed that 15 patients had TDM2 (68.2%), 8 patients had TDM3 (36.4%), and 2 patients had TDM4 (9.09%). After treatment adjustment under the guidance of TDM1, concentration increased from 1 (0.4–18) at TDM1 to 6.05 (1.15–15) at TDM2 but decreased to 3.55 (0.4–12.075) at TDM3 and 3.75 (∼2.5) at TDM4 (Figure S1). TDM1 and TDM2 were used as evaluation time points before and after the treatment change. The interval between TDM1 and TDM2 was 93.9 ± 37.47 days. After the treatment change, the concentration increased (p = 0.001), PCDAI (p = 0.277) decreased, biochemical remission (p = 0.311), CR (p = 0.641), and ER rates increased (p = 1); SES‐CD (p = 0.851), CRe rate (p = 0.228), and ERe rate (p = 0.809) did not show a changing trend (Figure 2).
Effects of therapeutic adjustment on clinical outcomes. (A) IFX concentration before and after treatment adjustment. (B) PCDAI results before and after treatment adjustment. (C) SES‐CD before and after treatment adjustment. (D) Biochemical remission, clinical remission, and endoscopic remission rates before and after treatment adjustment. (E) Clinical response rate, and endoscopic response rate before and after treatment adjustment. PCDAI, pediatric Crohn's disease activity index; SES‐CD, simplified endoscopic scoring for Crohn's disease; TC, trough concentration.
Twelve patients with shortened treatment intervals were analyzed, including 10 who underwent TDM2 concentration monitoring. Shortening the interval increased the TC (1.69 ± 0.8 vs. 12.03 ± 6.64, p < 0.001) and decreased the PCDAI (6.5 ± 5.3 vs. 4.5 ± 4.38, p = 0.208) and SES‐CD (4.5 ± 4.95 vs. 1.5 ± 0.71, p = 0.443). The rates of biochemical remission (50% vs. 80%, p = 0.20), CR (66.7% vs. 80%, p = 0.65), ER (50% vs. 60%, p = 1), and ERe (50% vs. 80%, p = 0.54) improved (Figure 3).
Effects of shortening treatment interval on clinical outcome. (A) IFX concentration before and after shortening treatment interval. (B) PCDAI before and after shortening treatment interval. (C) SES‐CD before and after shortening treatment interval. (D) Biochemical remission, clinical remission, and endoscopic remission rates before and after shortening treatment interval. PCDAI, pediatric Crohn's disease activity index; SES‐CD, simplified endoscopic scoring for Crohn's disease; TC, trough concentration.
DISCUSSION
4
An analysis of the demographic characteristics and clinical indicators revealed that the overall nutritional status of the included patients was poor and that disease activity status was mainly in a state of severe activity at the time of the first IFX treatment.
TDM has emerged as one of the most sought‐after objective tools for assessing the therapeutic efficacy of biologics (in particular, anti‐TNF‐α) and immunomodulators in IBD.34, 35 Herein, we enrolled patients with proactive TDM; an analysis of the factors that influence IFX TC indicated that hormone exposure, SES‐CD, perianal lesions, and TP levels during the first IFX use affected TC levels. In the optimization of proactive TDM‐driven treatment changes, shortening the treatment interval is a common choice for pediatricians, which can improve drug serum levels, reduce PCDAI, and improve the treatment efficacy. However, the maintenance effect of concentration may not be good. The sample size and follow‐up time should be further expanded to evaluate long‐term effects.
Proactive TDM utilizes the regular measurement of drug trough concentrations and ADAs with dose adaptation to target an appropriate drug TC.36 Preliminary research data found that proactive TDM of IFX can provide safer and more objective dose adjustments than empirical dose optimization or reactive TDM.37, 38 However, a lack of consistency in evidence still challenges proactive TDM in managing IBD therapy. When and how often monitoring should be used to reflect the role of the guiding function in treatment adjustment is under‐investigated.
We enrolled patients with pCD treated with IFX under proactive TDM. The relationship between IFX TC in TDM monitoring and the clinical treatment effect was analyzed according to the matched clinical data of each TDM. Patients with sufficient TCs had the highest biochemical remission, CR, and CRe rates at TDM1. Although this difference was not statistically significant, a trend was observed. Many studies have reported an association between serum IFX levels and clinical outcomes in IBD.28, 39, 40 A systematic review and meta‐analysis including 22 studies showed that a trough threshold >2 μg/mL during maintenance is associated with a greater probability of CR and mucosal healing.41 Children with clinical or ER had significantly higher IFX exposure during maintenance therapy.27
Furthermore, we analyzed which baseline factors influence TC to guide clinical practice. Univariate and multivariate analyses indicated that hormone exposure, SES‐CD, perianal lesions, and TP at baseline before the first use of IFX were correlated with IFX TC level at TDM1; the difference was statistically significant. Similar results have been reported in other research groups. A repeated‐measures study including adult patients with IBD revealed associations between ATI, serum albumin concentration, concomitant immunosuppressive therapy, body weight, sex, and IFX TC.42 BMI, concomitant use of immunomodulators, rates of side effects, and laboratory markers, including serum albumin and CRP, are significantly associated with anti‐TNF‐α trough levels in IBD patients.43
Twenty‐two cases had insufficient TC by TDM1 monitoring, among which 16 (72.7%) had treatment adjustment, including 12 (54.5%) cases of shortened treatment interval. The impact of TDM on clinical decision‐making for children receiving IFX for IBD is a meaningful topic. A previous study on IBD in children reported that TDM‐based IFX optimization improved clinical outcomes and that shortening dosage interval resulted in better IFX concentration than dose optimization.44 Deora et al. also found that TDM‐based treatment changes resulted in a significant clinical improvement.45 However, there are relatively few reports on proactive TDM‐guided treatment adjustment and dynamic TDM evaluation. In this study, pediatricians were more inclined to choose the shortened interval regimen when the concentration was insufficient. In this study, we also used several other program adjustments, such as shortening the treatment interval + increasing the dose, shortening the treatment interval + azathioprine, and switching biological agents to ADA. Due to the small sample size, we could not compare different protocols; however, these protocol adjustments might better improve the concentration. Switching to ADA was effective in the follow‐up of both cases. Dynamic TDM was performed in 22 patients, with 15 receiving TDM2, 8 receiving TDM3, and 2 receiving TDM4. By analyzing the concentration dynamics, we found that TDM2 concentration increased (6.05 [1.15–15]); however, TDM3 (3.55 [0.4–12.075]) and TDM4 (3.75 [∼2.5]) concentrations decreased, indicating that the increased concentration may not be maintained in the long term. Furthermore, 12 patients with TDM‐guided shortened intervals were analyzed, and 10 had TDM2 (the interval between TDM1 and TDM2 was about 90 days). Clinical evaluation before and after interval shortening suggested that the adjustment of the interval shortening protocol could improve the concentration level, reduce PCDAI and SES‐CD, and improve the biochemical response, CRe, and ERe rates after 3 months. However, the sample size needs to be expanded for further evaluation. To our knowledge, clinical studies on optimal IFX treatment guided by TDM for children with CD are limited. Lega et al. reported that proactive TDM might improve IFX durability by maintaining higher IFX concentrations during maintenance.46 A review of IFX use in adult patients with perianal fistulizing CD indicated that the optimal timing of IFX use was highly individualized.47 Therefore, further clinical research on scheme optimization based on TDM guidance is of clinical value.
The strengths of this research include proactive TDM‐based treatment optimization, dynamic, proactive TDM monitoring, and pre‐and post‐treatment effect evaluation. The small sample size and retrospective design are the major limitations of this study. Moreover, inter‐group comparison between different optimization protocols cannot be conducted. Additionally, data retrieval under the set inclusion criteria does not reflect the real situation of all patients. Further, short follow‐up time and lack of a control cohort are other limitations. Future investigations with a larger sample size and long‐term follow‐up are warranted. Further prospective large‐sample clinical studies implementing natural outcome control, superposition of different optimization schemes, and switching biological drugs, would provide a more comprehensive approach and better guidance for clinical practice.
CONCLUSION
5
Hormone exposure, SES‐CD, perianal lesions, and TP levels during the first IFX use were factors that affected TC. The shortened interval adjustment guided by proactive TDM can improve IFX concentration and biochemical remission, CR, and ER rates after 3 months. However, the long‐term maintenance effect of the concentration may require further study, long‐term follow‐up, and evaluation of health and economic value.
AUTHOR CONTRIBUTIONS
The authors confirm contribution to the paper as follows: study conception and design: Xiaoqin Zhou, Jinlin Song; data collection: Junya Song, Huihui Zhang, Huihua Zhang, Xue Zhan, Xiaomei Song, Hong Guo; interpretation of results: Junya Song, Huihui Zhang, Xiaoqin Zhou; manuscript preparation: Junya Song, Huihui Zhang, Xiaoqin Zhou, Huihua Zhang, Ximing Xu, Xiaohua Liang, Yongfang Liu, Xue Zhan. All authors contributed to the article and approved the submitted version.
CONFLICT OF INTEREST STATEMENT
The authors declare that the research was conducted in the absence of any commercial or financial relationships that could be construed as a potential conflict of interest.
ETHICS STATEMENT
This study was approved by the Ethics Committee of the Children's Hospital of Chongqing Medical University and Chongqing General Hospital (approval no. 2023 (169), KY S2022‐023‐01). Written informed consent was obtained from all patients and their parents.
Supporting information
Supporting Information S1
The reference list from the paper itself. Each links out to its DOI / PubMed record.
- 1Alkhatry M , Al‐Rifai A , Annese V , et al. First United Arab Emirates consensus on diagnosis and management of inflammatory bowel diseases: a 2020 Delphi consensus. World J Gastroenterol. 2020;26(43):6710‐6769.33268959 10.3748/wjg.v 26.i 43.6710 PMC 7684461 · doi ↗ · pubmed ↗
- 2Rosen MJ , Dhawan A , Saeed SA . Inflammatory bowel disease in children and adolescents. JAMA Pediatr. 2015;169(11):1053‐1060.26414706 10.1001/jamapediatrics.2015.1982 PMC 4702263 · doi ↗ · pubmed ↗
- 3Van Limbergen J , Haskett J , Griffiths AM , et al. Toward enteral nutrition for the treatment of pediatric Crohn disease in Canada: a workshop to identify barriers and enablers. Can J Gastroenterol Hepatol. 2015;29(7):351‐356.26076398 10.1155/2015/509497 PMC 4610644 · doi ↗ · pubmed ↗
- 4Cosnes J , Cattan S , Blain A , et al. Long‐term evolution of disease behavior of Crohn’s disease. Inflamm Bowel Dis. 2002;8(4):244‐250.12131607 10.1097/00054725-200207000-00002 · doi ↗ · pubmed ↗
- 5Hill R , Lewindon P , Muir R , et al. Quality of life in children with Crohn disease. J Pediatr Gastroenterol Nutr. 2010;51(1):35‐40.20410845 10.1097/MPG.0b 013e 3181 c 2c 0ef · doi ↗ · pubmed ↗
- 6Van Limbergen J , Russell RK , Drummond HE , et al. Definition of phenotypic characteristics of childhood‐onset inflammatory bowel disease. Gastroenterology. 2008;135(4):1114‐1122.18725221 10.1053/j.gastro.2008.06.081 · doi ↗ · pubmed ↗
- 7Kelsen J , Baldassano RN . Inflammatory bowel disease: the difference between children and adults. Inflamm Bowel Dis. 2008;14(Suppl l l_2):S 9‐S 11.18816756 10.1002/ibd.20560 · doi ↗ · pubmed ↗
- 8van Rheenen PF , Aloi M , Assa A , et al. The medical management of paediatric Crohn’s disease: an ECCO‐ESPGHAN guideline update. J Crohns Colitis. 2020:jjaa 161.33026087 10.1093/ecco-jcc/jjaa 161 · doi ↗ · pubmed ↗