Author Correction: Deglacial release of petrogenic and permafrost carbon from the Canadian Arctic impacting the carbon cycle
Junjie Wu, Gesine Mollenhauer, Ruediger Stein, Peter Köhler, Jens Hefter, Kirsten Fahl, Hendrik Grotheer, Bingbing Wei, Seung-Il Nam

Abstract
Genes, proteins, chemicals, diseases, species, mutations and cell lines named across the full text — each resolved to its canonical identifier and authoritative record.
Click any figure to enlarge with its caption.
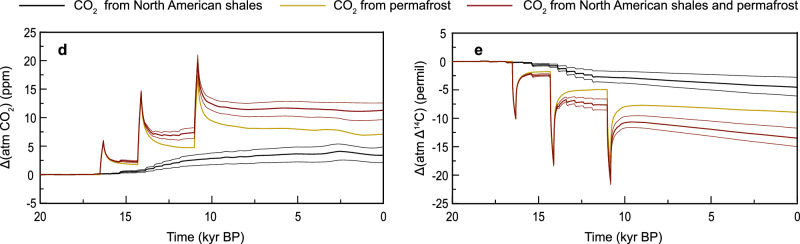 Figure 1
Peer Reviews
No public reviews on file for this paper yet. If you reviewed it on a platform where reviews are public (OpenReview, ICLR, NeurIPS, ICML), you can paste yours below so the community can read it here.
Videos
No videos yet. Explain this paper in a talk, walkthrough, or lecture? Add one.
Taxonomy
TopicsClimate change and permafrost · Atmospheric and Environmental Gas Dynamics
Correction to: Nature Communications 10.1038/s41467-022-34725-4, published online 22 November 2022
In the version of the article initially published, due to an error in source files, the model presented in Fig. 5d, e overestimated emissions. In the Abstract, in the sentence now reading “Assuming extensive petrogenic organic carbon oxidation during the glacial retreat, a model-based assessment suggests that the combined processes have contributed 8 ppm to the deglacial CO_2_ rise,” 8 ppm replaces “12 ppm.” In the eleventh paragraph of the Discussion, values in the text have been updated to read “These events include a first CO_2_ peak of 3 ppm at 16.5 cal. kyr BP and two more CO_2_ peaks of ~6 ppm at 14.6 and 11.5 cal. kyr BP (Fig. 5d). These permafrost carbon release pulses lead in the model to a decrease in Δ14C of ~5 permil at 16.5 cal. kyr BP and of ~7–8 permil at 14.6 cal. kyr BP and 11.5 cal. kyr BP (Fig. 5e)….. The simulated long-term effects over the last 20 kyrs when combining both processes are an increase in atmospheric CO_2_ by 8 ppm and a decrease in atmospheric Δ14C by 9 permil (Figs. 5d, e), explaining 10% and 2%, respectively, of the reconstructed changes in both variables.” The paragraph previously read “These events include a first CO_2_ peak of 6 ppm at 16.5 cal. kyr BP and two more CO_2_ peaks of ~12 ppm at 14.6 and 11.5 cal. kyr BP (Fig. 5d). These permafrost carbon release pulses lead in the model to a decrease in Δ14C of ~10 permil at 16.5 cal. kyr BP and of ~13–15 permil at 14.6 cal. kyr BP and 11.5 cal. kyr BP (Fig. 5e)…. The simulated long-term effects over the last 20 kyrs when combining both processes are an increase in atmospheric CO_2_ by 12 ppm and a decrease in atmospheric Δ14C by 12 permil (Figs. 5d, e), explaining 13% and 3%, respectively, of the reconstructed changes in both variables.”
Panels in Fig. 5d, e have now been replaced; for comparison, the original Fig. 5d, e panels are shown as Fig. 1, below. The changes to figures and text are made in the HTML and PDF versions of the article.
Fig. 1 Original Fig. 5d, e.