Clinical characteristics, clinical laboratories, and risk factors of elderly patients with chronic obstructive pulmonary disease complicated with pulmonary embolism
Chunhua Jin, Yanping Hu, Fang Liu

TL;DR
This study explores how often elderly COPD patients develop pulmonary embolism and identifies risk factors like age and blood markers that could help predict it.
Contribution
The study identifies RDW as a potential predictive biomarker for PE in elderly COPD patients.
Findings
12.63% of elderly COPD patients had pulmonary embolism.
RDW-SD values were significantly higher in COPD patients with PE.
RDW-SD has a predictive accuracy of 0.723 for PE in COPD patients.
Abstract
The objective of this research is to examine the occurrence, clinical manifestations, and determinants of pulmonary embolism (PE) in older individuals diagnosed with chronic obstructive pulmonary disease (COPD). A retrospective analysis was performed on elderly patients diagnosed with COPD, who were admitted to five different hospitals within our province. These patients were categorized into two groups based on the presence or absence of pulmonary embolism (PE). And systematically compile and examine the foundational data, clinical attributes, and pertinent laboratory parameters outlined in their respective medical records. These encompass blood routine, arterial blood gas analysis, coagulation markers, and biochemical indicators. A total of 958 elderly patients with COPD were included in the study. Among them, 121 patients (12.63%) were found to have complications with PE. During…
Genes, proteins, chemicals, diseases, species, mutations and cell lines named across the full text — each resolved to its canonical identifier and authoritative record.
Click any figure to enlarge with its caption.
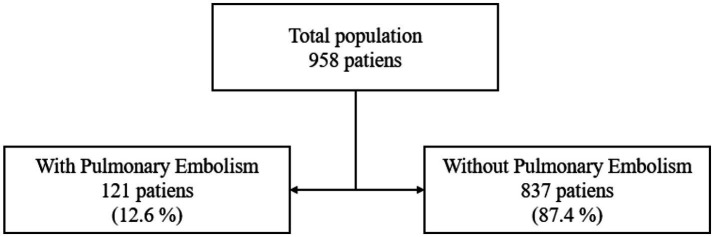 Figure 1
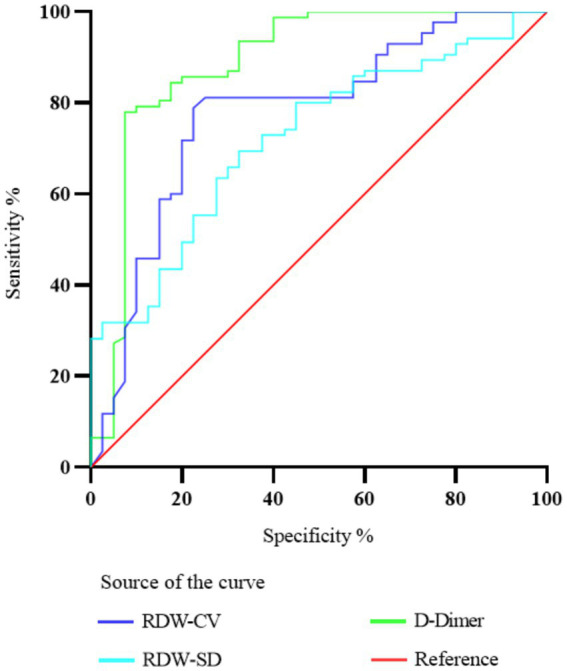 Figure 2
| Total population | COPD with PE | COPD without PE |
| |||||
|---|---|---|---|---|---|---|---|---|
|
| % |
| % |
| % | |||
|
| 958 | 100.0 | 121 | 100.0 | 837 | 100.0 | ||
| Age (Mean ± SD, years) | 75.4 (7.6) | 78.6 (7.7) | 74.9 (7.4) | 5.08 | <0.001 | |||
| Sex - Men | 628 | 65.6 | 61 | 50.4 | 567 | 67.7 | 14.06 | <0.001 |
| Recent bed rest ≥3 days | 238 | 24.8 | 41 | 33.9 | 197 | 23.5 | 6.06 | 0.01 |
| Recent surgery | 32 | 3.3 | 7 | 5.8 | 25 | 3.0 | 2.56 | 0.11 |
| Previous venous thromboembolism | 86 | 9.0 | 20 | 16.5 | 66 | 7.9 | 9.66 | 0.002 |
| Malignant tumor | 192 | 20.0 | 17 | 14.0 | 175 | 20.9 | 3.10 | 0.08 |
| Heart failure | 104 | 10.9 | 17 | 14.0 | 87 | 10.4 | 1.46 | 0.23 |
| Diabetes Mellitus | 158 | 16.5 | 16 | 13.2 | 142 | 17.0 | 1.08 | 0.30 |
| Hypertension | 247 | 25.8 | 41 | 33.9 | 206 | 24.6 | 4.75 | 0.03 |
| Atrial fibrillation | 97 | 10.1 | 14 | 11.6 | 83 | 9.9 | 0.32 | 0.57 |
| Coronary Artery Disease | 183 | 19.1 | 28 | 23.1 | 155 | 18.5 | 1.46 | 0.23 |
| Stroke | 74 | 7.7 | 11 | 9.1 | 63 | 7.5 | 0.36 | 0.55 |
| Inflammatory bowel disease | 6 | 0.6 | 0 | 0.0 | 6 | 0.7 | 0.87 | 0.35 |
| Renal failure | 66 | 6.9 | 10 | 8.3 | 56 | 6.7 | 0.41 | 0.52 |
| Liver cirrhosis | 20 | 2.1 | 1 | 0.8 | 19 | 2.3 | 1.08 | 0.30 |
| At-home O2 therapy | 215 | 22.4 | 20 | 16.5 | 195 | 23.3 | 2.78 | 0.10 |
| Oral anticoagulation | 89 | 9.3 | 9 | 7.4 | 80 | 9.6 | 0.56 | 0.45 |
| Antiplatelet therapy | 347 | 36.2 | 49 | 40.5 | 298 | 35.6 | 1.10 | 0.30 |
| purulent sputum | 230 | 24.0 | 20 | 16.5 | 210 | 25.1 | 4.27 | 0.04 |
| Clinical signs of deep venous thrombosis | 81 | 8.5 | 30 | 24.8 | 51 | 6.1 | 47.76 | <0.001 |
| SpO2 < 90 mmHg or O2 therapy | 535& | 58.0 | 70 | 60.9 | 465 | 57.5 | 0.23 | 0.63 |
| At least one abnormal ECG indicates pulmonary embolism | 187&& | 19.6 | 32 | 26.4 | 155 | 18.7 | 4.23 | 0.04 |
| pCO2 < 40 mmHg | 414&&& | 48.2 | 66 | 60.0 | 348 | 46.5 | 8.35 | 0.004 |
| pH > 7.45 | 255&&& | 29.7 | 38 | 34.5 | 217 | 29.0 | 1.43 | 0.23 |
| Normal chest X-ray | 182&&&& | 21.1 | 36 | 35.0 | 146 | 19.3 | 13.39 | <0.001 |
| Parameters | COPD with PE | COPD without PE | |
|---|---|---|---|
| WBC (×109/l) | 8.41 (5.69–10.87) | 8.26 (6.3–10.31) | 0.961 |
| RBC (×1012/l) | 4.18 ± 0.67 | 4.50 ± 0.57 | 0.031 |
| HB (g/l) | 124.89 ± 17.50 | 135.07 ± 18.12 | 0.006 |
| HCT (%) | 37.5 (35.05–42.05) | 41.5 (37.9–45.3) | 0.013 |
| MCV (fl) | 92.78 ± 7.13 | 92.66 ± 5.04 | 0.789 |
| MCH (Pg) | 29.87 ± 2.50 | 30.14 ± 1.73 | 0.769 |
| MCHC (g/l) | 321.60 ± 15.91 | 321.55 ± 10.70 | 0.894 |
| PLT (×109/l) | 162.9 (131.6–247) | 209 (175–256) | 0.010 |
| RDW-SD (fl) | 48.8 (43.7–52.37) | 43.9 (41.0–45.2) | < 0.001 |
| RDW-CV (%) | 14.8 (12.78–15.37) | 12.8 (12.0–13.9) | < 0.001 |
| PDW (fl) | 12.05 (11.0, 13.8) | 11.3 (9.6–13.4) | 0.059 |
| MPV (fl) | 10.66 ± 1.41 | 9.67 ± 1.09 | 0.025 |
| PCT (%) | 0.19 (0.14–0.28) | 0.22 (0.19–0.26) | 0.045 |
| P-LCR (%) | 28.79 ± 9.49 | 25.60 ± 8.11 | 0.062 |
| EO (×109/l) | 0.03 (0.01–0.09) | 0.08 (0.02–0.19) | 0.001 |
| NEUT (%) | 79.4 (75.26–85.21) | 75.1 (69.4–83.4) | 0.015 |
| LYM (%) | 12.44 (8.14–15.44) | 15.69 (10.0–20.9) | 0.035 |
| MONO (%) | 6.39 (4.89–8.31) | 6.5 (5.3–8.3) | 0.370 |
| EO (%) | 0.64 (0–1.14) | 1.1 (0.4–2.5) | 0.010 |
| ALB (g/l) | 35.5 (33.8–38.8) | 38.9 (35.0–41.4) | < 0.001 |
| ALT (μ/l) | 24 (13–33.7) | 14 (9–19) | < 0.001 |
| AST ( | 18.4 (14.4–30.4) | 17 (12–18) | < 0.001 |
| LDH-L (μ/l) | 238.0 (194.0–277.0) | 176 (155–202) | < 0.001 |
| CHOL (mmol/l) | 4.42 (3.51–4.75) | 4.21 (3.71–5.2) | 0.394 |
| TG (mmol/l) | 1.34 (0.96–1.56) | 1.16 (0.78–1.48) | 0.065 |
| CREA (μmol/l) | 59.0 (51–87.34) | 58.6 (54–74) | 0.932 |
| UA (μmol/l) | 238.2 (172–374.90) | 245 (211–327.6) | 0.879 |
| PH | 7.46 (7.5–7.57) | 7.53 (7.51–7.56) | 0.328 |
| SO2 (%) | 92.4 (88.54–96.34) | 95.69 (93.38–97.4) | 0.003 |
| PO2 (mmHg) | 64.36 (52.9–77.2) | 73.3 (64.4–75.1) | 0.005 |
| PCO2 (mmHg) | 42.3 (35.9–52.5) | 43.5 (41–50.9) | 0.343 |
| Lac (mmol/l) | 1.76 (1.34–2.34) | 1.56 (1.1–1.95) | 0.033 |
| PT (sec) | 13.9 (13.0, 15.2) | 13.1 (12.8, 14.0) | 0.009 |
| APTT (sec) | 36.9 (31.1–41.9) | 36.2 (32.6–38.6) | 0.811 |
| TT (sec) | 16.8 (15.54–19.65) | 16.6 (15.7–17.5) | 0.316 |
| FIB (g/l) | 3.65 (2.32–5.17) | 4.74 (3.5–5.95) | 0.002 |
| D-Dimer (μg/ml) | 2.61 (1.86–9.14) | 0.43 (0.30–0.73) | < 0.001 |
| Univariate | Multivariate | |||
|---|---|---|---|---|
| Adjusted OR | 95% CI | Adjusted OR | 95% CI | |
| Age (Mean ± SD, years) | 1.06 | 1.03;1.08# | 1.04 | 1.02;1.07# |
| Sex - Men | 0.50 | 0.35;0.71# | 0.41 | 0.27;0.64# |
| Recent bed rest ≥3 days | 1.68 | 1.13;2.47* | Not selected | Not selected |
| Recent surgery | 2.08 | 0.91;4.72* | Not selected | Not selected |
| Previous venous thromboembolism | 2.30 | 1.36;3.88# | Not selected | Not selected |
| Malignant tumor | 0.61 | 0.37;1.02 | – | – |
| Heart failure | 1.43 | 0.84;2.45* | Not selected | Not selected |
| Diabetes mellitus | 0.80 | 0.49;1.33 | – | – |
| Hypertension | 1.55 | 1.03;2.30* | 1.61 | 1.02;2.62* |
| Atrial fibrillation | 1.20 | 0.69;2.12 | – | – |
| Coronary artery disease | 1.33 | 0.85;2.06 | – | – |
| Stroke | 1.20 | 0.62;2.30 | – | – |
| Renal failure | 1.28 | 0.66;2.49 | – | – |
| Liver cirrhosis | 0.34 | 0.06;2.45 | – | – |
| At-home O2 therapy | 0.65 | 0.40;1.05 | – | – |
| Oral anticoagulation | 0.80 | 0.41;1.56 | – | – |
| Antiplatelet therapy | 1.20 | 0.82;1.75 | – | – |
| Purulent sputum | 0.58 | 0.36;0.95 | – | – |
| Clinical signs of deep venous thrombosis | 5.20 | 3.22;8.39# | 5.64 | 3.13;10.16# |
| SpO2 < 90 mmHg or O2 therapy | 1.14 | 0.77;1.69 | – | – |
| At least one abnormal ECG indicates pulmonary embolism | 1.55 | 1.01;2.38* | Not selected | Not selected |
| pCO2 < 40 mmHg | 1.74 | 1.18;2.56# | 1.98 | 1.25;3.15# |
| pH > 7.45 | 1.24 | 0.82;1.88* | Not selected | Not selected |
| Normal chest X-ray | 2.22 | 1.43;3.41# | 1.91 | 1.15;3.14# |
| Variable | Adjusted OR | 95% CI | |
|---|---|---|---|
| RDW-SD (fl) | 1.179 | 1.037–1.359 | 0.005 |
| RDW-CV (%) | 1.024 | 0.847–1.186 | 0.793 |
| ALB (g/l) | 0.925 | 0.763–1.018 | 0.149 |
| ALT (μ/l) | 1.007 | 0.976–1.043 | 0.626 |
| AST (μ/l) | 0.973 | 0.910–1.063 | 0.711 |
| LDH-L (μ/l) | 1.024 | 1.021–1.046 | 0.029 |
| D-Dimer (μg/ml) | 1.515 | 1.041–2.204 | 0.025 |
| Parameters | RDW-CV | RDW-SD | D-Dimer |
|---|---|---|---|
| Cut off | 13.59 | 46.25 | 1.747 |
| AUC | 0.778 | 0.723 | 0.887 |
| 95% CI | 0.6863 to 0.8687 | 0.6312 to 0.8141 | 0.8123 to 0.9621 |
| Sensitivity (%) | 78.82 | 75.59 | 82.92 |
| Specificity (%) | 77.5 | 67.5 | 92.5 |
| <0.001 | <0.001 | <0.001 |
Peer Reviews
No public reviews on file for this paper yet. If you reviewed it on a platform where reviews are public (OpenReview, ICLR, NeurIPS, ICML), you can paste yours below so the community can read it here.
Videos
No videos yet. Explain this paper in a talk, walkthrough, or lecture? Add one.
Taxonomy
TopicsVenous Thromboembolism Diagnosis and Management · Chronic Obstructive Pulmonary Disease (COPD) Research · Inflammatory Biomarkers in Disease Prognosis
Introduction
1
Pulmonary thromboembolism (PTE), primarily manifested as pulmonary embolism (PE) in 90% of cases (1, 2), occurs when thrombi occlude pulmonary vessels. Although dual pulmonary circulation usually prevents pulmonary infarction (3), deep venous thrombosis (DVT) remains the predominant embolic source (4, 5). COPD exacerbates PE risk through inflammation-mediated endothelial dysfunction and hypercoagulability (6), with clinical presentations often mimicking acute COPD exacerbations, leading to frequent misdiagnosis (7–9). Timely diagnosis critically impacts prognosis, requiring clinician expertise in selecting appropriate diagnostic methods (10), where CTPA and laboratory indicators prove particularly valuable (11).
CTPA has become the primary diagnostic modality for PE (12), offering non-invasive 3D vascular reconstruction with high spatial resolution (13). Its technical advantages include rapid subsegmental emboli detection and reduced respiratory artifacts (14), maintaining high sensitivity/specificity while ensuring cost-effectiveness (15).
COPD’s chronic hypoxia induces erythrocytosis and impairs coagulation factor clearance (16), while systemic inflammation activates coagulation pathways through endothelial damage (17). Although inflammatory factors may drive coagulation changes as extrapulmonary COPD manifestations (18), conventional indicators (APTT, PT) reflect endogenous pathway activation (19), with D-dimer indicating coagulation-fibrinolysis interplay (20). Notably, PaCO2 levels show significant decreases in COPD-PE patients (21). Over the past few years, a rise has been observed in the frequency of Red Cell Distribution Width (RDW) in a wide range of illnesses. This observation implies that RDW holds the potential as a valuable marker for distinguishing between different diseases (22).
Coagulation function and arterial blood gas analysis have established reference values for diagnosing COPD combined with PE. However, currently, CTPA examination remains one of the most reliable, fastest, and sensitive methods for diagnosing PE. Coagulation function and blood gas analysis provide clues for diagnosing COPD combined with PE and also have value in preventing the occurrence of this combination. This research is to retrospectively analyze elderly patients with COPD and PE, exploring the risk factors and predictive value of clinical characteristics, CTPA results, and laboratory indicators.
Methods
2
Research object
2.1
This study adhered to the case inclusion criteria and analyzed 958 elderly patients diagnosed with COPD from 5 different hospitals in our province between June 1, 2022, and May 31, 2023. A retrospective study was carried out by categorizing elderly patients with COPD into two groups according to the occurrence of PE. The initial cohort, denoted as the observation group, was composed of PE-inflicted elderly COPD patients. In contrast, the control group included elderly COPD patients without PE. The study was sanctioned by the institutional review board at each participating center and adhered to the principles outlined in the Declaration of Helsinki. Considering its retrospective design, the necessity for written informed consent was waived.
Inclusion and exclusion criteria
2.2
Inclusion criteria: (1) The age of the patient is ≥60 years old; (2) According to the global initiative on chronic obstructive pulmonary disease (GOLD) standard (23), doctors diagnosed patients with COPD. Additionally, patients who were previously hospitalized and diagnosed with COPD at discharge, as well as those receiving treatment for COPD, were included; (3) The patient was diagnosed with PE based on the criteria outlined in the ESC Pulmonary Embolism Diagnosis and Treatment Guidelines (24).
Exclusion criteria: (1) Individuals with prior blood transfusion records and present hematologic disorders (e.g., anemia, irregular blood cell production, and blood cancers); (2) Participants lacking complete or accessible data.
Data collection
2.3
Basic information, like age and gender, should be included in the medical records of older individuals. Additionally, clinical features including blood pressure, pulse rate, and signs and symptoms associated with deep vein thrombosis (DVT), like pain, redness, and swelling of the affected limb, must be documented. Electrocardiogram attributes such as right bundle branch, right QRS axis deviation, and S1Q3T3 should also be noted, in addition to radiological findings from chest X-rays and any other pertinent information.
Laboratory parameters including complete blood count (CBC), arterial blood gas (ABG) analysis, coagulation profile, and biochemical indices were systematically collected. The CBC evaluation encompassed: white blood cell (WBC) count, red blood cell (RBC) count, hemoglobin (Hb) concentration, platelet count (PLT), red cell distribution width (RDW) parameters [coefficient of variation (RDW-CV) and standard deviation (RDW-SD)], mean platelet volume (MPV), platelet distribution width (PDW), and hematocrit (Hct). RDW-CV was calculated as (standard deviation of erythrocyte volume/mean corpuscular volume [MCV]) × 100, reflecting relative volumetric variation, while RDW-SD provided absolute erythrocyte size distribution in femtoliters (fL). Comorbid conditions (e.g., heat exhaustion, diabetes mellitus) and established PE risk factors including malignancy and prior venous thromboembolism were concurrently documented.
Statistical method
2.4
The IBM SPSS 26.0 software was employed to analyze all the data in this particular study. To assess the normal distribution of the dataset, the Shapiro–Wilk method was implemented, and any observed differences were statistically considered significant if p < 0.05. For continuous variables, the mean ± standard deviation (SD) or median values were used to present the data, and the Student t-test or Mann–Whitney U test was utilized for analysis. As for categorical data, cases (counts) or percentages were presented, and the chi-square test was employed for analysis. Relevant variables were included in the logistic regression model. This model aimed to determine the independent risk factors associated with COPD patients who had PE. The presence of PE was also evaluated in terms of its impact on in-hospital mortality and length of stay. To assess the discriminant performance of the parameters, the receiver operating characteristic (ROC) curve was utilized. The corresponding area under the curve (AUC) with a 95% confidence interval (CI) was employed for comparing predicted probabilities. The optimal cutoff value, determined based on the Youden index, was used to calculate the sensitivity and specificity cutoff values of the parameters.
Results
3
Analysis of baseline demographic characteristics of patients and potential clinical characteristics and risk factors of PE
3.1
Among the 958 elderly patients diagnosed with COPD, with a mean age of 75.4 ± 7.6 years and 65.6% being male, a total of 121 patients were diagnosed with PE. This corresponds to an average prevalence of 12.63% (Figure 1). Table 1 provides a list of baseline demographics, potential clinical characteristics, and risk factors associated with PE.
Grouping information.
Analysis of clinical and pathological features of patients
3.2
In this study, a total of 778 patients (81.2%) had at least one disease, while 220 patients (23.0%) had two or more concurrent diseases. During hospitalization, 887 cases (92.6%) underwent chest X-rays, with 181 cases (20.4%) showing no significant changes, 323 cases (36.4%) exhibiting pulmonary infiltrative changes, and 130 cases (14.7%) presenting pleural effusion. Arterial blood gas analysis was conducted in 870 cases (90.8%), revealing that 256 cases (29.4%) had a pH value ≥7.45, and 415 cases (47.7%) had PaCO_2_ levels within or below the normal range. The average duration of hospitalization for patients was (14.4 ± 8.5) days. Among them, 50 cases (5.18%) resulted in death during hospitalization, including 7 cases (5.8%) of patients with PE. Compression ultrasound was performed in 164 cases (17.1%), and 62 cases (6.42%) were found to have complications of DVT. Interestingly, among the patients without PE on chest vascular CT, 26 individuals were diagnosed with DVT, accounting for 2.71% of the total population and 41.93% of the DVT patients.
Comparison of laboratory test indexes of patients
3.3
In comparison to the control group, the observation group exhibited considerably higher levels of RDW-SD and RDW-CV (p < 0.001). The albumin (ALB) level in the observation group was markedly lower than that in the control group (p < 0.001). Furthermore, the observation group displayed significantly elevated levels of ALT, AST, and lactate dehydrogenase (LDH-L) in contrast to the control group (p < 0.001). Additionally, the D-dimer concentration in the observation group was notably higher than that in the control group (p < 0.001).
The levels of RBC, Hb, Hct, PLT, platelet crit (PCT %), eosinophils (EO %), lymphocytes (LYM %), oxygen saturation (SO_2_%), partial pressure of oxygen (PO_2_%), and fibrinogen (FIB) in the observation group exhibited significant reduction compared to the control group (p < 0.05). Furthermore, the observation group demonstrated significantly elevated MPV, neutrophils (Neut %), lactate (Lac %), and prothrombin time (PT) in comparison to the control group (p < 0.05). Table 2 introduces a comparative analysis of laboratory test parameters, encompassing blood count, biochemical measures, blood gas analysis, and coagulation markers, between the two patient groups.
Univariate and multivariate analysis of clinical and pathological risk factors associated with the prevalence of PE
3.4
A higher occurrence of PE was found to be significantly linked with various factors based on the univariate analysis. These factors encompassed age, female gender, previous occurrence of venous thromboembolism, the existence of at least one ECG abnormality implying PE, pH ≥ 7.45, PaCO_2_ ≤ 40 mm Hg, absence of anomalies in a chest radiograph, clinical indications and symptoms indicative of deep vein thrombosis, recent surgical procedure, recently extended bed rest for at least 3 days, and clinical records of heart failure and hypertension (p < 0.05). Conversely, patients with malignant tumors and those with purulent sputum had a significantly lower prevalence of PE. The summarized results of the univariate analysis can be found in Table 3.
In the analysis that accounts for multiple variables, numerous factors were discovered to exhibit a significant correlation with a greater occurrence of PE (p < 0.05). These factors encompass age, being female, the presence of clinical indications implying deep vein thrombosis, high blood pressure, PaCO_2_ ≤ 40 mmHg, and a chest X-ray within normal limits. Additional information can be seen in Table 3.
Patients in the observation group experienced a slightly longer average hospital stay in comparison to those in the control group (15.8 days versus 14.2 days, p = 0.06). Despite a slightly higher in-hospital mortality rate being observed in the observation group, this difference did not reach statistical significance (5.8% versus 5.1%, p = 0.76).
Logistic regression analysis of laboratory indexes of patients
3.5
The laboratory parameters exhibiting significant disparities (p < 0.001), as shown in Table 2, were integrated into the multifactor logistic regression model. Assessing the logistic regression model in Table 4 unveils the autonomous factors positing risks for PE. LDH-L, RDW-SD, and D-dimer were identified as autonomous risk factors for PE in elderly COPD patients (p < 0.05).
Analysis of the diagnostic value of RDW and D-dimer in predicting PE in patients with COPD
3.6
To assess the predictive precision of RDW-CV, RDW-SD, and D-dimer for PE, ROC curve analysis was conducted. The resulting AUC values were determined as 0.778, 0.723, and 0.887, correspondingly. The critical values that yielded the best prediction for PE were determined to be 46.25 for RDW-SD, 1.747 for D-dimer, and 13.59 for RDW-CV ratio. The corresponding sensitivity and specificity values were 75.59 and 67.5% for RDW-SD, 82.92 and 92.5% for D-dimer, and 78.82 and 77.5% for RDW-CV ratio. Please refer to Figure 2 for a visual representation of the results. Table 5 provides detailed statistics on the prediction accuracy of RDW and D-dimer.
Diagnostic value of ROC curve comparison of RDW-CV, RDW-SD, and D-dimer in predicting PE in patients with COPD.
Discussion
4
During this investigation, a noteworthy connection emerged between the prevalence of PE and the clinical indicators and manifestations of deep vein thrombosis (DVT) (with an odds ratio of around 5.6). Merely a minor proportion of individuals (6.1%) did not encounter the development of PE. From a pathophysiological perspective, it has been suggested that patients with COPD and PE may have reduced partial pressure of carbon dioxide (25). However, there is ongoing debate regarding the clinical evidence supporting this view. Some studies have reported that PE may occur due to a decrease in PaCO_2_ during COPD exacerbations, while others have argued that the diagnostic value of arterial blood gas testing in PE is limited unless included in the clinical score (26, 27). In our investigation, we veer towards the latter perspective since we noted a reduction in the carbon dioxide’s partial pressure in 60.0% of individuals identified with PE and in 46.5% of those without a diagnosis of PE.
Earlier research has shown that there is a high occurrence of imaging alterations, specifically consolidation on chest radiographs, among senior individuals diagnosed with COPD (28). Furthermore, these changes have been associated with an unfavorable prognosis. According to our research findings, around 21.1% of individuals diagnosed with COPD exhibited normal results in their chest X-rays. This observation was linked to a higher probability of developing VTE, with an odds ratio of approximately 1.9. Furthermore, our study identified that among elderly COPD patients who do not experience PE, the presence of other risk factors alongside “clinical indications and manifestations of DVT” does not serve as an efficient method for diagnosing or excluding the possibility of PE.
According to this study, it appears that PE has a limited impact on patient prognosis. In the case of elderly individuals diagnosed with COPD, there is no mortality disparity of statistical significance observed when comparing patients with and without PE (5.8% vs. 5.1%, p = 0.76). Additionally, the hospital stay for patients with PE was only slightly longer compared to those without PE (15.8 days vs. 14.2 days, p = 0.06). This suggests that hospitalization during diagnosis and subsequent treatment effectively reduces the risk of death and lengthier hospital stays.
The investigation revealed that there was a noticeable increase in the levels of RDW-CV and RDW-SD among elderly COPD patients with PE in comparison to those who did not have PE. Moreover, heightened RDW-SD levels exhibited a considerably augmented likelihood of PE, whereas diminished RDW-SD levels were linked to a decreased risk. The escalated susceptibility to PE in COPD patients might be attributed to multiple mechanisms, encompassing systemic inflammation (29), hypoxemia (30), amplified oxidative stress (31), dysfunction of endothelium (32), and an inclination towards increased blood clot formation (33). The results derived from this investigation imply that RDW has the potential to function as an alternative biomarker to gauge the level of inflammatory activity. Previous studies have also indicated a possible link between inflammation and chronic thromboembolic pulmonary hypertension in RDW (34). The occurrence of these irregularities can involve the amplified release of erythropoietin and an undetected sudden decline in cardiac functionality.
A multivariate analysis employing logistic regression was carried out to assess the influence of various risk factors on the presence of both COPD and PE. Our study reveals that RDW-SD, LDH-L, and D-dimer possess distinct predictive significance for PE, regardless of the presence of other risk factors. The risk of PE is significantly increased by both elevated and decreased levels of D-dimer. Additionally, an augmented risk of PE is closely linked with RDW-SD, underscoring its involvement as a contributing factor to PE. Detecting PE early is of utmost importance for patients at high risk, and doctors can assess the risk in COPD and PE patients by considering the levels of RDW-SD.
RDW, an easily measured laboratory factor that is relatively simple, inexpensive, and has been recently demonstrated to predict mortality and morbidity in various diseases, has emerged as a potential predictor of PE prognosis (35). In one study involving 702 PE patients, RDW levels were found to be a potential marker for mortality (36). Previous research has indicated that blood RDW levels have the potential to serve as an uncomplicated and convenient measure for forecasting the likelihood of mortality within 30 days for individuals with PE. In addition, Hammons et al. noted a connection between RDW and prognosis, severity, and survival rates in patients experiencing acute PE (37).
Nevertheless, limited investigations have focused on the potential of RDW in predicting PE specifically in COPD patients. Analysis of ROC curves has demonstrated that D-dimer exhibits a higher AUC in predicting PE compared to RDW-SD. Notably, while D-dimer demonstrates superior diagnostic accuracy in acute PE detection, our findings highlight RDW’s unique clinical merits as a chronic disease progression marker. The persistent elevation of RDW may reflect cumulative inflammatory burden and hypoxia-mediated erythrocyte dysfunction in COPD patients (30, 34), potentially serving as an early warning sign for subclinical thrombotic predisposition prior to acute events. Particularly in scenarios where D-dimer interpretation is confounded by recent surgery, trauma, or chronic inflammatory states (20), RDW provides complementary value through its stability across these clinical conditions. Future investigations should explore optimized biomarker panels combining RDW’s chronic risk stratification capacity with D-dimer’s acute phase responsiveness, potentially enhancing PE prediction in complex COPD populations. This dual-marker approach could prove crucial for implementing personalized anticoagulation strategies in elderly COPD patients with varying thrombotic risk trajectories. As a result, we propose the hypothesis that heightened levels of RDW could potentially function as a reliable marker for the presence of PE in COPD patients.
Conclusion
5
In this multicenter retrospective research, we discovered that 2.71% of elderly patients with COPD were diagnosed with DVT without PE. This finding highlights the importance of considering the prevalence of VTE. Using multivariate analysis, we discovered numerous potential clinical risk factors associated with PE in patients with COPD. These factors include being female, exhibiting clinical symptoms and signs indicating DVT, having hypertension, having a PaCO2 level below 40 mmHg, and presenting with a normal chest X-ray. Moreover, we uncovered that RDW-SD might serve as a promising biomarker for the diagnosis of PE in elderly individuals diagnosed with COPD.
The reference list from the paper itself. Each links out to its DOI / PubMed record.
- 1Pulmonary embolism. Nat Rev Dis Primers. (2018) 4:18031. doi: 10.1038/nrdp.2018.31, PMID: 29770792 · doi ↗ · pubmed ↗
- 2Goldhaber SZ. Pulmonary embolism. Lancet. (2018) 363:1295–305. doi: 10.1016/S 0140-6736(04)16004-2, PMID: 15094276 · doi ↗ · pubmed ↗
- 3Ten Cate V Prochaska JH Schulz A Nagler M Robles AP Jurk K. Clinical profile and outcome of isolated pulmonary embolism: a systematic review and meta-analysis. E Clinical Medicine. (2023) 59:101973. doi: 10.1016/j.eclinm.2023.101973, PMID: 37152363 PMC 10154961 · doi ↗ · pubmed ↗
- 4Bikdeli B Caraballo C Trujillo-Santos J Galanaud J Pdi Micco P Rosa V. Clinical presentation and short- and long-term outcomes in patients With isolated distal deep vein thrombosis vs proximal deep vein Thrombosis in the RIETE registry. JAMA Cardiol. (2022) 7:857–65. doi: 10.1001/jamacardio.2022.1988, PMID: 35830171 PMC 9280612 · doi ↗ · pubmed ↗
- 5Shi Y Wang T Yuan Y Su H Chen L Huang H. Silent pulmonary embolism in deep vein thrombosis: relationship and Risk factors. Clin Appl Thromb Hemost. (2022) 28:10760296221131034. doi: 10.1177/10760296221131034, PMID: 36199255 PMC 9537479 · doi ↗ · pubmed ↗
- 6Jiménez D AgustíA Tabernero E Jara-Palomares L Hernando A Ruiz-Artacho P. Effect of a pulmonary embolism diagnostic strategy on clinical outcomes in patients hospitalized for COPD exacerbation: a randomized clinical trial. JAMA. (2021) 326:1277–85.34609451 10.1001/jama.2021.14846 PMC 8493436 · doi ↗ · pubmed ↗
- 7Chaireti R. In patients hospitalized for COPD exacerbation, a PE diagnostic strategy + usual care did not improve outcomes. Ann Intern Med. (2022) 175:JC 19. doi: 10.7326/J 21-0017, PMID: 35099991 · doi ↗ · pubmed ↗
- 8Aleva FE Voets LWLM Simons S Ode Mast Qvan der Ven AJAM Heijdra YF. Prevalence and localization of pulmonary embolism in unexplained acute exacerbations of COPD: a systematic review and Meta-analysis. Chest. (2017) 151:544–54. doi: 10.1016/j.chest.2016.07.034, PMID: 27522956 · doi ↗ · pubmed ↗