A First-Principles Comparative Study on the Elastic and Related Properties of Ti3AC2 (A = Si, Ir, and Au) MAX Phases
Yufeng Wen, Huaizhang Gu, Yanlin Yu, Zhangli Lai, Xianshi Zeng, Guilian Wang

TL;DR
This study compares the elastic and thermal properties of three MAX phases using first-principles calculations to guide material design for high-performance applications.
Contribution
A first-principles comparative analysis of elastic and thermal properties of Ti3AC2 (A = Si, Ir, Au) MAX phases is presented.
Findings
Ti3SiC2 is more ductile than Ti3IrC2 and Ti3AuC2, which show greater elastic anisotropy.
Ti3SiC2 outperforms others in sound velocity, Debye temperature, and thermal conductivity.
Ti3IrC2 has the highest melting point, while Ti3AuC2 has the largest Grüneisen parameter.
Abstract
The elastic, mechanical, acoustic, and thermal properties of Ti3SiC2, Ti3IrC2, and Ti3AuC2 MAX phases were systematically investigated using first-principles calculations based on density functional theory. The computed lattice parameters and elastic, mechanical, and acoustic properties were consistent with existing experimental and theoretical findings, confirming the intrinsic mechanical stability of these MAX phases. Single-crystal elastic stiffness constants were used to derive polycrystalline elastic moduli, directional dependencies of bulk, shear, and Young’s moduli, and anisotropic factors. The results revealed a ductility sequence of Ti3SiC2 < Ti3IrC2 < Ti3AuC2, with Ti3IrC2 and Ti3AuC2 exhibiting greater elastic anisotropy than Ti3SiC2. Additionally, sound velocities, Debye temperatures, minimum thermal conductivities, melting points, and Grüneisen parameters were determined.…
Genes, proteins, chemicals, diseases, species, mutations and cell lines named across the full text — each resolved to its canonical identifier and authoritative record.
Click any figure to enlarge with its caption.
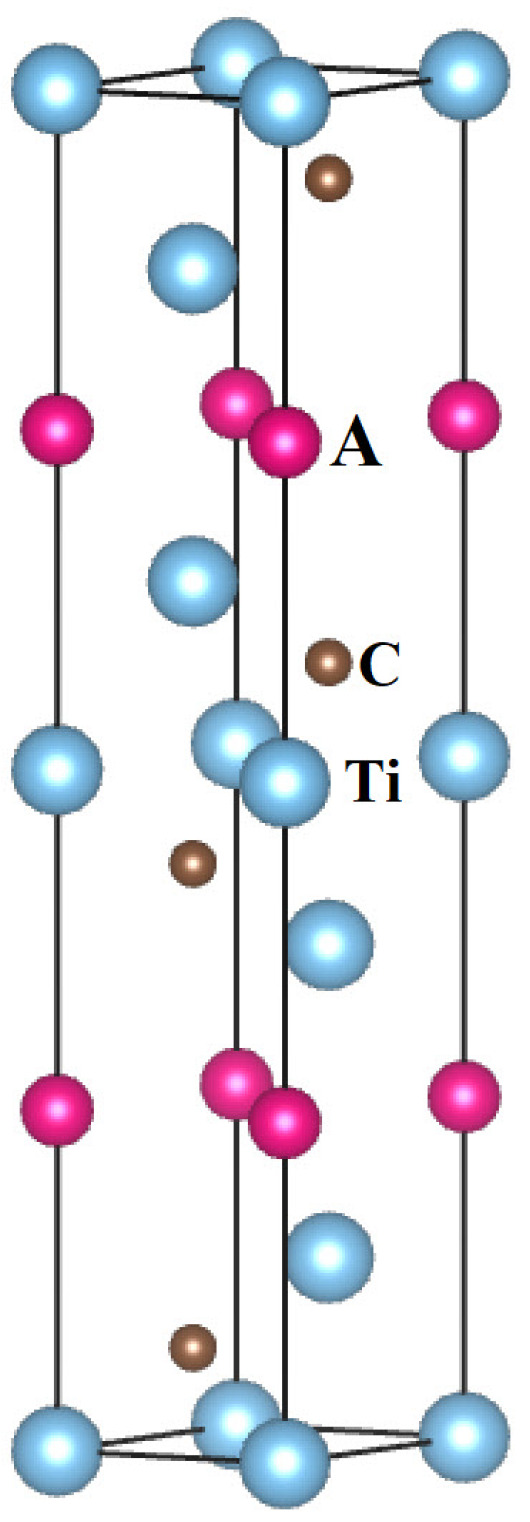 Figure 1
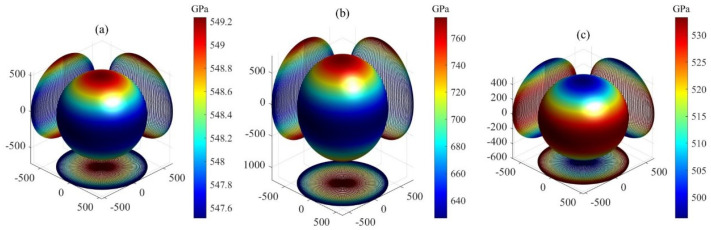 Figure 2
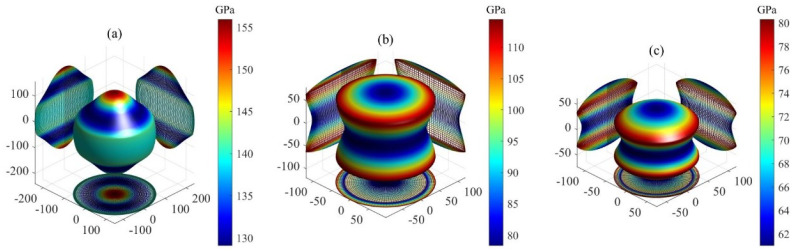 Figure 3
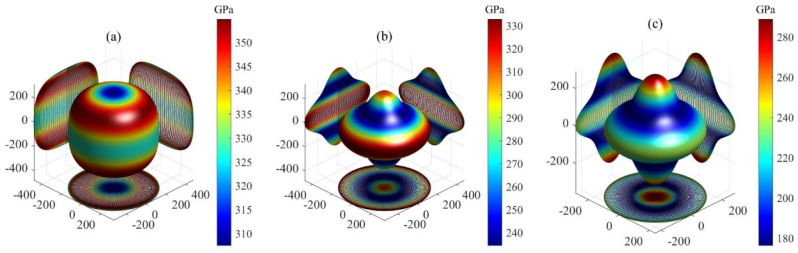 Figure 4
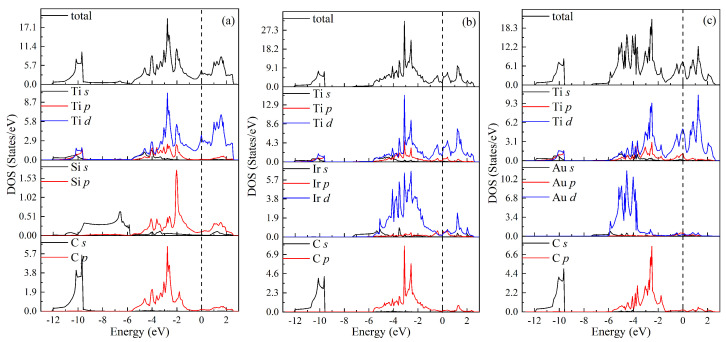 Figure 5
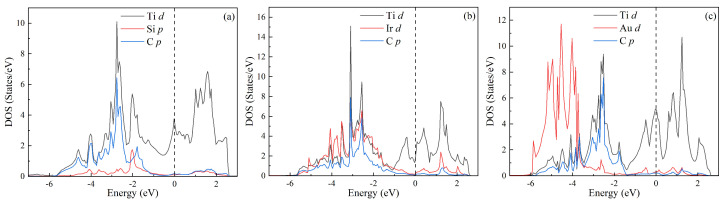 Figure 6
- —Specialized fund for the Doctoral of Kaili University
- —National Natural Science Foundation of China
Peer Reviews
No public reviews on file for this paper yet. If you reviewed it on a platform where reviews are public (OpenReview, ICLR, NeurIPS, ICML), you can paste yours below so the community can read it here.
Videos
No videos yet. Explain this paper in a talk, walkthrough, or lecture? Add one.
Taxonomy
TopicsMXene and MAX Phase Materials · Ferroelectric and Negative Capacitance Devices · 2D Materials and Applications
1. Introduction
MAX phases represent an extensive family of ternary nanolaminated compounds with the chemical formula of A (n = 1, 2, or 3), where “M” denotes an early transition metal, “A” represents an A-group element typically from groups IIIA or IVA of the periodic table, and “X” stands for C and or N. Due to their unique layered structure, comprising alternating metallic and X layers, and their diverse bonding features, stemming from strong covalent-ionic and weak metallic bonds, MAX phases display a hybrid nature, integrating metallic and ceramic properties. This includes high temperature stability, remarkable mechanical properties, high thermal conductivity, and excellent resistance to oxidation [1,2,3]. The exceptional mechanical and thermal properties of MAX phases make them ideal candidates for application in harsh environments [3]. Elastic stiffness constants are fundamental measures that describe how solid materials respond to external mechanical forces. Understanding these constants is crucial for various practical applications that rely on the mechanical behavior of solids. The elastic properties of solids are closely tied to fundamental solid-state phenomena, such as interatomic bonding, equations of state, and phonon spectra. They are also thermodynamically connected to specific heat, thermal expansion, Debye temperature, and the Grüneisen parameter. Recently, Fashandi et al. [4] synthesized novel Au and phases via a substitutional solid-state reaction of Au into Si single-crystal thin films, accompanied by Si out-diffusion. They further produced Ir phase by substituting Ir for Au in . In order to explore the possibility of application in harsh environments, it is necessary to study the mechanical and thermal properties of these novel phases. To the best of our knowledge, the elastic, mechanical, acoustic, and thermal properties of these novel phases have not yet been experimentally investigated, despite the fact that those of the Si MAX phase have been determined using pulse-echo ultrasonic techniques [5] and resonant ultrasound spectroscopy [6]. These motivate us to comparatively investigate the elastic, mechanical, acoustic, and thermal properties of Si , Ir , and Au MAX phases.
First-principles calculations are among the most effective methods for exploring material properties. Over the past decades, first-principles calculations have been widely employed to investigate the properties of MAX phases [1,4,7,8,9,10,11,12,13,14,15,16]. Among the three MAX phases of Si , Au , and Ir , the various properties of Si , which include phase stability, electronic, elastic, mechanical, thermal, optical, and other properties, have been investigated by some researchers using first-principles calculations [4,7,8,9,10,11]. For Au , the phase stability, electronic, elastic, mechanical, thermal, and optical properties have also been investigated by Fashandi et al. [4] and Qureshi et al. [12] using first-principles calculations. For Ir , only the phase stability and electronic structures have been studied by Fashandi et al. [4] using first-principles calculations. To date, the anisotropy in the acoustic properties of Si and Au has not been theoretically investigated, nor have the elastic, mechanical, acoustic, and thermal properties of Ir been thoroughly explored. Meanwhile, no systematical study has been conducted on the properties of Si , Ir , and Au MAX phases. Accordingly, this work employs first-principles to comparatively investigate the elastic, mechanical, acoustic, and thermal properties of these MAX phases.
2. Methodology
The MAX phases of Si , Au , and Ir exhibit hexagonal symmetry with the space group P /mmc. The atomic positions are as follows: Ti at 2a and 4f, A (Si, Au or Ir) at 2b, and C at 4f Wyckoff positions, as shown in Figure 1. The initial calculation models for these MAX phases were constructed using their theoretical lattice parameters and atomic positions as reported in Ref. [4]. For a hexagonal crystal, there are five independent single-crystal elastic stiffness constants: , , , , and . The stress–strain method is an effective approach for determining these single-crystal constants, where the elastic stiffness constants are defined as the first derivatives of the stresses with respect to the strain tensor [17]. After performing first-principles calculations with full optimization of the lattice parameters and atomic coordinates of atoms in the unit cell, the elastic stiffness constants of these MAX phases were predicted using the strain–stress method based on first-principles calculations.
Ab initio computations were performed using density functional theory (DFT) with the projector-augmented wave technique [18], employing the Perdew–Burke–Ernzerhof (PBE) generalized gradient approximation (GGA) [19], as implemented in the Vienna Ab initio Simulation Package (VASP) [20,21,22]. The electronic wave functions were expanded with an energy cutoff of 520 eV, and the total energy convergence threshold was set to eV during the self-consistency process. The Brillouin zone was sampled using -centered Monkhorst-Pack k-point grids [23]. For structural optimization, a 15 × 15 × 2 k-point grid was utilized, while a denser 21 × 21 × 3 grid was employed for calculating elastic stiffness constants. The structure was relaxed by optimizing the volume, shape, and atomic positions until the residual forces on each atom were below 0.001 eV/Å. Elastic constants were determined by applying six finite lattice distortions and analyzing the strain–stress response within VASP. Both rigid-ion and relaxed-ion contributions to the elastic tensor were considered. The ionic contributions were computed by inverting the ionic Hessian matrix and incorporating the internal strain tensor [24,25]. The final elastic constants represent the combined effects of rigid-ion distortions and ionic relaxations, providing a comprehensive description of the material’s elastic behavior.
3. Results and Discussions
3.1. Elastic and Mechanical Properties
The calculated equilibrium lattice constants (a, c), mass density ( ), single-crystal elastic stiffness constants ( ), and Cauchy pressures ( , ) for Si , Ir , and Au are listed in Table 1 alongside existing theoretical data and experimental measurements. The optimized lattice constants of these MAX phases are in excellent agreement with previous calculations and experimental data [4,7,9,11,26,27]. The differences between our calculations and previous reports for the lattice constants a and c are less than 0.63%. For Si , the deviations in the density compared to previous theoretical results [7] and experimental values [5,6] are 1.45% and 0.33%, respectively. Additionally, its elastic stiffness constants are consistent with previous theoretical results [7,8,9,10,12]. These findings demonstrate the accuracy and reliability of our calculations.
The intrinsic mechanical stability of a crystal usually can be determined using the elastic stiffness constants based on Born–Huang’s lattice dynamical theory [28]. According to Born–Huang’s theory, the mechanical stability criteria for hexagonal crystals are as follows:
The elastic stiffness constants of the three MAX phases satisfy the mechanical stability criteria, demonstrating their intrinsic stability. The constants and represent the rigidity against unidirectional deformation along the a and c axes, respectively. The values of and exceed those of other elastic stiffness constants, indicating incompressibility under uniaxial stress along the a and c axes. The value of for Si is slightly larger than , implying stronger incompressibility along the a axis compared to the c axis. Conversely, Ir and Au exhibit slightly smaller values, indicating stronger compressibility along the a axis. For Si and Ir , The compression modulus is smaller than , indicating a weaker elastic modulus under bi-axial stress along the a axis compared to stress deviating from the a axis. Conversely, Au exhibits a larger value, indicating a stronger elastic modulus under bi-axial stress along the a axis compared to stress deviating from the a axis. The shear moduli ( and ) exhibit deviations, indicating shear modulus anisotropy. Meanwhile, the and values of Si fall between those of Ir and Au , indicating the incompressibility sequence along the principal axes is Ir > Si > Au .
Pettifor et al. [29] suggested that the angular nature of atomic bonding in materials, affecting whether a material is brittle or ductile, can be explained using the Cauchy pressure. They showed that brittleness stems from an unusual characteristic of elastic constants, specifically a negative Cauchy pressure. Metallic bonding generally exhibits positive Cauchy pressure, whereas directional bonding shows negative values, with more negative values signifying stronger directional bonding characteristics. For hexagonal crystals, the Cauchy pressures are given by and . The corresponding values for the three MAX phases are listed in Table 1. Si exhibits negative Cauchy pressures, indicating brittle bonding with directional characteristics. In contrast, Au demonstrates metallic bonding and ductility, as evidenced by positive Cauchy pressures. For Ir , is positive, while is negative, suggesting a mix of metallic and directional bonding. Moreover, exceeding twice the absolute value of indicates that metallic bonding is dominant, contributing to the ductility of Ir .
Bulk modulus (B) represents the material’s resistance to hydrostatic pressure. Shear modulus (G) characterizes a material’s resistance to shear deformation. Young’s modulus (E) quantifies the resistance to uniaxial tension or compression. Using the Voigt–Reuss–Hill averaging scheme [30], the polycrystalline bulk, shear, Young’s moduli, and Poisson’s ratio ( ) of Si , Au , and Ir can be determined from the obtained single-crystal elastic stiffness constants . For hexagonal structures, the Voigt ( ) and Reuss ( ) bulk moduli and Voigt ( ) and Reuss ( ) shear moduli are expressed as follows [31,32]:
According to the averaging scheme, the bulk and shear moduli are estimated as follows:
Young’s modulus ( ) and Poisson’s ratio ( ) can be further obtained by the following expressions:
The calculated elastic moduli B, G, E, Poisson’s ratio , and ratio for polycrystalline Si , Ir , and Au are listed in Table 2, along with theoretical values and experimental data. The values of B, G, E, , and the ratio agree well with those of previous calculations [7,8,9,10,11] and experimental measurements [5,6]. For these isostructural 312 phases, the bulk modulus B follows the sequence Ir > Si > Au . Conversely, both the shear modulus G and Young’s modulus E decrease in the order Si > Ir > Au . Generally, a higher shear modulus G indicates stronger directional bonding between atoms. Our calculations reveal that Si exhibits the strongest bonding, followed by Ir , while Au has the weakest bonding. which is consistent with our calculation of the Cauchy pressures. Through empirical observations, Pugh [33] established a direct relationship between the plastic behavior of materials and their elastic properties. A greater ratio is commonly linked to brittle characteristics, while a lesser ratio is indicative of ductility. The dividing line between ductile and brittle materials is often cited as 0.5; materials with above this threshold are typically brittle, whereas those below are more ductile. In our case, the calculated results clearly imply that Si is a brittle phase, whereas both Ir and Au are ductile phases. Meanwhile, the ductility is increased in the sequence of Si < Ir < Au . Poisson’s ratio is the most informative regarding the bonding behavior among all elastic moduli [34]. The typical value of is 0.1, 0.25, and 0.33 for covalent, ionic, and metallic materials, respectively [35]. The present results of Poisson’s ration indicate that Si exhibits ionic/covalent bonding characteristics, while Ir and Au distinctly belong to the class of metallically bonded materials. Meanwhile, the value of for Ir is slightly smaller than that of Au , implying the stronger metallic bonding in Au . This is also consistent with our calculation of the Cauchy pressures.
Elastic anisotropy plays a crucial role in assessing the mechanical properties of materials. A three-dimensional (3D) surface model is used to depict elastic anisotropy by showing how the elastic modulus changes with crystallographic orientation [36]. The directional dependence of B, G, and E in the hexagonal crystal system can be described using the equations below:
Here, the elastic compliance constants constitute the inverse matrix of elastic stiffness constants , while the direction cosines are defined as , , , , , and . The 3D plots showing the orientation dependence of B, G, and E for Si , Ir , and Au are presented in Figure 2, Figure 3 and Figure 4, respectively. All the plots are axis-symmetrical around the c axis. This axis symmetry arises from the hexagonal symmetry. For instance, considering the bulk modulus, where , a specific value of dictates , thereby determining B and resulting in the 3D plot’s axis symmetry around the c axis. For isotropic materials, the 3D curved surface is spherical. However, real crystals, being anisotropic, exhibit distorted spheres, with the degree of distortion reflecting their anisotropic nature. All 3D plots exhibit nonspherical shapes, indicating varying degrees of elastic anisotropy in these three MAX phases. For bulk and shear moduli, the deviation from sphericity decreases in the order Ir > Au > Si . The degree of nonsphericity for Young’s modulus increases in the order Si < Ir < Au . Notably, the shear and Young’s moduli exhibit significantly nonspherical shapes compared to the corresponding bulk moduli, indicating a higher degree of anisotropy in shear and Young’s moduli compared to the bulk modulus.
The uniaxial bulk moduli along the a-axis ( ) and c-axis ( ) are defined as [37]:
The average shear modulus G, Young’s modulus E, and Poisson’s ratio on the (2 0), (010), and (001) planes can be determined using the following relationships [37]:
The calculated values of the uniaxial modulus B, shear modulus G, Young’s modulus E, and Poisson’s ratio on the (2 0), (010), and (001) planes are presented in Table 3. The , , , and values of Si obtained in this study are in excellent agreement with those of previous calculations [11]. For Si and Ir , is smaller than , whereas for Au , is larger than . For the average shear modulus, for Si , whereas for Ir and Au . For Si and Ir , is larger than , whereas for Au , is smaller than . Similar to the uniaxial bulk modulus, is smaller than for Si and Ir , whereas for Au , is larger than . These results demonstrate that the anisotropic behaviors of Si , Ir , and Au are significant due to the differences in shear modulus, Young’s modulus, and Poisson’s ratio between the prismatic planes (2 0), (010), and the basal plane (001). Additionally, both and decrease in the order Ir > Si > Au , indicating that the incompressibility along the a and c axes follows the same sequence. This is consistent with the elastic constants and of these MAX phases. For Si , both and are the largest, followed by Ir , with Au having the smallest values. Similarly, and decrease in the order Ir > Si > Au , consistent with and . For Poisson’s ratio, increases in the order Si < Ir < Au , while for Si lies between those for Ir and Au .
Another approach to investigate elastic anisotropy involves various anisotropic factors. The shear anisotropy factor quantifies the degree of anisotropy based on atomic bonding in different planes. For hexagonal crystals, it is defined as follows [37]:
for the {100} shear planes between <011> and <010> directions,
for the {010} shear planes between <101> and <001> directions, and
for the {001} shear planes between <110> and <010> directions. When , , and equal 1, the crystal is isotropic. Values deviating from 1 indicate varying degrees of anisotropic behavior. The calculated values of , , and are presented in Table 4. The and values for Si , Au , and Ir significant deviate from 1, indicating anisotropic behavior in {100} and {010} planes. Conversely, their values equal 1, indicating isotropy in {001} planes. These results are consistent with the planar projections of shear modulus in Figure 3, specifically for the (100), (010), and (001) planes. Ranganathan and Ostoja-Starzewski [38] introduced the universal anisotropy index ( ) to quantify single-crystal elastic anisotropy. The universal anisotropy index is defined as follows:
represents isotropic single crystals, while denotes the extent of anisotropy. The calculated values are 0.032 for Si , 0.397 for Ir , and 0.337 for Au , indicating anisotropic behavior in these MAX phases. Kube [39] proposed the log-Euclidean anisotropy index ( ) to quantify single-crystal elastic anisotropy. The log-Euclidean anisotropy index is defined as follows:
represents isotropic single crystals, while denotes the extent of anisotropy. The calculated values are 0.014 for Si , 0.169 for Ir , and 0.146 for Au , indicating anisotropic elasticity in these phases. These results are consistent with the 3D surface representations earlier.
3.2. Acoustic and Thermal Properties
By utilizing the elastic constants of single crystals, the acoustic wave velocities corresponding to longitudinal and transverse wave modes can be determined through Bragger’s method. The velocities of hexagonal crystals in their principal orientations can be readily determined by the following [37]:
where represents the velocity of longitudinal sound waves, denotes the first transverse wave mode, and corresponds to the second transverse wave mode. The calculated phase acoustic velocities for Si , Ir , and Au are presented in Table 5. Both the longitudinal and transverse sound velocities for these MAX phases decrease in the order Si > Ir > Au . For longitudinal sound velocity, the value of [100] for each MAX phase is significantly smaller than [001] , indicating the anisotropic nature of their sound velocities. As the phase acoustic velocities for each MAX phase are determined by the elastic constants, the observed anisotropy in acoustic velocities reflects the anisotropic nature of their elastic properties.
The Debye temperature, denoted as , serves as a pivotal property of materials, significantly influencing various physical characteristics. These include thermal conductivity, thermal expansion, lattice vibrations, specific heat capacities, and the melting point. According to Anderson’s methodology [40], can be determined by employing the mean sound wave velocity ( ) within polycrystalline materials, as follows [41]:
Here, h and denote Planck’s and Boltzmann’s constants, respectively. represents Avogadro’s number, M is the molecular weight, n represents the number of atoms per molecule, and and are the longitudinal and transverse sound velocities, respectively. The calculated sound velocities , , , and Debye temperatures for Si , Ir , and Au are listed in Table 6, along with theoretical values and experimental data. The calculated values of , , , and for Si are consistent with previous theoretical results [7,8,9] and experimental data [5,6], confirming the accuracy and reliability of our calculations. The longitudinal ( ), transverse ( ), mean ( ) velocities, and Debye temperature of these MAX phases decrease in the order Si > Ir > Au . Higher Debye temperatures are associated with better thermal conductivity in solids. Therefore, the thermal conductivities of these phases are expected to follow the same trend: Si > Ir > Au .
Thermal conductivity is an inherent property of a material that measures its ability to transfer heat. At elevated temperatures, thermal conductivity reaches a minimal value, referred to as the minimum thermal conductivity ( ). Clarke’s model [42] offers a method to determine this value, as follows:
The calculated values of Kmin for Si , Ir , and Au are listed in Table 6. Like the average sound velocities and Debye temperatures, the minimum thermal conductivities of these MAX phases are also decreased in the sequence of Si > Ir > Au .
The melting point ( ) of a solid is defined as the temperature at which it transitions from the solid to the liquid phase. For hexagonal crystals, can be estimated using elastic stiffness constants, as described in Ref. [43]:
The calculated values for Si , Ir , and Au are presented in Table 6. The melting point exhibits a descending trend: Ir > Si > Au , with all values exceeding 1700 K. These high melting points are promising for applications in high-temperature structural materials.
The Grüneisen parameter ( ) effectively indicates the strength of anharmonicity. A larger absolute value of signifies stronger phonon–phonon anharmonic dispersion, resulting in lower lattice thermal conductivity because of its inverse relationship with lattice conductivity [44]. The Grüneisen parameter can be calculated from Poisson’s ratio using the following equation:
The calculated Grüneisen parameters for Si , Ir , and Au are shown in Table 6. Among these MAX phases, Si has the smallest value, showing the weakest anharmonicity and highest lattice thermal conductivity. On the other hand, Au displays the strongest anharmonicity and lowest lattice thermal conductivity due to its largest value.
3.3. Density of States
The total and partial densities of states (DOSs) for MAX phases Si , Ir , and Au have been further calculated to understand the physical nature of the above properties, as shown in Figure 5a, Figure 5b, and Figure 5c, respectively. For each phase, the total DOS below eV is determined by the s state of C. In the energy region between eV and 0 eV, the total DOS comes mainly from Ti d, Si p, and C p states for Si , from Ti d, Ir d, and C p states for Ir , and from Ti d, Au d, and C p states for Au . Above the Fermi level ( ), the total DOS is attributed to Ti d states for Si and Au , and the d states of Ti and Ir for Ir . The values of total TDOS at the for Si , Ir , and Au are 4.493, 2.035, and 7.414 states/eV, respectively, indicating their metallic characteristics. Moreover, there are overlapping specifics among Ti d, Si p, and C p states for Si , among Ti d, Ir d, and C p for Ir , and among Ti d, Au d, and C p for Au . The overlapping specifics for Si , Ir , and Au are shown in Figure 6a, Figure 6b, and Figure 6c, respectively. These imply the orbital hybridization on the formation of these phases. For each phase, the hybridization between Ti d and C p orbitals is strong. For Si , the strong hybridizations also exist between Ti d and Si p orbitals as well as between Si p and C p orbitals. Similarly, there are the relatively strong hybridizations between Ti d and Ir d orbitals as well as Ir d and C p orbitals. However, there are weak hybridizations between Ti d and Au d orbitals as well as Au d and C p orbitals for Au . In other words, there are directional bonding in these MAX phases, and Si exhibits a prominent directional feature, followed by Ir , and Au exhibits a weak directional feature. These are consistent with the results of Cauchy pressures above.
4. Conclusions
The thermal, acoustic, mechanical, and elastic properties of Si , Ir , and Au MAX phases were comprehensively analyzed using ab initio calculations based on density functional theory. The calculated lattice parameters, along with mechanical, elastic, and acoustic properties, align well with existing experimental and theoretical findings. The mechanical stability of these MAX phases was demonstrated by their single-crystal elastic stiffness constants. From these constants, several properties were derived, including Cauchy pressures, polycrystalline elastic moduli, and directional dependencies of bulk, shear, and Young’s moduli. Additionally, various anisotropic factors were obtained from these constants. The computed Cauchy pressures, ratios, and Poisson’s ratios showed that Au is the most ductile, followed by Ir , with Si being the least ductile. Additionally, the analysis of directional elastic moduli and anisotropic factors demonstrated that incompressibility along the a and c axes follows Ir > Si > Au . Furthermore, Ir and Au exhibit higher elastic anisotropy compared to Si . From the single-crystal elastic stiffness constants and polycrystalline elastic moduli of these MAX phases, the pure longitudinal and transverse velocities in the principal directions, average sound velocities, Debye temperatures, minimum thermal conductivities, melting points, and Grüneisen parameters were determined. The calculated results demonstrate the following trends: Si exhibits higher longitudinal and transverse sound velocities, average sound velocities, Debye temperature, and minimum thermal conductivity than Ir , which in turn exceeds Au . The melting point follows a different trend, with Ir having a higher melting point than Si , which is higher than Au . Additionally, the Grüneisen parameter increases from Si to Ir and further to Au .
The reference list from the paper itself. Each links out to its DOI / PubMed record.
- 1Yuan J. Wang Z. Ma G. Bai X. Li Y. Cheng X. Ke P. Wang A. MAX phase forming mechanisms of M–Al–C (M = Ti, V, Cr) coatings: In-situ X-ray diffraction and first-principle calculations J. Mater. Sci. Technol.202314314015210.1016/j.jmst.2022.09.045 · doi ↗
- 2Zhang Z. Duan X. Jia D. Zhou Y. van der Zwaag S. On the formation mechanisms and properties of MAX phases: A review J. Eur. Ceram. Soc.2021413851387810.1016/j.jeurceramsoc.2021.02.002 · doi ↗
- 3Ma G. Zhang A. Wang Z. Wang K. Zhang J. Xu K. Xu Y. Zhou S. Wang A. MAX phases coatings: Synthesis, protective performance, and functional characteristics Mater. Horiz.202512168910.1039/D 4MH 01001 A 39757934 · doi ↗ · pubmed ↗
- 4Fashandi H. Dahlqvist M. Lu J. Palisaitis J. Simak S.I. Abrikosov I.A. Rosen J. Hultman L. Andersson M. Spetz A.L. Synthesis of Ti 3Au C 2, Ti 3Au 2C 2 and Ti 3Ir C 2 by noble metal substitution reaction in Ti 3Si C 2 for high-temperature-stable Ohmic contacts to Si C Nat. Mater.20171681481810.1038/nmat 489628459444 · doi ↗ · pubmed ↗
- 5Finkel P. Barsoum M.W. El-Raghy T. Low temperature dependence of the elastic properties of Ti 4Al N 3, Ti 3Al 1.1C 1.8, and Ti 3Si C 2J. Appl. Phys.200087170110.1063/1.372080 · doi ↗
- 6Radovic M. Barsoum M.W. Ganguly A. Zhen T. Finkel P. Kalidindi S.R. Lara-Curzio E. On the elastic properties and mechanical damping of Ti 3Si C 2, Ti 3Ge C 2, Ti 3Si 0.5Al 0.5C 2 and Ti 2Al C in the 300–1573 K temperature range Acta Mater.2006542757276710.1016/j.actamat.2006.02.019 · doi ↗
- 7Bai Y. He X. Sun Y. Zhu C. Li M. Shi L. Chemical bonding and elastic properties of Ti 3AC 2 phases (A=Si, Ge, and Sn): A first-principles study Solid State Sci.2010121220122510.1016/j.solidstatesciences.2010.03.007 · doi ↗
- 8Yu R. Zhang X.F. He L. Ye H. Topology of charge density and elastic anisotropy of Ti 3Si C 2 polymorphs J. Mater. Res.2005201180118510.1557/JMR.2005.0145 · doi ↗