Act1 out of Action: Identifying Reliable Reference Genes in Trichoderma reesei for Gene Expression Analysis
Caroline Danner, Yuriy Karpenko, Robert L. Mach, Astrid R. Mach-Aigner

TL;DR
This study identifies more reliable reference genes for gene expression analysis in Trichoderma reesei, showing that commonly used genes like act1 and sar1 are unstable.
Contribution
The study proposes new, validated reference genes (bzp1 and tpc1) for RT-qPCR in Trichoderma reesei, replacing the unreliable act1 and sar1.
Findings
Five new reference genes were identified and validated as more stable than act1 and sar1.
The gene bzp1 was found to be the most stable reference gene across conditions and strains.
act1 and sar1 showed significant strain- and condition-dependent variability, making them unsuitable as universal references.
Abstract
Trichoderma reesei is a well-established industrial enzyme producer and has been the subject of extensive research for various applications. The basis of many research studies is the analysis of gene expression, specifically with RT-qPCR, which requires stable reference genes for normalization to yield reliable results. Yet the commonly used reference genes, act1 and sar1, were initially chosen based on reports from the literature rather than systematic validation, raising concerns about their stability. Thus, properly evaluated reference genes for T. reesei are lacking. In this study, five potentially new reference genes were identified by analyzing publicly available transcriptome datasets of the T. reesei strains QM6a and Rut-C30. Their expression stability was then evaluated under relevant cultivation conditions using RT-qPCR and analyzed with RefFinder. The two most stable…
Genes, proteins, chemicals, diseases, species, mutations and cell lines named across the full text — each resolved to its canonical identifier and authoritative record.
Click any figure to enlarge with its caption.
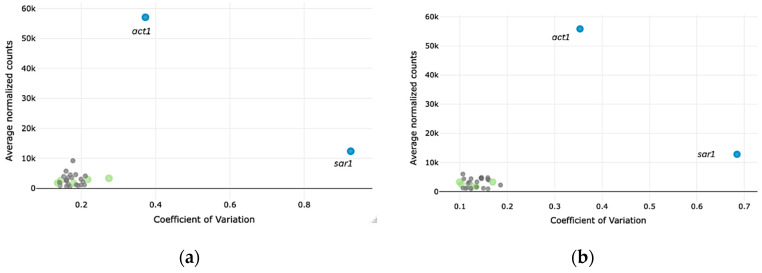 Figure 1
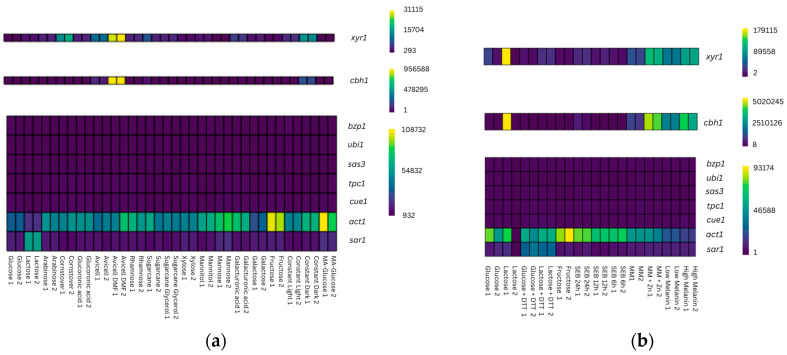 Figure 2
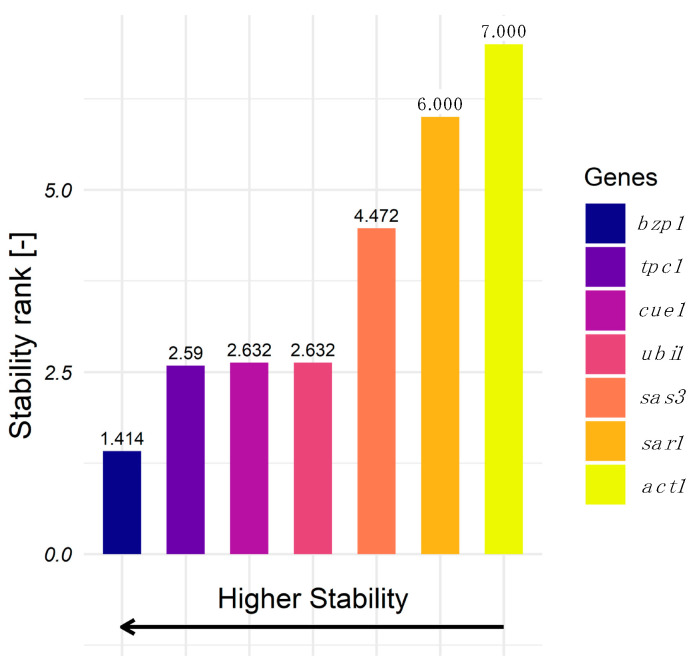 Figure 3
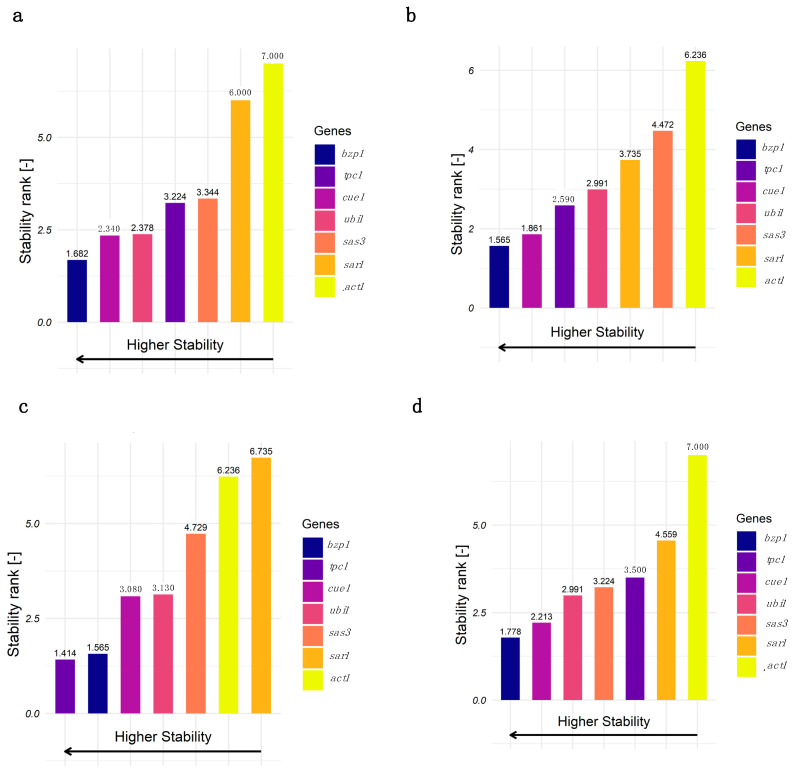 Figure 4
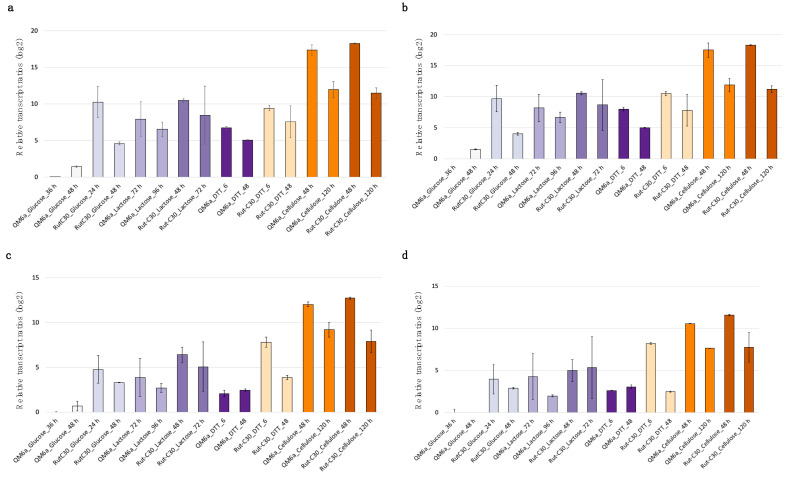 Figure 5
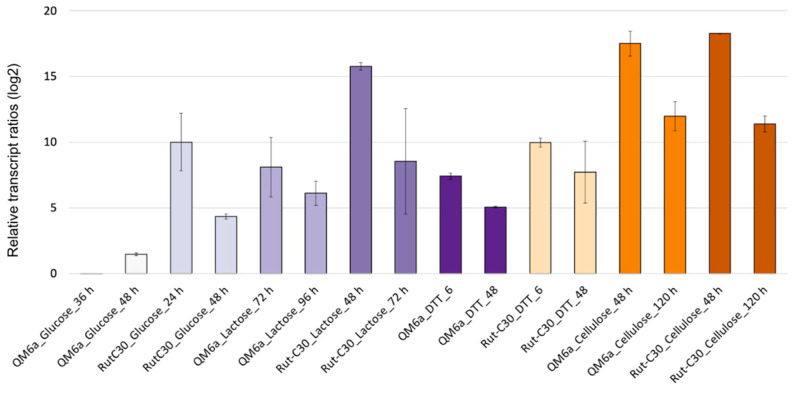 Figure 6
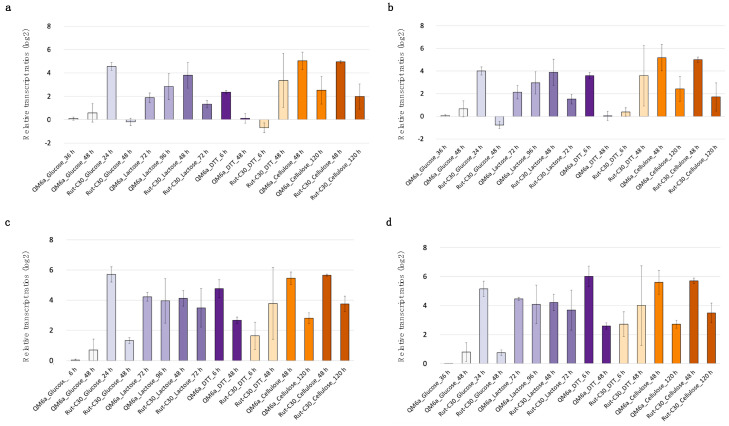 Figure 7
- —TU Wien
Peer Reviews
No public reviews on file for this paper yet. If you reviewed it on a platform where reviews are public (OpenReview, ICLR, NeurIPS, ICML), you can paste yours below so the community can read it here.
Videos
No videos yet. Explain this paper in a talk, walkthrough, or lecture? Add one.
Taxonomy
TopicsMolecular Biology Techniques and Applications · RNA Research and Splicing · Virus-based gene therapy research
1. Introduction
Trichoderma reesei is of high industrial and scientific relevance due to its ability to produce and secrete enzymes, such as cellulases and hemicellulases, in large quantities [1]. These enzymes convert lignocellulose into mono- or oligomeric sugars, which are valuable for bioethanol production and are needed in the paper and textile industries and the food sector [2]. To maximize their industrial potential, optimizing enzyme production and bioprocess efficiency is important. Gene expression analysis plays a key role in understanding the regulation of enzyme expression in T. reesei and enables targeted strain engineering for enhanced production [3].
Gene expression analysis studies the transcript levels of specific genes or entire transcriptomes to identify differences between conditions or organisms. The basic principle behind different methods is to detect and quantify RNA either directly or indirectly [4,5]. Traditional methods like Northern blot analysis and RNase protection assays have been replaced by more recent techniques such as DNA microarrays, quantitative PCR (qPCR), and whole transcriptome sequencing (WTS) [6,7,8]. While microarrays enable high-throughput analysis, WTS has revolutionized the field by providing a comprehensive, high-resolution view of transcriptome-wide gene expression. Combined with bioinformatics, the later method facilitates the identification of differentially expressed genes, novel transcripts, and key regulatory networks [9].
Among these techniques, reverse transcription–quantitative PCR (RT-qPCR) has become a widely used method due to its high sensitivity, specificity, and cost-effectiveness. RT-qPCR enables the quantification of gene expression by converting RNA into complementary DNA (cDNA) before amplification [10,11]. Reliable reference genes are essential for accurate gene expression quantification [12]. The minimum information for publication of quantitative real-time PCR experiments (MIQE) guidelines emphasizes the importance of selecting reference genes with stable expression across various conditions and relatively high expression and expression levels comparable to the target genes [13]. Computational tools like Genorm [14], Normfinder [15], and BestKeeper [16] or the comparative ΔCt-method [17] help assess gene stability, while WTS has enabled the discovery of novel reference genes [18].
Initially, reference genes for RT-qPCR were selected based on the assumption that their expression remains stable under all experimental conditions [19]. Therefore, housekeeping genes, such as those coding for actin or GAPDH, and ribosomal RNAs are commonly used, as they are involved in essential cellular functions [20]. Often, these genes were not thoroughly characterized in terms of their expression stability. In T. reesei, a study in 2010 identified sar1 as the most stable reference gene among a limited set of candidates that were reported to be stable in other filamentous fungi [21]. Act1 and sar1 have since then been commonly used as reference genes in T. reesei, despite a limited understanding of their regulation. Recently, studies on filamentous fungi and yeasts have demonstrated that some classical housekeeping genes fail to meet the stability requirements for reference genes, and new, more suitable candidates were discovered. For example, Tao et al. found that traditional reference genes were unsuitable for Volvariella volvacea and identified better-performing alternatives [22]. Similar studies on Amylostereum areolatum [23] and Komagataella phaffii (Pichia pastoris) [24] also identified new reference genes, suggesting that more appropriate candidates for T. reesei may still be discovered.
In this study, we aimed to identify alternative reference genes for T. reesei and evaluated the stability of act1 and sar1. Using publicly available WTS datasets from the T. reesei strains QM6a and Rut-C30 under various growth conditions, we identified the most stably expressed genes based on their coefficient of variation (CV), expression levels, and biological function. Five potential reference genes were selected and validated for RT-qPCR using RefFinder [25] with biological samples from QM6a and Rut-C30 cultivated under different conditions, including osmotic and endoplasmic reticulum (ER) stress. The application of the two most promising candidates as reference genes was shown for RT-qPCR in T. reesei by normalizing cbh1 expression. In addition, we provide the first evidence that act1 and sar1, despite their common use, are not universally stable reference genes. Finally, we compared their performance as reference genes with the newly identified candidates under cultivation conditions relevant to cellulase expression and assessed their own expression by normalization using the new reference genes.
2. Materials and Methods
2.1. Fungal Strains
The following T. reesei strains were used for this study: the wild-type strain QM6a (ATCC 13631) and the strain Rut-C30 (ATCC 56765) [26], which is described as hypercellulytic and was derived by two rounds of random mutagenesis and screening from QM6a. The strains were maintained on potato dextrose agar plates. For short-term storage, the strains were kept on plates at 4 °C and, for long-term storage, as spore suspensions in 25% glycerol at −80 °C.
2.2. Transcriptome Dataset Processing and Analysis
Publicly available WTS datasets of T. reesei strains QM6a and Rut-C30 were retrieved from the EBI FTB database of NCBI [27]. Table A1 and Table A2 in the Appendix A provide an overview of the experimental conditions and technical specifications of these datasets.
The raw reads were processed to obtain raw counts using HISAT2 (v2.2.1) [28], SAMtools (v1.16.1) [29], and featureCounts (v2.0.3) [30,31] in the UNIX-based Debian 12 operating system. The DeSeq2 (v1.14.0) [32] package was used to normalize the raw counts in RStudio (v2024-04-2 Build 764) and then exported as Excel files.
The required genomes and respective annotations QM6a (GenBank GCA_000167675.2) and Rut-C30 (GenBank GCA_000513815.1) were retrieved from GenBank. To enable a direct comparison of gene expression between QM6a and Rut-C30 despite their different annotation, a list of orthologous genes was created in Debian using gffread (v0.12.7) [33] and BLAST (v2.15.0) [34], both installed via the Bioconda package manager (v3.3.1). An exemplary script that was used for all those steps can be found in Appendix B.
Finally, to compare gene stability, the CV was calculated for each gene present in the datasets. Then, the candidate housekeeping genes were selected based on a low CV and a high expression as described in the MIQE guidelines [13].
2.3. Cultivation Conditions
To test the differential expression of the new candidate reference genes in common lab experimental conditions, different cultivation conditions typically used for T. reesei were tested. This included the use of various carbon sources, cultivation scales, cultivation times, and two common stress conditions. A total of 10^9^ spores per liter (final concentration) were used to inoculate biological duplicates of each condition.
For direct cultivations, the strains were cultivated in 250 mL or 1 L shake flasks at 30 °C and 180 rpm in 50 mL or 200 mL Mandels–Andreotti (MA) medium supplemented with 1% carbon source (glucose, lactose, xylan, glycerin, and cellulose) for 24 to 120 h depending on the carbon source.
To simulate two common occurring stress conditions, osmotic stress, and ER stress, the strains were cultured as described above in MA medium with 1% glucose or lactose, respectively. To induce osmotic stress, concentrated sodium chloride (NaCl) solution was added after 48 h to a final concentration of 1 M. To mimic ER stress, dithiothreitol (DTT) was added after 72 h to a final concentration of 20 mM.
Samples were harvested at two time points depending on the used strain and growth condition to reflect both early and late growth stages. An overview of all growth conditions and harvesting time points can be found in Table 1.
Sample volumes ranged from 2 to 12 mL, depending on the growth stage and mycelium density. Mycelia were obtained by filtration with a textile filter (Miracloth, Calbiochem, San Diego, CA, USA), washed with ultra-pure sterile water, and shock-frozen and stored in liquid nitrogen until RNA extraction.
2.4. RNA Extraction
RNA was extracted from approximately 100 mg of frozen mycelium placed in screw-cap tubes containing 1 mL RNAzol, along with 0.37 g small glass beads (0.1 mm diameter), 0.25 g medium glass beads (1 mm diameter), and one large glass bead (5 mm diameter). The mycelia were homogenized using a FastPrep^®^-24 (MP Biomedicals, Santa Ana, CA, USA) at intensity level 6 for 30 s. After homogenization, the tubes were incubated at room temperature for 5 min, then centrifuged at 12,000× g for 5 min. RNA was eluted with 30 µL RNase-free water, and its concentration and purity were assessed using a NanoDrop OneC spectrophotometer (Thermo Fisher Scientific, Waltham, MA, USA). RNA purification was performed using the RNA extraction kit from Zymo Research (Zymo Research, Tustin, CA, USA), following the manufacturer’s protocol.
2.5. cDNA Synthesis
RNA samples containing 500 ng total RNA were transcribed to cDNA using the LunaScript^®^ RT SuperMix kit (New England Biolabs, Ipswich, MA, USA) on a T100 Thermal Cycler (Bio-Rad Laboratories, Hercules, CA, USA) according to the manufacturer’s guidelines. The resulting cDNA was diluted 1:50 with ultrapure water for direct usage in qPCR or storage at −20 °C.
2.6. qPCR
The stability of the candidate reference genes was compared to the commonly used housekeeping genes act1 and sar1 by qPCR. For this, the Luna^®^ Universal (RT)-qPCR kit (New England Biolabs, Ipswich, MA, USA) was used following the manufacturer’s guidelines. Each reaction consisted of 2 µL of diluted cDNA as a template and 13 µL of master mix, and measurements were performed in technical duplicates. A QIAgility pipetting robot (QIAGEN, Hilden, Germany) was used for the automated preparation of the qPCR reaction mixes. For every primer pair a no-template control was prepared. The standard Luna^®^ qPCR cycle was performed using a Rotor-Gene Q system (QIAGEN, Hilden, Germany) with version 2.3.1 software. The primer sequences can be found in Table 2. Primer specificity was assessed by melting curve analysis. Additionally, the qPCR product size was verified on an agarose gel and confirmed by sequencing. PCR efficiencies were calculated through the Rotor-Gene software for every run and all were above 1.74.
2.7. Data Analysis
To evaluate gene stability, the resulting Ct values from the qPCR were processed with RefFinder [25]. This online tool combines four computational methods, the comparative ΔCt-method [17], BestKeeper [16], Normfinder [15], and Genorm [14], to calculate a final ranking that allows to compare gene expression stability. The individual rankings and calculated values that led to the final composite score of RefFinder are reported in the Appendix B in Table A4. In addition to a combined result of all cultivation conditions, we formed different data subsets to assess eventual gene stability differences depending on the used strains or early and late time points.
3. Results
3.1. Identification of New Candidate Reference Genes for T. reesei Using WTS Data
In the past, reference genes were selected for validation mainly based on reports from the literature. Nowadays, the availability of WTS data allowed us to select new candidate reference genes based on the MIQE guidelines [13] through bioinformatic analysis of such available WTS datasets for the T. reesei strains QM6a and Rut-C30. Potentially suitable reference genes were filtered for a low CV and a medium to high average expression. This approach already revealed many genes that appeared more stable than the commonly used genes for normalization of qPCR data, act1 and sar1. Figure 1 shows the CV plotted against the average expression of the 25 most stable ranked genes and of act1 and sar1. All of the 25 have a much lower CV than act1 and sar1.
Based on these results and in consideration of the function of those genes, five candidate genes were chosen for further validation using RT-qPCR. The gene bzp1 was annotated in NCBI as a protein of unknown function. Through eggnog [35], gene orthologs were identified in multiple filamentous fungi from the subdivision pezizomycotina (a division of Ascomycota), and over String-db.org [36] and Uniprot, the protein structure and clusters of interacting proteins were analyzed. The protein structure prediction resulted in a bZIP domain. An orthologue in Fusarium oxysporum f. sp. cubense was assigned the name “bZIP domain-containing protein” by Guo L. et al. [37]. Thus, this name was adopted for the gene of T. reesei. The bZIP domain has DNA binding properties and proteins with this domain are usually transcription factors. In some filamentous fungi, bZIP transcription factors are related to the regulation of stress responses [38,39]. Connections to histone H4, several chromatin remodeling proteins, and arginine methyltransferase were found. Therefore, it could be hypothesized that it is a factor in the process of histone methylation.
The gene tpc1 includes a Gryzun domain, which is reported to be responsible for protein trafficking through membranes [40]. Both cue1 and ubi1 are part of the ubiquitination process. The gene product of cue1 contains the so-called CUE domain, which is conserved in Ascomycota and exhibits weak ubiquitin-binding properties. Proteins containing this domain are reported to participate in intramolecular monoubiquitylation [41]. The gene ubi1 encodes a ubiquitin-activating enzyme (E1) with the subunit UBA2 and is involved in ubiquitination and subsequent protein processing [42]. The gene sas3 encodes a histone acetyltransferase with a conserved MYST domain and is involved in the activation of gene transcription [43]. Information on those genes and their respective CV values can be found in Table 3.
Act1 and sar1 are regulated in both T. reesei strains, QM6a and Rut-C30, depending on the cultivation condition according to available WTS data. Figure 2 provides the expression heatmaps of the five candidate reference genes, along with act1, sar1, and the genes cbh1 and xyr1 for QM6a and Rut-C30. The latter genes were used as control genes since their expression is well studied [44,45,46] and they are expected to give differences in expression in the used datasets. Figure 2 clearly illustrates that act1 has a differential expression across many conditions, while sar1 varies in some. In contrast, the new candidate reference genes maintain consistent expression levels across all conditions of the datasets.
3.2. Evaluation of Gene Expression Stability Using RT-qPCR and RefFinder
The applicability of the five identified candidate reference genes for gene expression analysis was assessed by RT-qPCR. For this purpose, a sample set was created by using two T. reesei strains (QM6a and Rut-C30), a range of different carbon sources, cultivation stages, and stress conditions. The Ct values obtained were analyzed with RefFinder [25], a tool that combines four algorithms for analyzing expression stability, resulting in a stability ranking. Figure 3 shows the gene expression stability ranking of the candidate reference genes and of the commonly used genes for normalization, act1 and sar1. Out of the seven tested genes, bzp1, followed by tpc1, had the lowest variability and, thus, the most stable transcript levels.
The gene expression stability ranking was found to be overall consistent with slight changes when the data were split into different subgroups. Figure 4 shows the stability rankings separately for samples from QM6a and Rut-C30, and early and late cultivation time points. Only minor strain-specific changes in the gene expression stability rankings could be found. Bzp1 and cue1 are the two most stable genes in both QM6a and Rut-C30, and the other tested genes showed only slight differences in their ranking comparing the two strains. However, there are some interesting differences depending on the cultivation stage. In early cultivation stages, tpc1 is the most and sar1 the least stable gene, whereas in later cultivation stages, bzp1 and cue1 are the most stable genes, and tpc1 is the third least stable. Despite these differences, bzp1 is always ranked in first or second place, and act1 and sar1, apart from one exception, in the last two.
3.3. Use of bzp1 and tpc1 as Reference Genes for Analyzing Gene Expression Using RT-qPCR
The RT-qPCR evaluation with RefFinder showed that all five selected genes are more stable than act1 and sar1. Therefore, all of them could potentially serve as new reference genes. To exemplarily demonstrate their suitability for gene expression normalization, we selected bzp1 and tpc1 as they ranked as the two best genes in the all-condition stability ranking. Their performance was assessed by normalizing the expression of the well-characterized cbh1 gene and comparing the results to the normalization with the commonly used reference genes act1 and sar1.
For QM6a, cbh1 expression is expected to be repressed by glucose, moderately induced by lactose, and strongly induced by cellulose [47,48]. In Rut-C30, a similar pattern is anticipated with the difference in a partial de-repression under glucose [26,49]. Under DTT-induced stress, cbh1 mRNA levels are expected to decrease [50]. Figure 5 presents the cbh1 transcript levels, normalized with both the new candidate reference genes (bzp1 and tpc1) and the traditional ones (act1 and sar1), using QM6a cultivated in glucose for 36 h as the reference condition. The overall expression pattern is similar, using bzp1 or tpc1 genes for normalization, and a similar pattern is also obtained by using act1 or sar1. However, differences can be seen when comparing the pattern yielded using bzp1 or tpc1 compared to the pattern yielded by act1 or sar1. For example, when ER stress is induced using DTT, differences arise. In QM6a at an earlier cultivation stage with DTT, cbh1 expression appears higher when normalized with bzp1 or tpc1, whereas normalization with act1 and sar1 suggests no significant change. In contrast, in Rut-C30, cbh1 expression remains similar across time points when normalized with bzp1 and tpc1, but when normalized with act1 and sar1, it appears lower at the later stage compared to the beginning of cultivation. Also, the relative transcript ratios for all conditions are lower after normalization with act1 and sar1 compared to bzp1 and tpc1 (Figure 5). The combined use of bzp1 and tpc1 for normalization yields a highly similar result (Figure 6) compared to normalization with bzp1 or tpc1 alone (Figure 5a,b).
To finally clarify the potential regulation of the commonly used reference genes act1 and sar1, their transcript levels were analyzed analogously using the bzp1 and tpc1 genes for normalization. The transcript patterns provided in Figure 7 reveal that both act1 and sar1 display differential expression depending on the strain and cultivation conditions. For example, in QM6a, act1 and sar1 show higher expression after 6 h in lactose with DTT compared to 48 h, while the opposite can be found in Rut-C30. This suggests that act1 and sar1 may be subject to strain-specific regulation in response to ER stress. This variation in regulation could explain the discrepancies observed in cbh1 transcript normalization when using act1 and sar1 compared to the more stably expressed bzp1 and tpc1. Generally, act1 expression shows a more pronounced variation, aligning with the earlier findings from the WTS data analysis. Most importantly, the obtained act1 and sar1 expression patterns remain widely the same regardless of whether bzp1 or tpc1 was used as the gene for normalization, making them both ideal candidates as reference genes.
4. Discussion
Reference genes are essential for a reliable transcript analysis via RT-qPCR. The transcript abundance of a good reference gene represents the amount of isolated RNA and reversed transcribed cDNA and accounts for differences in RNA extraction and cDNA transcription efficiency. Using genes with fluctuating transcript levels causes an inaccurate interpretation of the expression of the target gene [51]. In the past, reference genes were selected mainly based on reports from the literature, followed by a characterization of their expression stability in a limited number of samples. For T. reesei, the genes act1 and sar1 were selected in this way and are, until now, commonly used for normalization. In this study, we identified novel reference gene candidates and characterized the expression stability of act1 and sar1 using publicly available WTS datasets from T. reesei strains QM6a and Rut-C30.
The commonly used genes act1 and sar1 are not universally stable, and therefore, they are not suitable as reference genes for every condition. This finding is in accordance with other reports from the literature showing that conventionally used reference genes differ in mRNA expression depending on cultivation conditions [52,53]. Several times act1 was found to be differentially expressed in various conditions and, therefore, revealed to be unreliable as an internal reference for gene expression studies [24,51,54,55]. Actin was shown to be differentially expressed during growth or in response to biochemical stimuli, stress, and disease states [12,56]. In Trichoderma atroviride, both act1 and sar1 were observed to be less stable than other reference genes tested [52]. A study in 2015 tried to track the best reference genes for all filamentous fungi and found that actin is differentially regulated but identified sarA genes as promising candidates [57].
We would recommend validating the choice of reference genes for every experimental setup as it directly influences the study results. For example, we found that there seems to be a strain-specific regulation of act1 and sar1 in response to ER stress. Using act1 and sar1 for normalization would lead to an underestimation of cbh1 transcript levels in the case of QM6a. Using regulated genes for normalization would cause a misinterpretation of target gene transcript abundance in these conditions and result in wrongfully drawn conclusions. The implications of misinterpreted expression data were also found in other studies [52,58,59,60]. For example, the use of sar1 for normalization resulted in an overestimation of transcript levels of pks4 (polyketide synthase) and lox1 (lipoxygenase encoding gene) in T. atroviride [52]. Further, we identified some minor cultivation time and strain-specific effects on the stability of the reference genes we evaluated. Therefore, we want to emphasize that a reference gene must be rigorously tested for stability before being used in a new organism, strain, or experimental setup.
A key challenge in gene expression studies is the selection of new, reliable reference genes for accurate normalization. The approach in this study was to analyze public WTS data to identify five genes with high expression stability across two strains of T. reesei under various cultivation conditions. We confirmed a highly similar ranking of these genes regarding expression stability by RT-qPCR. The genes bzp1 and tpc1 were identified as the most stable, outperformed act1 and sar1, and yielded reliable results when used for normalization. This underlines the accuracy of the chosen approach and is in accordance with other studies using WTS data to identify new reference genes [24,61].
Also, in other important fungal species, traditional reference genes are increasingly replaced by genes that were identified by omics-driven approaches. In Aspergillus, WTS analyses have identified, ubiquitin- and proteasome-related genes, amongst other candidates, as stable references. However, these were not experimentally validated [62]. In F. graminearum, a transcription factor was identified as one of the most stable genes using WTS data and found to be more stable than the traditionally used GAPDH [63]. That mirrors the identification of bzp1 (transcription factor), tpc1 (protein transport), and cue1/ubi1 (ubiquitination) as stable candidates in T. reesei and emphasizes the potential of these genes for reliable normalization.
The consistent expression of tpc1, cue1, ubi1, and sas3 is not unexpected, given their fundamental roles in cellular processes, and they fit into the type of commonly chosen reference genes. Sas3 encodes a histone acetyltransferase and is involved in gene transcription regulation, which is continuously required for cellular functionality [43]. Tpc1 is involved in protein trafficking, which is critical for maintaining cellular homeostasis under different conditions. To support cell viability and adaptation, its expression must be consistently maintained across different environmental and physiological states [40]. This central role in cellular logistics may explain the stable expression of tpc1 and make it a promising candidate for a reference gene. Similarly, cue1 and ubi1 are part of the ubiquitination pathway, participating in protein regulation and degradation, which is equally vital for cellular adaptation and maintenance [41,42]. Their involvement in conserved mechanisms suggests their expression must remain relatively stable to ensure correct protein turnover.
Interestingly, bzp1 was the most stably expressed gene, even though it could potentially be a transcriptional factor [38]. At first glance, using transcription factors as reference genes could be debatable, given their potential regulation of gene expression in specific conditions. On the other hand, it is not surprising to find a transcription factor having a stable transcript level because its regulation likely will not be on the transcriptional level. The abundance and the activity of a transcription factor can be controlled at various stages, from transcription to translation and posttranslational modifications [64,65]. In particular, the regulation at a late stage allows a transcription factor to exert its function fast after the receipt of a certain signal. One main reason why transcription factors initially might not have been commonly used as reference genes is that they are often expressed at low levels [66]. However, with PCR-based techniques, this is not a limitation anymore. The consistent expression observed within our tested conditions suggests that external factors do not strongly influence the gene expression of bzp1. Therefore, it is considered reliable for RT-qPCR normalization in T. reesei.
Tpc1 and bzp1 are likely conserved, as homologs were identified in other filamentous fungi within the pezizomycotina, including A. niger, T. harzianum, T. aggressivum, and Aureobasidium pullulans. In addition, bzp1 orthologs were found also in F. oxysporum, Penicillium flavigenum, and other Trichoderma species. The presence of these orthologs further supports that tpc1 and bzp1 fulfill essential cellular roles and suggests that they could potentially be used as reference genes in other species as well.
Further validation is required to confirm the robustness of bzp1 and tpc1 as universal reference genes and their applicability in other related species. In general, it is unlikely that a universally applicable reference gene for all organisms and conditions exists. As discussed above, gene expression can differ between species depending on environmental conditions. So, even if bzp1 and tpc1 may not serve as universal reference genes, their reliable expression within defined conditions makes them valuable normalization candidates.
In essence, we consider both bzp1 and tpc1 to be suitable references for relative transcript analyses in T. reesei and suggest using them in combination, as recommended by the MIQE guidelines [13]. Additionally, we discourage using act1 and sar1 in T. reesei and always recommend validating reference genes in a new experimental setup.
The reference list from the paper itself. Each links out to its DOI / PubMed record.
- 1Fischer A.J. Maiyuran S. Yaver D.S. Industrial Relevance of Trichoderma Reesei as an Enzyme Producer Methods Mol. Biol.20212234234310.1007/978-1-0716-1048-0_233165776 · doi ↗ · pubmed ↗
- 2Bhat M.K. Cellulases and Related Enzymes in Biotechnology Biotechnol. Adv.20001835538310.1016/S 0734-9750(00)00041-014538100 · doi ↗ · pubmed ↗
- 3Fonseca L.M. Parreiras L.S. Murakami M.T. Rational Engineering of the Trichoderma Reesei RUT-C 30 Strain into an Industrially Relevant Platform for Cellulase Production Biotechnol. Biofuels 2020139310.1186/s 13068-020-01732-w 32461765 PMC 7243233 · doi ↗ · pubmed ↗
- 4Singh K.P. Miaskowski C. Dhruva A.A. Flowers E. Kober K.M. Mechanisms and Measurement of Changes in Gene Expression Biol. Res. Nurs.20182036938210.1177/109980041877216129706088 PMC 6346310 · doi ↗ · pubmed ↗
- 5Lovén J. Orlando D.A. Sigova A.A. Lin C.Y. Rahl P.B. Burge C.B. Levens D.L. Lee T.I. Young R.A. Revisiting Global Gene Expression Analysis Cell 201215147648210.1016/j.cell.2012.10.01223101621 PMC 3505597 · doi ↗ · pubmed ↗
- 6Freeman W.M. Robertson D.J. Vrana K.E. Fundamentals of DNA Hybridization Arrays for Gene Expression Analysis Biotechniques 2000291042105510.2144/00295 rv 0111084867 · doi ↗ · pubmed ↗
- 7Ma Y. Dissen G. Rage F. Ojeda S. R Nase Protection Assay Methods 19961027327810.1006/meth.1996.01028954837 · doi ↗ · pubmed ↗
- 8Kukurba K.R. Montgomery S.B. RNA Sequencing and Analysis Cold Spring Harb. Protoc.2015201595196910.1101/pdb.top 08497025870306 PMC 4863231 · doi ↗ · pubmed ↗