Comparative Mitochondrial Genome Analysis of the Intestinal Schistosomiasis Snail Host Biomphalaria pfeifferi from Multiple Populations in Gezira State, Sudan
Arwa Osman, Peter S. Andrus, Xianglu Zhu, Zhaoyang Dong, Yunhai Guo, Bakri Y. M. Nour, Xiaonong Zhou, Liming Zhao

TL;DR
This study analyzes the mitochondrial genomes of snails in Sudan to understand their genetic diversity and evolutionary relationships.
Contribution
The first sequencing of 27 complete mitochondrial genomes from seven Biomphalaria pfeifferi populations in Sudan.
Findings
All 27 mitogenomes had conserved gene content and similar nucleotide composition.
Phylogenetic analysis revealed distinct genetic lineages among populations, suggesting potential subspecies.
Protein-coding genes showed negative selection with some variation in nad3.
Abstract
Biomphalaria pfeifferi is a key intermediate host for Schistosoma mansoni transmission in Sudan. In total, 27 complete mitochondrial genomes from seven B. pfeifferi populations in Gezira State, Sudan, were sequenced for the first time to investigate their population structure and phylogenetic relationships. This involved comparing the nucleotide composition, codon usage, rRNAs, and tRNAs of the East Gezira (EG), South Gezira (SG), Hasahisa (HA), Greater Wad Medani (GW), Managil (MA), and North Umelgura (NU1, NU3) populations. All 27 mitogenomes (13,688–13,696 bp) contained 37 genes with conserved AT/GC content (76.7/23.4%). Phylogenetic analysis revealed that although samples clustered within the same clade, B. pfeifferi from EG, SG, NU1, and NU3 grouped closely with B. pfeifferi from Kenya, whereas HA and GW samples formed distinct ancestral lineages. The MA population exhibited unique…
Genes, proteins, chemicals, diseases, species, mutations and cell lines named across the full text — each resolved to its canonical identifier and authoritative record.
Click any figure to enlarge with its caption.
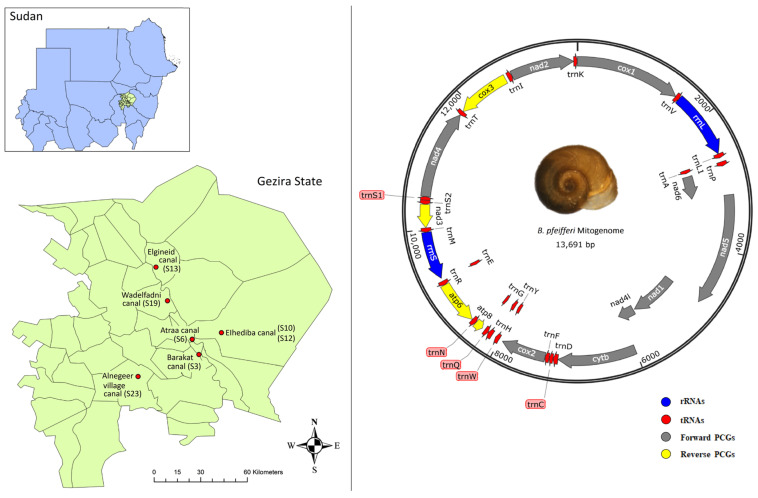 Figure 1
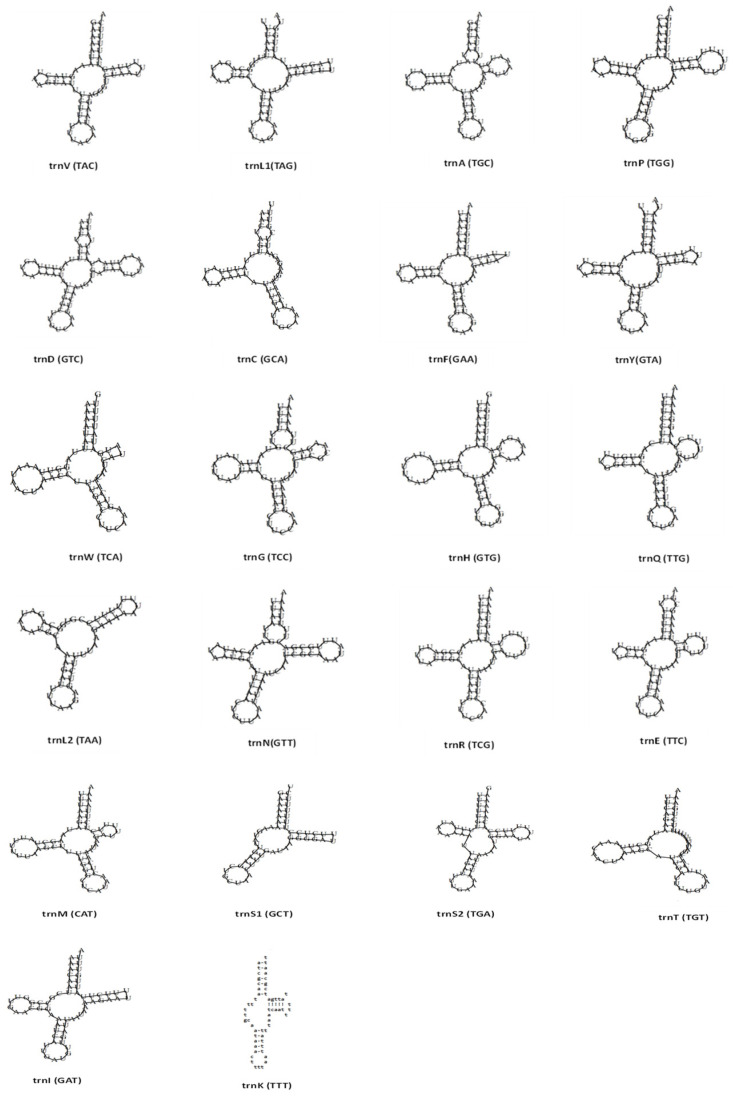 Figure 2
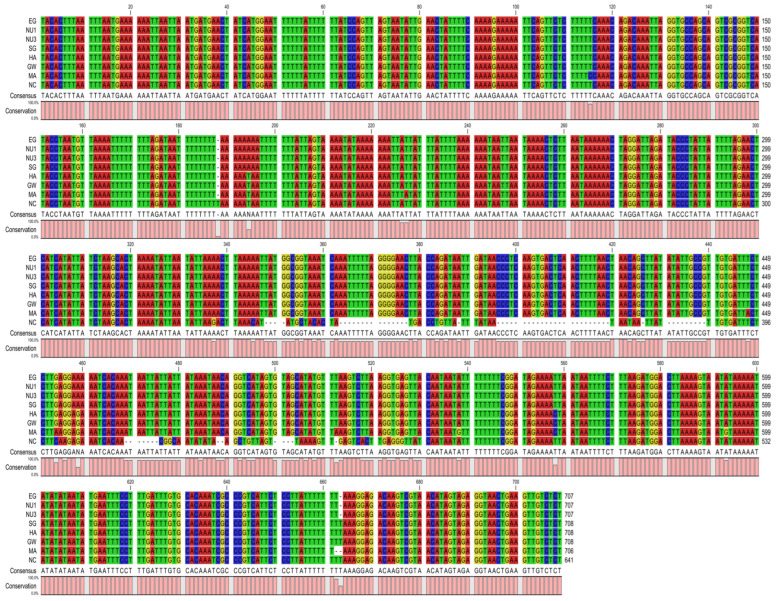 Figure 3
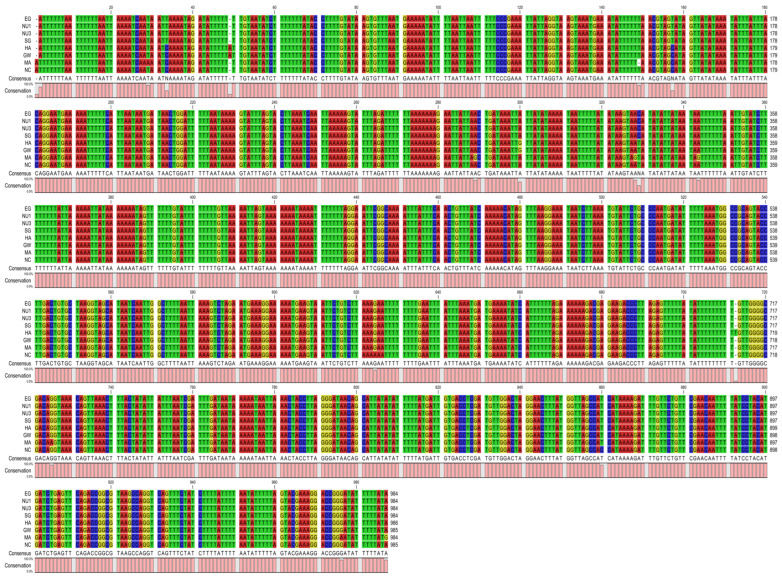 Figure 4
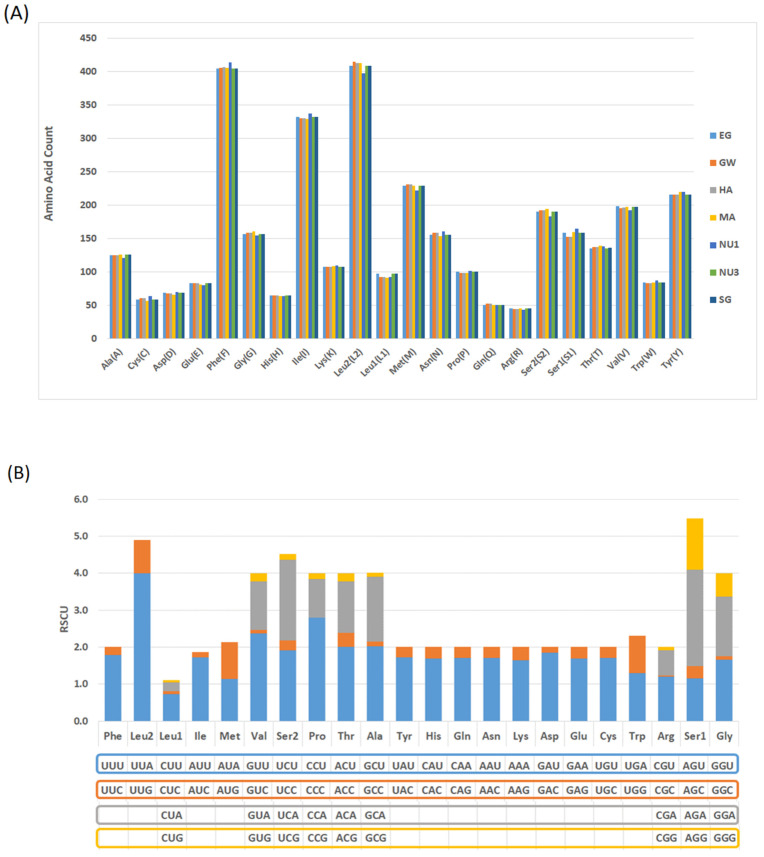 Figure 5
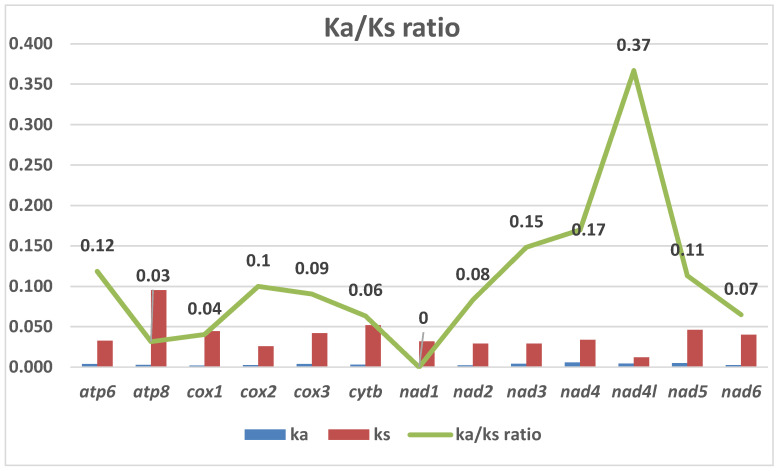 Figure 6
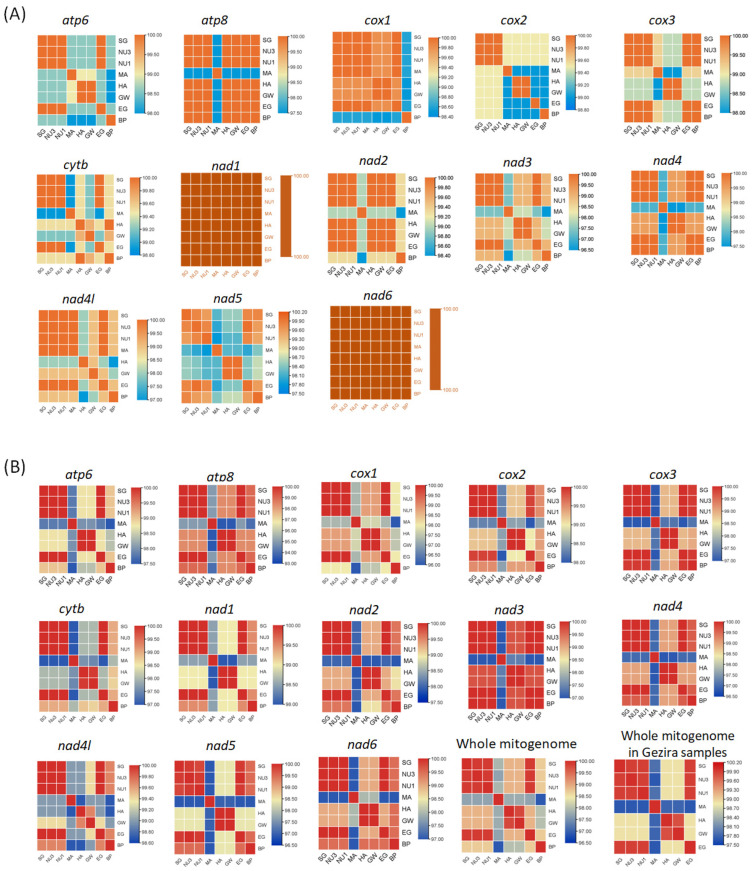 Figure 7
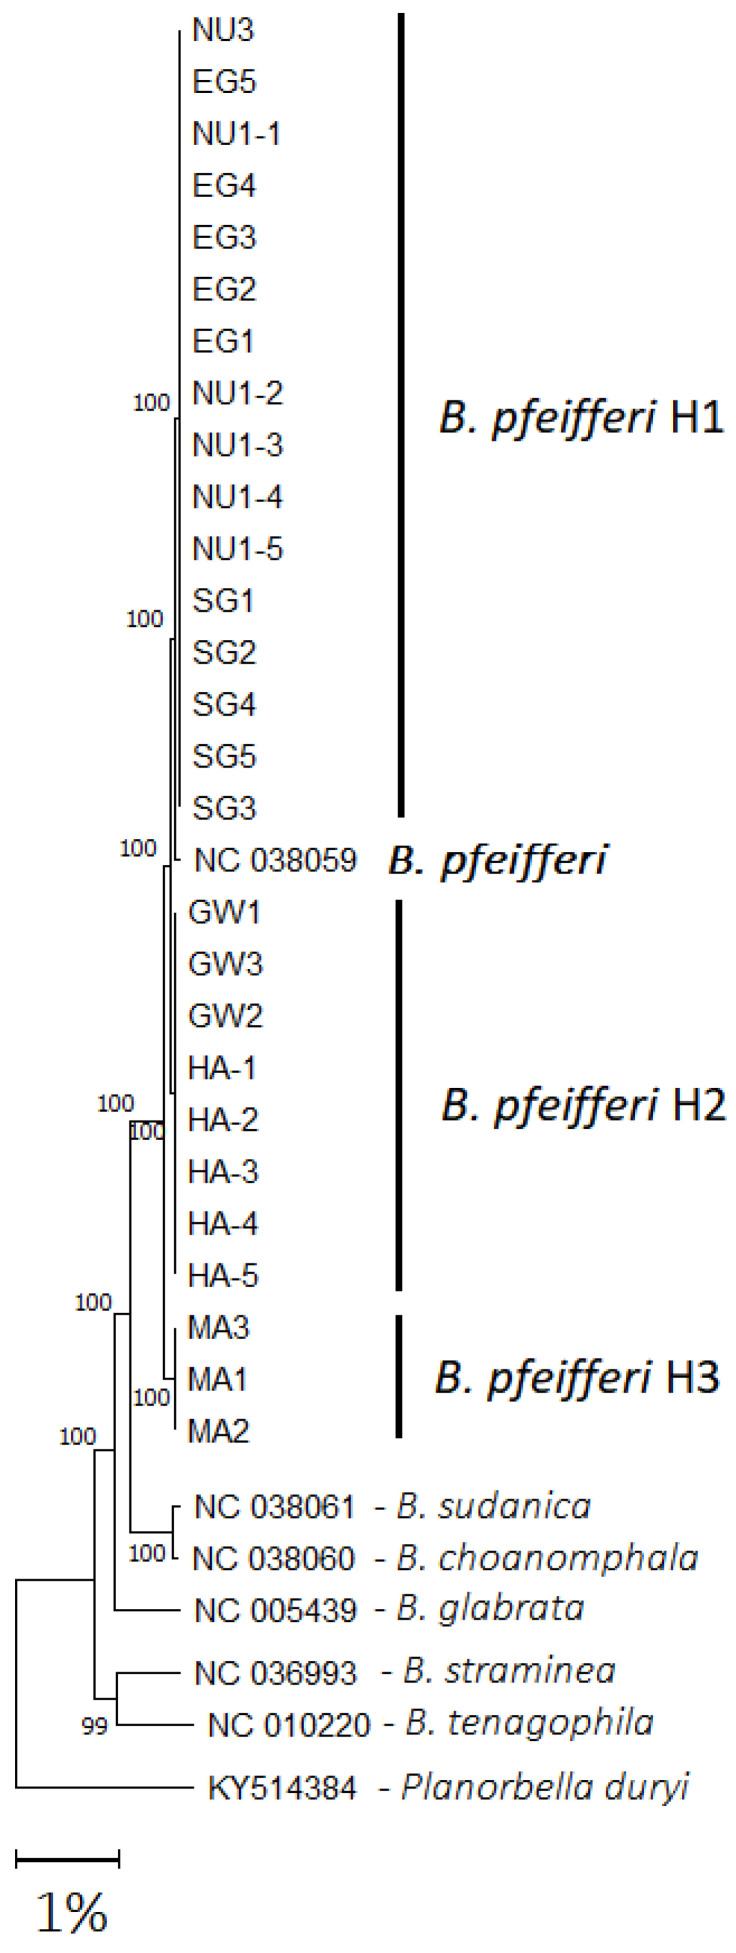 Figure 8
- —Shanghai Frontiers Science Center of Optogenetic Techniques for Cell Metabolism, the Shanghai Municipal Education Commission
- —National Key Research and Development Program of the Republic of China
- —Scientific Research and Innovation Directorate, Ministry of Higher Education and Scientific Research, Sudan
Peer Reviews
No public reviews on file for this paper yet. If you reviewed it on a platform where reviews are public (OpenReview, ICLR, NeurIPS, ICML), you can paste yours below so the community can read it here.
Videos
No videos yet. Explain this paper in a talk, walkthrough, or lecture? Add one.
Taxonomy
TopicsParasites and Host Interactions · Parasite Biology and Host Interactions · Zoonotic diseases and public health
1. Introduction
Biomphalaria (Gastropoda: Planorbidae) is a genus of freshwater snails responsible for the transmission of the parasitic blood fluke Schistosoma mansoni, the leading cause of intestinal schistosomiasis in humans [1,2,3]. Although the majority of African Biomphalaria species have been found naturally infected in the field, only 18 of the identified Biomphalaria species are susceptible to S. mansoni infection [1,4,5,6]. Phylogenetic studies of the African species found that only B. camerunensis and B. pfeifferi were well defined, while the six other Biomphalaria species (B. alexandrina, B. angulosa, B. choanomphala, B. smithi, B. stanleyi, and B. sudanica) formed a poorly defined group called the ‘Nilotic species complex’ [6,7]. In Sudan, B. pfeifferi and B. sudanica are the most important intermediate hosts of intestinal schistosomiasis. Biomphalaria pfeifferi has been reported in the past in different areas in Sudan, including the Blue Nile State, the White Nile State, North Sudan, and Gezira State [8,9,10,11,12]. At present, it is found in Gezira State [13,14,15], Kassala State [16,17], Gedarif State [18], Sennar State [19], White Nile State [20], and the River Nile State [21]. Intestinal schistosomiasis remains a major public health concern in Gezira State, and crucial integrated control measures are needed. A nationwide survey conducted in 2017 by the Federal Ministry of Health (FMOH), supported by the Korea International Cooperation Agency (KOICA) across the 18 States of Sudan, including Gezira State, where 106 schools and 6307 students were examined, reported S. mansoni prevalence as 2.6% [22]. In 2023, the prevalence increased to 8.6% in Gezira State in the follow-up survey by the FMOH and KOICA [personal communication]. The transmission of the disease is heavily dependent on the intermediate snail host’s (Biomphalaria spp.) presence in the Gezira State irrigation systems, as this provides an ideal breeding site for snails and disease transmission [5,12,23].
The mitochondrial genomes (mitogenomes) of gastropods exhibit similar structures, being composed of circular double-stranded DNA molecules that contain 13 protein-coding genes (PCGs), two ribosomal RNAs (rRNA), 22 transfer RNAs (tRNA), a potential control region (CR) [24], and a large number of overlapping gene boundaries [25]. The mitochondrial genome is a valuable tool for understanding evolution and phylogenetic relationships due to the preservation of its structure and composition [26]. This is due to mitochondrial genes having only maternal inheritance, a high mutation rate, and a low recombination rate, which make them an effective genetic marker to study species identification and phylogenetic relationships [27,28,29,30]. Several factors may contribute to the genetic structure of Biomphalaria populations, including self-fertilization, environmental conditions, host–parasite interactions, and parasitic infections [1,6,31,32,33,34]. Furthermore, periodic droughts and flooding in irrigation canals could have resulted in population bottlenecks, influencing genetic structure and diversity [2,31,35,36,37]. Various studies have examined the population structure and phylogeny of several Biomphalaria species utilizing mitochondrial gene fragments, such as the Cytochrome Oxidase Subunit I (COI) gene and the 16S ribosomal RNA (16S rRNA) component, as well as popular nuclear markers like the internal transcribed spacer (ITS1 and ITS2) sequences [2,7,31,38,39,40,41,42,43,44,45,46]. However, the utilization of the complete mitochondrial genome offers more insights than individual gene fragments in phylogenetic reconstruction studies [47]. The first mitogenome of the major schistosome-transmitting snail genera to be sequenced was Biomphalaria glabrata in 2004 (NC_005439; [48]), followed by Oncomelania hupensis in 2010 (NC_013187; [49]), and Bulinus truncatus in 2021 (MT947902; [50]). Subsequently, the annotated mitogenomes of several Biomphalaria species have been sequenced, such as B. glabrata, B. pfeifferi, and B. choanomphala [51], B. sudanica [51,52], B. tenagophila [53] and B. straminea [54]. Moreover, studies on the complete annotated genomes of B. glabrata [55,56,57], B. straminea [58] and B. pfeifferi [32] have also been published, which offer more insight into the phylogenetic relationships and evolutionary history of the genus.
Studying the genetic composition and population structure of Biomphalaria snails in Sudan is important, as the genetic diversity and constitution of a population can affect their susceptibility to schistosome infection, influence disease transmission rates, and can help the design of more effective control strategies. Therefore, the aim of this study was to sequence the whole mitochondrial genomes of multiple B. pfeifferi snails obtained from Gezira State, Sudan, to examine their population structure, and compare it to other Biomphalaria species.
2. Results
2.1. Mitochondrial DNA Characteristics, Structure and Organization
The mitochondrial assembly results showed that all of the 27 B. pfeifferi sequences obtained by NOVOPlasty were circular (Figure 1). The total sequence length of the mitogenomes ranged from 13,688 to 13,696 bp, with an average length of 13,692 bp. The genomic GC content was between 23.3% and 23.4%, with an average value of 23.35% (Table 1). The mitochondrial annotation results showed that the twenty-seven samples consisted of thirteen Protein Coding Genes (PCGs), twenty-two tRNA genes and two rRNA genes, giving a total of 37 genes. Nine protein-coding genes (nad5, nad1, nad4l, cytb, cox2, nad4, nad2, cox1, and nad6), the rrnL (16S rRNA) gene, and fourteen tRNA genes were located on the plus (heavy) strand, while four protein-coding genes (atp6, atp8, nad3 and cox3), the rrnS (12S rRNA) gene, and eight tRNA genes were located on the minus (light) strand. Of the 27 mitochondrial genomes, one sample from each of the seven areas was selected for further analysis due to high similarity among samples (Table 1). The total base pair composition of the entire mitogenome for the seven samples was almost identical, with A = 33.7–33.8%, T = 42.8–43%, C = 10.2–10.4%, and G = 13–13.1%. They had a high AT content of 76.6–76.7%, a GC content of 23.3–23.4%, a negative AT skew of ≈−0.12, and a positive GC skew of ≈0.11–0.12. The overall nucleotide composition was biased toward AT. The highest AT content (81.7–81.9%) was observed in nad2 and the highest GC content was observed in cox1 (29.1–30%). While the highest GC skew (0.36–0.37) was observed in the nad6 gene. The A + T content of the total rRNAs was higher than that of the total tRNAs and total PCGs. The AT skew was negative in all genes, and all PCGs showed positive GC skew values, except for atp6 and atp8, which showed negative values. However, the MA population showed a positive value in atp8 (0.032). In addition, only the MA sample showed a negative GC skew value in the nad3 gene (−0.031). The G + C content had equal values (9.3%) in sites EG, SG, NU1, and NU3, resulting in a GC skew of zero. Overall, the nucleotide compositions of the EG, SG, NU1, and NU3 samples were similar to each other. Likewise, the HA and GW samples were more similar to each other. Conversely, the MA sample showed different compositions in the atp6, atp8, nad1, nad2, nad3, and nad4 genes compared to the other populations (Table 1; Supplementary File S1; Table S1).
2.2. Overlapping and Non-Coding Regions
Non-coding regions were observed across the mitogenome and ranged from 1 to 41 bp in length. However, the number of intragenic regions varied between areas, ranging from 8 bp (NU1, SG), 9 bp (GW, HA, MA), 10 bp (NU3), and 11 bp (EG). The longest intergenic region in all samples (41 bp) was located between the cox3 and trnI (gau). This may serve as a transcriptional regulatory area, as it is characterized by high AT content and repetitive T stretches and forms a hairpin (stem-loop) structure, revealing conserved motifs resembling mitochondrial promoter elements. The number of overlapping regions was eight in samples EG, GW, HA, NU3, and MA, and nine in samples NU1 and SG. They ranged from 1 to 53 bp in all samples, with the longest overlap (53 bp) being the region of cytb overlapping nad4l (Supplementary File S2: Dataset S1).
2.3. Protein-Coding Genes (PCGs)
The total length of the 13 PCGs was 10,695 bp in all populations. The length of the 13 PCGs ranged from 123 bp (atp8) to 1656 bp (nad5). When comparing the start codons for each population, we found that all of the PCGs started with either ATT, ATG, or ATA codons, except for the cox1, which started with TTG. For the stop codons, six of the PCGs were terminated with TAA, six had incomplete stop codons (T), and one gene used TAG (Table 2, Supplementary File S2: Dataset S1). The standard invertebrate mitochondrial genetic code was used for all start and stop codons.
2.4. Transfer RNA and Ribosomal RNA Analysis
Nineteen out of the 22 tRNAs were successfully annotated using software, while three tRNAs (trnG, trnS2, and trnK) could not be detected automatically. This is likely due to the atypical and highly divergent structures of these tRNAs in gastropod mitogenomes compared to other animals. As a result, these three tRNAs were identified manually through nucleotide alignment using their counterparts in B. pfeifferi and B. sudanica mitogenomes [51]. The length of the 22 transfer RNA genes slightly varied between samples, ranging from 49 bp (trnK) to 70 bp (trnD). The overall AT content of the tRNAs ranged from 77.3% to 77.5%, showing an AT bias. When comparing the tRNA genes between our seven samples, we found that each corresponding amino acid is encoded by the same anticodon, except trnS1 (serine 1), which uses the anticodon GCT (Table 2). The majority of the B. pfeifferi tRNAs displayed a typical clover leaf secondary structure with four arms (acceptor, D, TΨC, and anticodon arms). However, structural anomalies were observed in several of the tRNAs across all populations. Specifically, the D-arm was absent in trnL2, trnK, and trnS1, while the TΨC-arm was missing in trnC and trnT. Additionally, a reduced TΨC-arm was observed in trnL1, trnS1, trnF, trnW, and trnI (Figure 2). These consistent structural deviations suggest potential modifications in tRNA processing or function in our Sudanese B. pfeifferi populations.
The 12S ribosomal RNA had a length ranging from 706 to 708 bp and was located between trnE and trnM. The 16S ribosomal RNA had a length ranging from 984 to 986 bp and was located between trnV and trnL1 (Table 2). The rRNAs had a nucleotide composition biased towards A and T with an AT percentage between 77.5 and 78%, and a GC percentage between 22.1 and 22.6% (Table 1). Their base compositions showed AT skew values of −0.019 to −0.027, and GC skew values of 0.095 to 0.098, indicating a bias towards T and G (Table 1). A pairwise comparison was calculated for the 12S and 16S rRNA genes to estimate the evolutionary divergence between B. pfeifferi populations. We found that 12S showed high divergence (0.063–0.072) when comparing our populations to the Kenyan B. pfeifferi (NC_038059), with the Kenyan B. pfeifferi sequence having 71 missing base pairs (Figure 3, Table 3). In contrast, divergence within the Gezira samples was low. For the 16S rRNA alignment and pairwise comparison data (Figure 4, Table 4), we found low divergence within the Gezira samples and in comparison to the Kenyan B. pfeifferi sequence (0.004–0.009). The higher similarity observed in the 16S rRNA likely reflects stronger functional constraints and negative selection maintaining its sequence conservation. Whereas the greater divergence in the 12S rRNA suggests a relatively relaxed selective pressure, allowing more variability such as structural deletions, particularly in comparisons with the Kenyan B. pfeifferi sequence.
2.5. Amino Acid Usage and the Relative Synonymous Codon Usage (RSCU) Analysis
The amino acid usage of B. pfeifferi from the seven sites indicated that Leu2, Phe, and Ile were the most frequently used amino acids, with minor count variation across populations. The least used were Arg, Gln, and Cys (as shown in Figure 5A; Supplementary File S3: Figure S1). The most frequently used codons were UUA-Leu2, CCU-Pro, and GUU-Val; they all ended with A or U and each had a RSCU value over 2 across all populations (Figure 5B). Nine amino acids (Leu1, Val, Ser2, Pro, Thr, Ala, Arg, Ser1, and Gly) were encoded by four codons, and thirteen were encoded by two codons (Phe, Leu2, Ile, Met, Tyr, His, Gln, Asn, Lys, Asp, Glu, Cys, and Trp; Figure 5B).
2.6. Non-Synonymous and Synonymous Substitutions (Ka/Ks Ratio) Analysis
The Ka/Ks ratio measures the rate of non-synonymous (amino acid-changing) substitutions (Ka) relative to synonymous (silent) substitutions (Ks) in protein-coding genes; ratios below 1 reflect negative (purifying) selection, where harmful mutations are eliminated to maintain protein structure and function, whereas ratios above 1 would indicate positive (diversifying) selection. Therefore, to assess the evolutionary dynamics and selection pressure in the B. pfeifferi mitogenomes, we calculated the Ka/Ks ratios for the 13 protein-coding genes (PCGs) from the seven Gezira State populations (Figure 6). Among these genes, the nad4l gene exhibited the highest Ka/Ks ratio (0.37), while the nad1 gene had the lowest (0.0). All Ka/Ks ratios were below 1; this indicates that all of the PCGs are evolving under negative selection, suggesting that deleterious mutations affecting protein function are being selectively removed.
2.7. Nucleotide and Amino Acid Identity Analysis
The heatmap analysis of pairwise comparisons in amino acid (AA) and nucleotide (NT) sequences (Figure 7) revealed distinct patterns of conservation and variability across the Gezira State populations. Highly conserved proteins were observed in the nad1 and nad6 genes (100%), despite nucleotide sequence variations among different areas. In contrast, the nad3 gene displayed some amino acid variability (96.5–100%) in the MA, HA, and GW populations compared to other populations. The MA population was the only group showing notable amino acid diversity in the atp8 gene (97.5%) (Figure 7A). At the nucleotide level, nad4l had the highest identity (98.7–100%), whereas atp8 had the lowest (93.5–100%; Figure 7B). Overall, populations from SG, EG, NU3, and NU1 exhibited high nucleotide identity (99.9%), whereas GW, HA, and MA showed slightly lower conservation (Figure 7B; Table 1). When compared to the B. pfeifferi reference genome (NC_038059), the whole mitogenome sequence identity was 98.7% for sites EG, SG, NU3, and NU1; 98.1% for sites HA and GW; and 96.9% for site MA, indicating greater divergence in the Managil population.
2.8. Phylogenetic Analysis
The new mitogenome sequences obtained in this study were deposited to GenBank under accession numbers PV213442–PV213448 and had total lengths ranging from 13,688 to 13,696 bp (Table 5). A maximum likelihood tree was generated using all 27 of our B. pfeifferi samples and six of the Biomphalaria spp. mitogenomes retrieved from NCBI, with Planorbella duryi as the out-group (Table 5, Figure 8). The 27 B. pfeifferi samples from Gezira made up three unique mtDNA haplotypes (H1, H2, and H3) and formed a clade with the Kenyan B. pfeifferi (NC_038059). Notably, sub-branches containing EG, NU1, SG, and NU3 (H1) were closest to the Kenyan B. pfeifferi sample. Conversely, GW and HA (H2) clustered together, suggesting a shared evolutionary history, while the MA samples (H3) showed the most unique genetic characteristics (Figure 8). Lastly, the topology and bootstrap values remained consistent for both the coding nucleotide sequence (NT), and the translated amino acid (AA) trees (Supplementary File S3: Figure S2).
3. Discussion
Differences in mitochondrial genome size, gene order, gene content, intergenic regions, repetitive sequences, and RNA secondary structures are key indicators of evolutionary relationships among species [30,60,61,62]. These mitogenomic variations often arise due to adaptive responses to environmental pressures [63]. Genomic research on the four major intermediate snail host genera (e.g., Bulinus, Biomphalaria, Oncomelania, and Neotricula) involved in human schistosomiasis transmission has progressed at different rates, largely driven by their importance in schistosome epidemiology and the availability of research funding. Notably, this study represents the first mitochondrial population genetic analysis of an African Biomphalaria species, specifically B. pfeifferi, one of the most important vectors of S. mansoni in sub-Saharan Africa. Previous mitogenomic studies on Bulinus and Biomphalaria have primarily explored interspecific differences within these genera [51], whereas our findings reveal intraspecific mitochondrial genetic variation across multiple B. pfeifferi populations within a defined geographical region.
The B. pfeifferi from Gezira State maintain the typical gene order and exhibit no major rearrangements or expansions. This conservation mirrors patterns observed previously [48,51,53,54] and suggests strong evolutionary constraints on mitochondrial architecture within the genus. Similarly, we found strong negative selection across all 13 PCGs (Ka/Ks < 1), consistent with previous B. pfeifferi study [51], indicating that selective pressure on mitochondrial genes is conserved within this species. Interestingly, a negative GC skew in the nad3 gene was detected specifically in the Managil (MA) population. While negative GC skew patterns have been linked to environmental adaptation in other molluscs [64,65], this is the first report of such a shift in B. pfeifferi, suggesting that irrigation-driven habitat changes in Gezira may influence mutational dynamics. Moreover, structural analysis of tRNAs revealed that most B. pfeifferi tRNAs retain the canonical clover leaf structure, although loss and/or reductions in the D-arm or TΨC-arm were detected. These structural reductions are consistent with patterns across molluscan and metazoan mitogenomes [25,66,67,68,69,70,71], likely representing adaptations towards genome compaction while maintaining essential function.
When examining the start codon of the cox1 gene, we found all our populations exhibited a (TTG) start codon, aligning with the South American species (e.g., B. glabrata strain 1742 [48], B. tenagophila [53], and B. straminea [54]). However, it differs from the ATC start codon observed in Kenyan B. pfeifferi and the ATG codon in B. sudanica and B. choanomphala [51]. Our study confirms the frequent occurrence of incomplete stop codons (T) in six genes (atp6, cox2, cox3, nad2, nad3, and nad4), a phenomenon commonly observed in invertebrate mitogenomes and present in other Biomphalaria species [48,53,54]. These incomplete stop codons are linked to the compact nature of mitochondrial DNA, which has evolved to minimize genome size by omitting full stop codons in some protein-coding genes [72]. Instead, during post-transcriptional processing, these truncated codons are completed by polyadenylation, where a poly-A tail is added to the mRNA, turning the incomplete uracil (U) into a complete stop codon (UAA). However, incomplete stop codons frequently create annotation challenges, as commonly used tools such as MitoZ and MITOS2 often misidentify gene boundaries leading to inaccurate mitogenome annotations. For example, in our analysis, we observed that several of the Zhang et al. [51] Biomphalaria reference genomes exhibited misannotations, in which eight PCGs (cox2, cox3, nad2, nad3, nad4, nad6, atp8, and atp6) and the 16S rrnL overlapped with adjacent tRNA genes, requiring corrections before use.
Phylogenetic comparisons showed high similarity between the Gezira State and the Kenyan (NC_038059) B. pfeifferi sequences, supporting previous findings of limited divergence across African populations [51,73]. However, subtle differences in gene length, nucleotide composition, and amino acid sequences were observed. We found high divergence in the 12S rRNA when comparing the Gezira samples with the Kenyan sequence. This divergence is likely due to the Kenyan strain having been maintained under laboratory conditions for several years, whereas the Gezira populations remain wild and exposed to natural selective pressures, including habitat modification and parasitic infections. The slightly greater divergence observed in the Managil (MA), Hasahisa (HA), and Greater Wad Medani (GW) populations suggests localized adaptation or restricted gene flow, and may result from geographical isolation and/or irrigation-driven bottlenecks [2,37]. Similar intraspecific genetic variation was also observed in B. glabrata [48]. The highest nucleotide sequence variation was observed in the Managil (MA) population, potentially for several reasons: (I) a genetically distinct founder population introduced by humans or birds with limited gene flow; (II) local adaptation to specific environmental pressures in irrigation systems; and/or (III) the presence of a distinct B. pfeifferi subspecies, warranting further investigation.
4. Materials and Methods
4.1. Sample Collection
Natural populations of B. pfeifferi were collected from seven sites across six localities in Gezira State, Sudan, between December 2022 and March 2023 (Table 6, Figure 1). Gezira State, located in an agricultural region, is highly endemic for both urinary and intestinal schistosomiasis [22,74]. Sites with high amounts of human and/or animal contact and Biomphalaria-favorable water conditions were selected. Geographical coordinates (longitude and latitude) for each site were recorded using a Global Positioning System (GPS) device. Snails were collected using the scooping method by trained public health personnel, following WHO guidelines [75,76]. Subsequently, snails were transported to the Medical Entomology and Vector Control Department Laboratory at the Blue Nile National Institute for Communicable Diseases, University of Gezira, Sudan. Specimens were sorted and identified to species level based on shell morphology, following standard identification keys [77,78]. Snails were individually preserved in labeled tubes containing 95% ethanol and stored at −20 °C. Molecular laboratory analyses were then performed at the National Institute of Parasitic Diseases, China CDC, in Shanghai, People’s Republic of China.
4.2. DNA Extraction
A total of 27 B. pfeifferi snails were selected for DNA extraction and mitochondrial genome sequencing (Table 6). Each snail was individually crushed, and the soft tissue was soaked in distilled water overnight to remove residual ethanol. Samples were then air-dried for 4 hrs prior to DNA extraction. Genomic DNA from 16 snails was extracted using the Qiagen DNeasy Blood and Tissue Kit (Lot: 175021295, Cat. No. 69506, QIAGEN GmbH, Hilden, Germany) according to the manufacturer’s protocol. The remaining 11 samples were processed using the standard CTAB (Cetyltrimethylammonium Bromide), Phenol–Chloroform–Isoamyl alcohol extraction method [51]. All DNA samples were stored at −20 °C after extraction until further use for sequencing.
4.3. Mitochondrial Genome Sequencing, Assembly and Annotation
We examined the main characteristics of the B. pfeifferi mitogenomes, including their nucleotide composition, codon utilization, rRNAs and the secondary structure of their tRNAs. Mitochondrial genome sequencing and data generation were conducted by OneMore Tech (Wuhan Wanmo Technology Co., Ltd., Wuhan, China). Genomic DNA was randomly fragmented and size-selected to an appropriate average fragment length. The fragments were then end-repaired, 3′ adenylated, and ligated with sequencing adapters. PCR amplification was subsequently performed. Single-stranded circular DNA molecules were generated via rolling circle amplification [79], producing DNA nanoballs (DNBs) each containing over 300 copies of the circularized DNA. The DNBs were loaded onto patterned nanoarrays using high-density DNA nanochip technology and sequenced via combinatorial probe-anchored synthesis (cPAS) technology [80]. Raw image data were converted into sequence reads through base calling, and the results were saved in FASTQ format, including base quality scores.
Data filtering and redundancy removal were conducted using Fastp v0.23.2 [81], and sequencing quality was assessed using FastQC v0.11.9 [82] with default settings. Mitochondrial genome assembly was performed using NOVOPlasty v4.3.1 [83] with the following parameters: genome size range = 10,899–16,348 bp, K-mer = 33, read length = 150 bp, insert size = 300 bp, and paired-end reads (PE). The resulting 27 assembled mitochondrial genomes were annotated using both MitoZ v3.6 [84] (annotate clade Mollusca) and MITOS2 (http://mitos2.bioinf.uni-leipzig.de/index.py accessed on 10 December 2024) [72] with the invertebrate mitochondrial genetic code. Annotations were manually corrected using NCBI ORFfinder (https://www.ncbi.nlm.nih.gov/orffinder/ accessed on 10 December 2024), and circular maps of the mitochondrial genomes were generated with SnapGene v8.0.2 software (www.snapgene.com).
4.4. Transfer RNAs and Ribosomal RNAs Analysis
The secondary structures of tRNA genes were predicted using ARWEN v1.2 (http://130.235.244.92/ARWEN/ accessed on 15 December 2024)) [85], the tRNAscan-SE v2.0 web server (https://lowelab.ucsc.edu/tRNAscan-SE/ accessed on 15 December 2024)) [86], and MITOS2 [72]. Pairwise nucleotide comparisons of rRNAs and the 13 PCGs were performed using MEGA.11 [87]. rRNA alignment was performed using CLC Genomics workbench v25.0.1 (QIAGEN, Aarhus, Denmark; https://digitalinsights.qiagen.com/).
4.5. Amino Acid Usage and Relative Synonymous Codon Usage RSCU Analysis
Nucleotide composition, codon usage of protein-coding genes (PCGs), and relative synonymous codon usage (RSCU) were analyzed using MEGA.11 [87] and an online RSCU analysis tool (https://jamiemcgowan.ie/bioinf/rscu.html, accessed on 24 January 2025). The AT and GC skew values were calculated using the formulas AT skew = (A − T)/(A + T) and GC skew = (G − C)/(G + C).
4.6. Ka/Ks Ratio, Nucleotide and Amino Acid Identity Analysis
The ratio of non-synonymous (Ka) to synonymous (Ks) substitutions for mitochondrial PCGs was estimated using DnaSP v6 [88]. Amino acid (AA) and nucleotide (NT) sequence identities for the 13 PCGs were calculated using the online Sequence Manipulation Suite (https://www.bioinformatics.org/sms2/ident_sim.html, accessed on 30 January 2025) [89]. Heatmaps for AA and NT identities were generated using TBtools-II v2.152 [90].
4.7. Phylogenetic Analysis
Phylogenetic analyses were conducted to assess the relationships between the 27 B. pfeifferi samples and six additional Biomphalaria spp. mitochondrial genome sequences retrieved from NCBI, with Planorbella duryi used as an out-group (Table 5). A maximum likelihood (ML) tree was constructed based on multiple sequence alignment of the complete mitochondrial genomes using MEGA v11. The best-fit substitution model was determined using the model test function in MEGA v11, based on the lowest Bayesian Information Criterion (BIC) score, and the GTR model was selected. The ML tree was generated with 1000 bootstrap replicates to assess the robustness of the phylogenetic relationships. Additionally, multiple sequence alignments of the coding DNA sequences (CDS) and corresponding protein sequences of the 13 mitochondrial PCGs were performed using MUSCLE v3.8.31 [91]. Two additional ML phylogenetic trees, based on the concatenated coding sequences (CDSs) and protein sequences of the 13 PCGs, were constructed using RAxML v8.2.12 [92].
The mitochondrial genome of B. pfeifferi (NC_038059) is currently the only publicly available complete mitogenome for this species. However, several protein-coding genes were inaccurately annotated, including instances of gene overlap with adjacent tRNA genes and overestimation of coding sequence lengths. To ensure reliable comparative analyses with our newly generated data, we manually re-annotated the reference mitogenome following standard mitochondrial annotation guidelines. Specifically, we corrected the annotations and gene boundaries of the 16S rRNA, atp8, atp6, nad2, nad3, nad4, nad6, cox2, and cox3 genes.
5. Conclusions
The complete mitochondrial genome sequences of 27 Sudanese Biomphalaria pfeifferi snails from seven populations were characterized and compared. The EG, SG, NU1, and NU3 populations exhibited high genetic similarity; in contrast, the HA and GW populations showed some divergence. Notably, the MA population displayed distinct genetic variation, as supported by phylogenetic analysis, nucleotide identity, and amino acid sequence comparisons. These findings suggest that the MA population may represent a distinct subspecies of B. pfeifferi, warranting further investigation. Despite the genetic similarities of the EG, SG, NU1, and NU3 populations to the Kenyan B. pfeifferi reference mitogenome, significant variation was observed in the 12S rrnS sequence between the Kenyan and Gezira samples. This highlights the need for further studies to explore the genetic diversity, evolutionary history, and phylogenetic relationships of B. pfeifferi and other Biomphalaria populations across Sudan and Africa.
The reference list from the paper itself. Each links out to its DOI / PubMed record.
- 1Brown D.S. Freshwater Snails of Africa and Their Medical Importance CRC Press Boca Raton, FL, USA 19940-429-09494-9
- 2Dejong R.J. Morgan J.A. Wilson W.D. Al-Jaser M.H. Appleton C.C. Coulibaly G. D’Andrea P.S. Doenhoff M.J. Haas W. Idris M.A. Phylogeography of Biomphalaria glabrata and B. pfeifferi, Important Intermediate Hosts of Schistosoma mansoni in the New and Old World Tropics Mol. Ecol.2003123041305610.1046/j.1365-294X.2003.01977.x 14629384 · doi ↗ · pubmed ↗
- 3Au M.F.F. Status Quo and Future Perspectives of Molecular and Genomic Studies on the Genus Biomphalaria-The Intermediate Snail Host of Schistosoma mansoni Int. J. Mol. Sci.202324489510.3390/ijms 2405489536902324 PMC 10003693 · doi ↗ · pubmed ↗
- 4Majoros G. Fehér Z. Deli T. Földvári G. Establishment of Biomphalaria tenagophila Snails in Europe Emerg. Infect. Dis.2008141812181410.3201/eid 1411.08047918976582 PMC 2630743 · doi ↗ · pubmed ↗
- 5Malek E.A. Snail Hosts of Schistosomiasis and Other Snail-Transmitted Diseases in Tropical America: A Manual Pan American Health Organization Washington, DC, USA 198592-75-11478-1
- 6De Jong R.J. Morgan J.A. Paraense W.L. Pointier J.P. Amarista M. Ayeh-Kumi P.F. Babiker A. Barbosa C.S. Brémond P. Pedro Canese A. Evolutionary Relationships and Biogeography of Biomphalaria (Gastropoda: Planorbidae) with Implications Regarding Its Role as Host of the Human Bloodfluke, Schistosoma mansoni Mol. Biol. Evol.2001182225223910.1093/oxfordjournals.molbev.a 00376911719572 · doi ↗ · pubmed ↗
- 7Jorgensen A. Kristensen T.K. Stothard J.R. Phylogeny and Biogeography of African Biomphalaria (Gastropoda: Planorbidae), with Emphasis on Endemic Species of the Great East African Lakes Zool. J. Linn. Soc.200715133734910.1111/j.1096-3642.2007.00330.x · doi ↗
- 8Archibald R.G. The Endemiology and Epidemiology of Schistosomiasis in the Sudan J. Trop. Med. Hyg.193336345348