Subclinical Cardiac Involvement in Asymptomatic ATTR Mutation Carriers: Insights from Cardiac MRI, Myocardial Strain, and Mapping Techniques
Luca Conia, Daria Filatova, Giacomo Pambianchi, Livia Marchitelli, Giulia Cundari, Giuseppe Stancanelli, Maria Alfarano, Giulia Marchionni, Cristina Chimenti, Carlo Catalano, Nicola Galea

TL;DR
This study uses advanced heart imaging to detect early signs of heart disease in people with a genetic mutation linked to amyloidosis, even before symptoms appear.
Contribution
The study introduces myocardial strain analysis as a potential early biomarker for subclinical ATTR-CA in asymptomatic mutation carriers.
Findings
Asymptomatic ATTR mutation carriers showed impaired left ventricular and left atrial strain despite normal ejection fraction and morphology.
Native T1 and ECV values remained normal in asymptomatic carriers, distinguishing early dysfunction from overt amyloid deposition.
Myocardial strain analysis could help identify early subclinical disease and guide timely intervention in at-risk individuals.
Abstract
Transthyretin cardiac amyloidosis (ATTR-CA) leads to myocardial infiltration, affecting prognosis and survival. Diagnosing early-stage ATTR-CA remains challenging due to its subtle manifestations. This study investigates subclinical myocardial alterations in asymptomatic ATTR mutation carriers (ATTR-MC) using advanced cardiac magnetic resonance (CMR) techniques, including T1 mapping and myocardial strain analysis. A retrospective cohort of 60 subjects was analyzed, comprising 20 ATTR-CA patients, 20 asymptomatic ATTR-MC, and 20 controls. Standard CMR parameters were compared alongside myocardial strain analysis. Results indicated that despite preserved ejection fraction and myocardial morphology, ATTR-MC exhibited significantly impaired left ventricular global longitudinal strain (LV GLS), left atrial reservoir, conduit, and booster pump strain (LA RS, CS, and BPS) compared to controls.…
Genes, proteins, chemicals, diseases, species, mutations and cell lines named across the full text — each resolved to its canonical identifier and authoritative record.
Click any figure to enlarge with its caption.
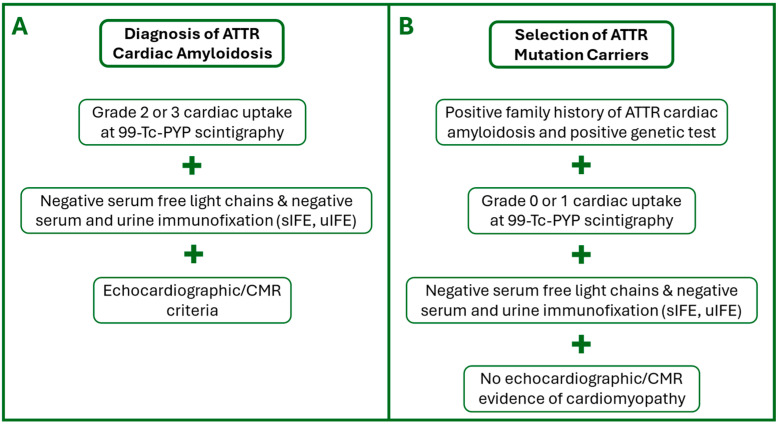 Figure 1
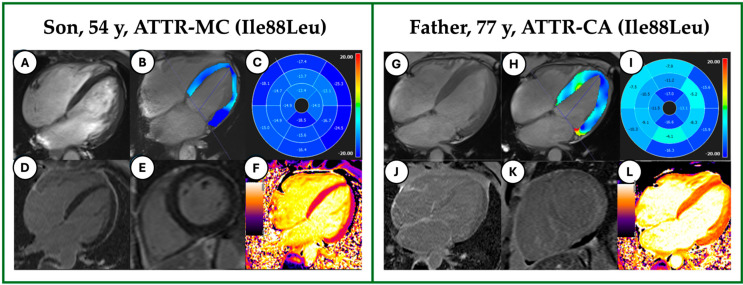 Figure 2
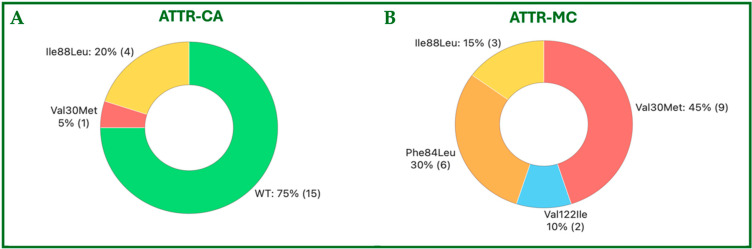 Figure 3
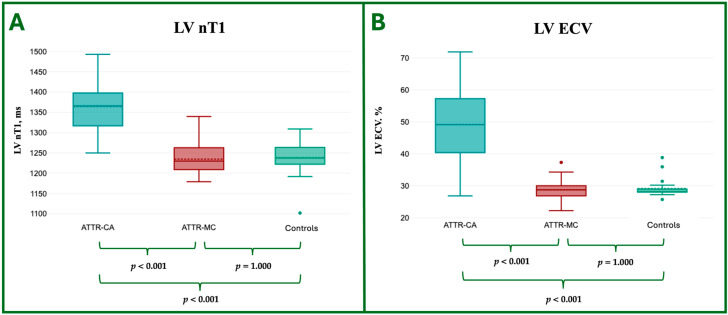 Figure 4
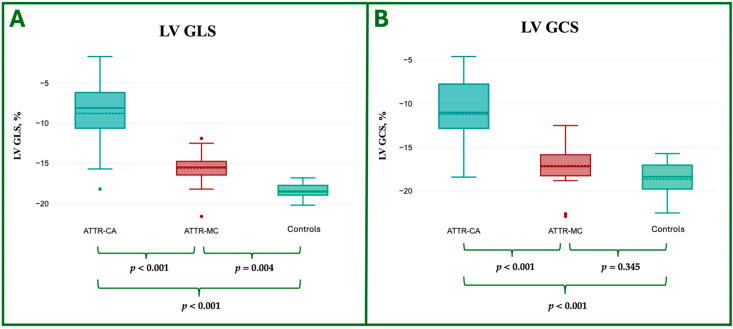 Figure 5
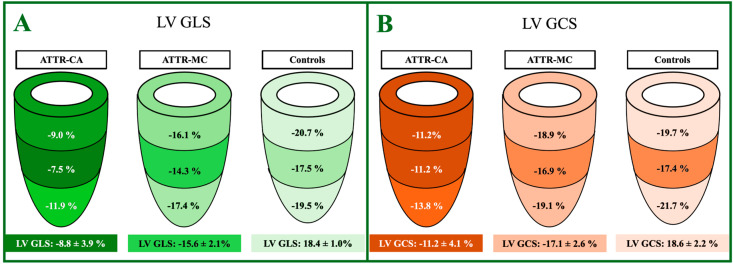 Figure 6
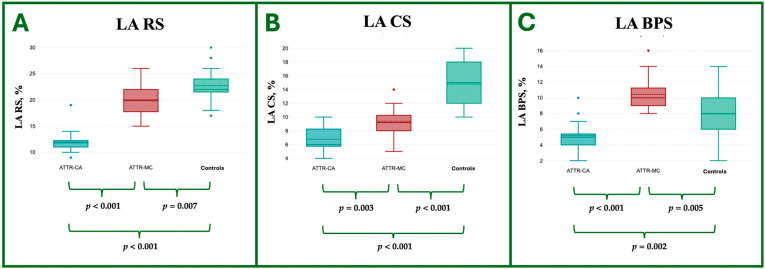 Figure 7
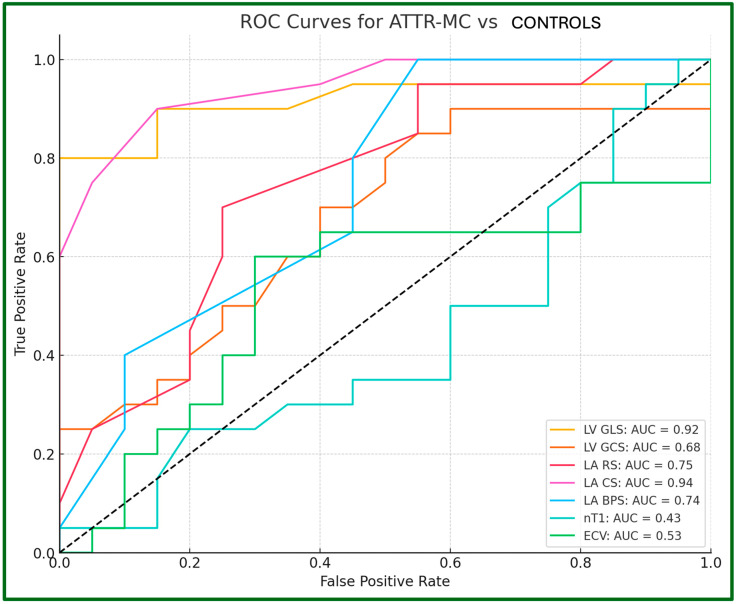 Figure 8
Peer Reviews
No public reviews on file for this paper yet. If you reviewed it on a platform where reviews are public (OpenReview, ICLR, NeurIPS, ICML), you can paste yours below so the community can read it here.
Videos
No videos yet. Explain this paper in a talk, walkthrough, or lecture? Add one.
Taxonomy
TopicsAmyloidosis: Diagnosis, Treatment, Outcomes · Parathyroid Disorders and Treatments · Cardiomyopathy and Myosin Studies
1. Introduction
Systemic amyloidosis comprises a group of infiltrative disorders characterized by the accumulation of misfolded precursor proteins that form cross-β-sheet-rich insoluble amyloid fibrils in the extracellular space of various tissues [1]. Transthyretin (TTR), a protein responsible for transporting thyroxine and retinol-binding protein, can misfold and deposit into various organs and peripheral nerves, which can cause them to function abnormally.
Cardiac amyloidosis (CA), hereditary (h-ATTR-CA) or wild-type (wt-ATTR-CA), is the primary determinant of prognosis in patients with ATTR amyloidosis, with survival rates averaging 4–5 years after diagnosis [2].
Cardiac magnetic resonance (CMR) plays a pivotal role in diagnosing and staging CA, as it provides a non-invasive evaluation of cardiac morphology, function, and extracellular volume expansion, implementing prognostic stratification and therapeutic response evaluation.
Particularly, CMR proves to be crucial in the advanced stages of CA, reliably identifying hallmark features such as ventricular hypertrophy, diffuse late gadolinium enhancement (LGE), elevated native T1 (nT1), and increased extracellular volume (ECV) values [3].
Conversely, diagnosing early-stage CA is particularly challenging due to its subtle manifestations, which may include minimal hypertrophy without distinct morphological or signal alterations, overlapping with other conditions such as hypertensive heart disease. Early diagnosis of CA is crucial for the timely initiation of appropriate therapy, as recent advances in CA treatment have significantly improved survival and quality of life by slowing disease progression and preserving cardiac function. Delayed diagnosis of CA can result in irreversible damage, limiting treatment options and leading to poorer outcomes. Although new emerging therapies, such as transthyretin stabilizers (tafamidis) and gene-silencing agents (patisiran, vutrisiran), have been shown to improve survival by controlling disease progression, their efficacy markedly decreases at advanced stages [4].
The 2021 ESC recommendations for family screening in h-ATTR-CA [5] suggest the use of bone scintigraphy as part of the evaluation of asymptomatic ATTR mutation carriers (ATTR-MC). However, a European multicenter study [6] showed that conduction abnormalities can precede amyloid detection by bone scintigraphy in ATTR-MC, highlighting the limitations of first-line tests.
Given these limitations, CMR may play a pivotal role in their evaluation. It remains unclear whether myocardial signal alterations or cardiac functional changes at CMR in asymptomatic carriers of pathogenic TTR mutations precede overt clinical signs of systemic amyloidosis. The application of advanced CMR techniques, such as T1 mapping and myocardial strain analysis, appears promising in uncovering new biomarkers that might detect subclinical changes in the early stages of the disease [7,8]; in particular, ventricular and atrial myocardial strain analysis provides a quantitative approach to assessing myocardial deformation over the entire cardiac cycle.
The objective of our study is to characterize the morphofunctional changes and myocardial signal alterations detectable by CMR in ATTR-MC. These findings may distinguish them from normal individuals and potentially represent early signs of CA prior to the clinical manifestation of the disease.
2. Materials and Methods
2.1. Study Population
A retrospective analysis was conducted on a cohort of 40 subjects, divided into two distinct groups based on clinical presentation and diagnostic criteria: 20 patients with ATTR amyloidosis (Group 1—ATTR-CA) and 20 carriers of hereditary mutations in the TTR gene associated with amyloidosis (Group 2—ATTR-MC) without clinical signs, symptoms, or echocardiographic evidence of structural heart disease.
A control group of 20 age- and sex-matched patients with the ATTR-MC group, who underwent CMR for other indications with normal cardiac morphology and function and no myocardial signal abnormalities, was retrospectively enrolled (Group 3—Controls, C).
2.2. Inclusion Criteria
All patients in the ATTR-CA group presented left ventricular hypertrophy (LVH) at echocardiography, defined as a maximal wall thickness (MWT) > 13 mm. In cases where ATTR-CA was not histologically proven, the diagnosis was established using the non-invasive algorithm proposed by Gillmore et al. [9]. This approach requires the presence of heart failure with echocardiographic or CMR findings suggestive of amyloidosis, grade 2 or 3 cardiac uptake on technetium-99m PYP scintigraphy, and the absence of a monoclonal protein based on serum or urine immunofixation electrophoresis (IFE). Given that the Phe84Leu mutation is known to produce negative results on scintigraphy, alternative criteria were considered to assess potential cardiac involvement in these patients. Specifically, we relied on echocardiographic findings and conventional CMR parameters, including wall thickness, late gadolinium enhancement, and mapping values.
All ATTR-MC subjects, recruited among relatives of ATTR-CA patients, underwent genetic testing alongside echocardiography, myocardial scintigraphy, and serum/urine IFE analysis, which yielded negative results for amyloid deposition or abnormal protein expression.
The inclusion criteria are summarized in the flow charts shown in Figure 1.
2.3. Exclusion Criteria
Patients were excluded from this study if they met any of the following criteria: presence of cardiac devices (pacemakers or implantable cardioverter-defibrillators); poor image quality (e.g., inadequate breath-holding or significant artifacts); end-stage Chronic Kidney Disease, defined as an estimated glomerular filtration rate (eGFR) < 15 mL/min/1.73 m^2^; history of severe allergic reactions to contrast agents; pregnancy or lactation.
2.4. CMR Protocol
All CMRs were performed on a 3.0T scanner (Magnetom Vida, Siemens Medical System, Erlangen, Germany) using body and phased array coils.
The CMR protocol required the administration of a single dose of 0.15 mmol/Kg of Gadobutrol (Gadovist, Bayer Inc., Mississauga, ON, Canada) and included the following:
- T2-weighted Short Tau Inversion Recovery (T2-STIR) sequence acquired on the short axis (from base to apex, 10 slices at least) and on 2- and 4-chamber views (TR: 800; TE: 44 ms; TI: 220 ms; FA: 180°; Slice thickness: 6 mm; FoV: 360 mm; FoV Phase: 81.3%; Voxel size: 1.4 × 1.4 × 6 mm; Matrix: 135 × 256);
- Cine-Steady State Free Precession sequences for cineMR imaging, acquired on the short axis (from the base to the cardiac apex, 10 slices at least) and on 2-, 3-, and 4-chamber views (TR: 40.8 ms; TE: 1.49 ms; FA: 80°; Slice thickness: 6 mm; FoV: 360 mm; FoV Phase: 81.3%; Voxel size: 1.4 × 1.4 × 6.0 mm; Matrix: 191 × 256);
- Modified Look–Locker Inversion Recovery (MOLLI) sequence for nT1 mapping, acquired on three short-axis slices at basal, mid-ventricular, and apical views and one four-chamber view before (TR: 280.6 ms; TE: 1.12 ms; FA: 35°; Slice thickness: 8 mm; FoV: 360 mm; FoV Phase: 85.2%; Voxel size: 1.4 × 1.4 × 8 mm; Matrix 144 × 256) and 15 min after the administration of contrast media (TR: 360.6 ms; TE: 1.12 ms; FA: 35°; Slice thickness: 8 mm; FoV: 360 mm; FoV Phase: 85.2%; Voxel size: 1.4 × 1.4 × 8 mm; Matrix 144 × 256);
- Contrast-enhanced Inversion Recovery T1-weighted images were acquired from 10 to 15 min after contrast media administration, during breath-hold at end-diastole in the short axis (from the base to the cardiac apex, 10 slices at least), and on 2-, 3-, and 4-chamber views (TR: 750 ms; TE: 2.01 ms; TI: 300–350 ms; FA: 20°; Slice thickness: 6 mm; FoV: 360 mm; FoV Phase: 85.2%; Voxel size: 1.4 × 1.4 × 8 mm; Matrix 154 × 256) for LGE imaging.
Field inhomogeneity correction, noise reduction, and motion correction were performed using the algorithms incorporated in the package with standard settings.
2.5. Image Analysis
The image analysis was conducted by two radiologists (L.C., 5 years of experience, and D.F., 7 years of experience) in consensus, utilizing a dedicated postprocessing software (Cvi42 v6.0.2, Circle Cardiovascular Imaging, Calgary, AB, Canada). Atrial and ventricular volumes, along with derived parameters, were measured using cineMR images.
Atrial and ventricular volumetric measurements, along with derived indices, were obtained from cineMR images. The endocardial and epicardial borders of the left ventricle (LV) were delineated semi-automatically on both short- and long-axis views, and all volumetric parameters were indexed to body surface area (BSA).
LV strain analysis was conducted through CMR feature tracking based on cineMR images in multiple planes. The resulting myocardial contours were reviewed visually, adjusted to correct tracking inaccuracies, and reanalyzed as necessary, following previously established protocols. Global circumferential strain (GCS) and global longitudinal strain (GLS) were calculated as the average of three repeated measurements.
Left atrial (LA) strain evaluation was carried out using the same feature-tracking methodology. Endocardial LA borders were outlined in horizontal and vertical long-axis cineMR views at the frame following atrial contraction and automatically propagated across the cardiac cycle. All generated contours underwent visual inspection, correction if required, and final validation by the operators. LA reservoir, conduit, and booster pump functions were quantified through longitudinal strain analysis corresponding to the reservoir (LA RS), conduit (LA CS), and booster pump (LA BPS) phases, respectively. Each analysis was repeated three times, and mean values were reported.
For T1 mapping, contours were drawn around the endocardial and epicardial borders on pre-contrast and 15-min post-contrast images. A region of interest (ROI) was positioned within the LV cavity to extract blood pool T1 values, and a reference marker was placed at the anterior interventricular junction. Native T1 (nT1) values and ECV were automatically generated by the software for each segment according to the AHA model [10], according to the formula described elsewhere [11]. Hematocrit levels were collected within 24 h prior to imaging.
For reproducibility purposes, the identification of strain characteristics in all CMR studies was repeated by two blinded investigators; inter-observer and intra-observer variability of LV and LA strain was assessed for all the subjects in the study population.
Examples of image analysis are depicted in the case study presented in Figure 2.
2.6. Statistical Analysis
Categorical variables were summarized as frequencies and percentages, while continuous data were expressed as means with standard deviations. The assumption of normality was assessed using both the Kolmogorov–Smirnov and Shapiro–Wilk tests. For variables not following a normal distribution, data were presented as medians with interquartile ranges (IQR). Group comparisons for non-normally distributed data were carried out using the Mann–Whitney U test or the Kruskal–Wallis test, as appropriate.
For continuous variables exhibiting normal distribution, independent sample t-tests were used to compare means between the two groups. When comparing more than two groups, one-way analysis of variance (ANOVA) was applied, followed by Bonferroni-adjusted post hoc tests for pairwise comparisons.
Associations between parameters were assessed using Pearson’s correlation coefficient for normally distributed data and Spearman’s rank correlation for non-normal variables. The strength of correlations was interpreted as follows: negligible (0), slight (0.01–0.20), fair (0.21–0.40), moderate (0.41–0.60), good (0.61–0.80), and excellent (0.81–1.00).
Reproducibility of strain measurements was assessed through intraclass correlation coefficients (ICC), with values between 0.40 and 0.75 indicating fair to good reliability, and values above 0.75 are considered excellent.
Receiver operating characteristic (ROC) curve analysis was performed to evaluate the diagnostic performance of atrial and ventricular strain parameters in distinguishing between ATTR-MC and healthy controls. Optimal threshold values were identified using Youden’s index.
All statistical analyses were conducted using SPSS software (version 30.0, IBM Corp., Armonk, NY, USA). A p-value less than 0.05 was considered statistically significant.
3. Results
3.1. Demographic and Clinical Characteristics
No significant differences were observed between ATTR-MC and controls in terms of age, body surface area (BSA), heart rate (HR), or blood pressure (systolic and diastolic).
Patients in the ATTR-CA group were significantly older (77.2 ± 8.8 years) compared to ATTR-MC (52.7 ± 10.3 years; p < 0.05) and controls (47.0 ± 12.2 years; p < 0.05). All patients in the ATTR-CA group had positive technetium-99m-PYP scintigraphy, with a mean visual score of 2.74 ± 0.44, confirming the diagnosis of CA.
The demographic and clinical characteristics are summarized in Table 1, whereas the TTR mutations identified in the study population are reported in Figure 3.
Additional information regarding medical therapies and laboratory tests related to early signs of heart failure, such as troponin and NT-proBNP, is provided in the Supplementary Materials, in Table S1.
3.2. CMR Features
In the ATTR-MC group, no pathological phenotype was detected in the standard analysis of CineMR images, without a significant alteration of LV volume and ejection fraction (EF) compared to controls (indexed LV end-diastolic volume—LV EDVi: 74.7 ± 12.8 vs. 74.0 ± 11.5 mL/m^2^, p = 1.000, LV EF: 59.2 ± 5.9% vs. 61.3 ± 3.8%, p = 0.703), MWT, and in myocardial mass index (MMi).
The ATTR-CA group demonstrated significant increases in LV EDVi (85.9 ± 26.0 mL/m^2^), along with a marked reduction in LV EF (43.4 ± 12.1%), compared to ATTR-MC and controls (p-value < 0.05). The ATTR-CA group also showed substantial increases in MWT (19.7 ± 3.9 mm) and MMi, indicating severe hypertrophy.
The CMR features are reported in Table 2.
3.3. CMR Tissue Characterization
In the ATTR-MC group, no significant differences were identified in nT1 (1234.8 ± 38.1 ms vs. 1238.3 ± 45.3 ms, p = 1.000) or ECV (28.7 ± 3.9% vs. 29.1 ± 3.1%, p = 1.000) values compared to controls, neither subjects with values outside the normal range were identified.
There were no individuals with areas of myocardial edema or LGE in both ATTR-MC and controls.
ATTR-CA patients exhibited markedly elevated nT1 (1364.3 ± 66.5 ms) and ECV (49.2 ± 12.6%) compared to ATTR-MC and controls, consisting of the interstitial expansion due to amyloid accumulation in myocardial tissue.
The T1 mapping and ECV value comparison are reported in Table 3 and in Figure 4.
3.4. CMR LV and LA Strain Analysis
Despite preserved LV volumes and ejection fraction, ATTR-MC exhibits a significant reduction in LV GLS (−15.6 ± 2.1%) compared to HC (−18.4 ± 1.0%; p < 0.001). GCS was also slightly reduced but not statistically different from HC (−17.1 ± 2.6% vs. −18.6 ± 2.2%, p = 0.345).
The CMR LV strain analysis features are reported in Table 4 and shown in Figure 5 and Figure 6.
Similarly, despite preserved LA atrial volumes (systolic and diastolic), ATTR-MC demonstrated impaired LA strain values compared to controls. There was a significant reduction in LA RS (−19.8 ± 2.8% vs. −22.8 ± 3.5%, p = 0.007) and LA CS (−9.4 ± 1.9% vs. −14.8 ± 3.2%, p < 0.001) with a significant increase in LA BPS (10.5 ± 2.2% vs. 8.0 ± 3.0%, p = 0.005).
The CMR LA strain analysis features are reported in Table 4 and shown in Figure 7.
We assessed the capability of LV and LA strain parameters, nT1 and ECV values, to distinguish between ATTR-MC and controls using receiver operating characteristic (ROC) curves analysis, evaluating the area under the curve (AUC), as reported in Figure 8. LA CS and LV GLS demonstrated excellent accuracy with an AUC of 0.94 and 0.92, respectively.
LA BPS and LA exhibited fair accuracy with an AUC of 0.74 and 0.75, respectively. LA GCS was the only parameter with poor accuracy, with an AUC of 0.68. nT1 and ECV failed to distinguish the two groups with an AUC of 0.43 and 0.53, respectively.
4. Discussion
Our study demonstrated that, although CA is associated with an increase in myocardial nT1 and ECV values, ATTR-MC does not exhibit alterations in myocardial relaxometric properties. However, despite preserved LV myocardial wall thickness, volumes, ejection fraction, and LA volumes, ATTR-MC showed reduced LV GLS, LA RS, and LA CS, as well as increased LA BPS compared to HC. Moreover, those contractility alterations in ATTR-MC during strain analysis mirror those seen in CA patients, albeit with milder severity.
4.1. Tissue Characterization
In recent years, T1 mapping has emerged as the reference non-invasive tool for diagnosing CA in cases of myocardial hypertrophy of uncertain origin [12]. Indeed, nT1 and ECV values elevation occurs in CA due to interstitial space expansion associated with misfolded TTR protein accumulation and may also be observed in patients with systemic amyloidosis without ventricular hypertrophy or LGE [13].
ECV values in CA can reach approximately 54%, compared to normal levels of 20–26% and mildly elevated values of 27–31% in diffuse fibrotic conditions such as aortic stenosis and hypertrophic cardiomyopathy (HCM) [14]. T1 mapping has shown superior diagnostic accuracy compared to LGE in detecting CA, as nT1 values serve as a surrogate marker of both fibrosis and amyloid deposition [15].
However, the role of T1 mapping in the early diagnosis of ATTR-CA patients without myocardial hypertrophy remains poorly investigated and is still to be clarified.
In their studies on ATTR amyloidosis, Martinez-Naharro et al. [16] and Fontana et al. [17] investigated nT1/ECV differences among wt-ATTR, h-ATTR, and HCM patients. Their cohorts included 8 and 12 ATTR-MC patients, respectively, without evident cardiac involvement on echocardiography or myocardial scintigraphy. In these subgroups, no pathological alterations in nT1 or ECV values were found in ATTR-MC patients.
Our study confirmed that both nT1 (1234.8 ± 38.1 ms and 1238.3 ± 45.3 ms) and ECV values (28.7 ± 3.9% and 29.1 ± 3.1%) did not differ between ATTR-MC and controls (p = 1.000 for both parameters), suggesting the absence of detectable extracellular TTR deposition by CMR. This could be explained by the fact that, in ATTR-MC, any potential amyloid deposition in the extracellular space remains insufficient to induce significant fluid accumulation, a key factor contributing to increased nT1 and ECV values.
In the study population, no ATTR-MC exhibited myocardial edema or LGE, excluding the possibility of cardiac inflammation or fibrosis, whereas all ATTR-CA patients showed LV LGE areas.
These findings support the need for additional CMR-derived features to improve early diagnosis and characterization of cardiac involvement in patients at risk of developing ATTR-CA.
4.2. Ventricular Strain
LV strain analysis has emerged as a key tool for detecting subclinical myocardial dysfunction. By quantifying myocardial deformation, it identifies subtle impairments that may precede functional decline, aiding in the early diagnosis of cardiomyopathies [18].
In our cohort, ATTR-MC patients showed impaired LV GLS despite the absence of hypertrophy and normal nT1/ECV values. This is notable, as CA-related contractile dysfunction is primarily driven by amyloid-induced stiffness, leading to a restrictive pattern [1]. In ATTR-MC, early systolic dysfunction may reflect additional pathogenic mechanisms affecting cardiomyocytes, potentially preceding impairment due to interstitial amyloid infiltration.
In ATTR-MC, the early systolic dysfunction could reflect an additional pathogenetic mechanism that could precede the interstitial space expansion due to amyloid fibril deposition. In their comprehensive review of CA.
Ruberg FL et Berk JL [19] suggested that neuropathy or conduction disturbances caused by the toxic effects of pre-fibrillar transthyretin aggregates may occur before significant amyloid deposition. Histological evidence from in vivo nerve biopsies of asymptomatic Val30Met carriers points to pre-fibrillar TTR aggregates as key drivers of early nerve injury, even before clinical symptoms appear. In these carriers, nonfibrillar TTR aggregates triggered inflammatory responses and signs of cell stress.
In ATTR-MC, GCS was not significantly reduced compared to HC, likely because GLS is the first to decline with subendocardial damage, whereas GCS is influenced by subepicardial or transmural injury [5,20,21].
Selective GLS reduction suggests predominant subendocardial impairment in the early stages of CA, likely due to its vulnerability to amyloid deposition, lower capillary density, and higher ventricular filling pressures. GLS also detects early myocardial dysfunction missed by EF measurements, as echocardiography and CMR showed preserved EF [22].
These findings align with studies on LV strain impairment in other cardiomyopathy mutation carriers, even without significant echocardiographic or CMR abnormalities [23,24,25]. Vijapurapu et al. reported LV GLS impairment in Fabry disease without nT1 reduction, suggesting that mechanical dysfunction preceded evidence of sphingolipid deposition on the T1 map [26].
Furthermore, in our study, the optimal LV GLS cut-off value to distinguish ATTR-MC from HC was −16.6%, with an AUC = 0.92, indicating excellent performance. We also confirmed LV strain impairment in ATTR-CA, consistent with previous studies [27]. The Youden test identified −13.1% as the optimal LV GLS cut-off to differentiate ATTR-CA from ATTR-MC and HC (AUC = 0.94), also showing high discriminatory power. A relative apical sparing pattern has been confirmed, characterized by a basal-apical gradient (“cherry-on-top” pattern).
These findings highlight the potential additional role of strain analysis in this clinical setting, complementing traditional CMR features, such as LGE, ventricular volumes, and mapping values.
4.3. Atrial Strain
LA strain enables phasic analysis of LA function, divided into reservoir, conduit, and booster pump phases, accounting for approximately 50%, 30%, and 20% of LV filling in healthy subjects, respectively [28]. LA strain is altered in all cardiac diseases with diastolic dysfunction, often preceding systolic impairment [29].
ATTR-CA exhibits more advanced LA structural and functional remodeling than other non-ischemic diseases [30], suggesting LA strain features as a potential tool for early diagnosis and severity classification. In our cohort of ATTR-MC subjects, LA RS and LA CS were significantly reduced, while LA BPS increased, indicating a compensatory mechanism at the early stage of cardiac involvement to maintain ventricular filling despite subclinical diastolic dysfunction.
The Youden test identified an optimal LA CS cut-off of −11.0% (AUC = 0.94) to distinguish between ATTR-MC and HC, whereas LA RS and LA BPS showed lower discriminatory performance (AUC = 0.75 and 0.74, respectively).
LA strain is significantly affected in CA due to LV diastolic dysfunction and amyloid infiltration in the atrial wall [31]. In ATTR-MC, these alterations may reflect a combination of early extracellular TTR deposition, undetectable by LGE or mapping, and compensatory responses to ventricular dysfunction.
These findings align with previous studies on CA and other storage diseases, such as Fabry disease. Meucci et al. found LA strain independently correlated with ATTR, unlike LV GLS [32]. Halfmann et al. showed that the LA strain effectively differentiated early Fabry disease from HC, even when volumetric parameters and T1 mapping were inconclusive [33].
These findings highlight the potential additional role of strain analysis, both atrial and ventricular, in this clinical setting, complementing traditional CMR features such as LGE, ventricular volumes, and mapping values. Notably, the use of CMR-based strain analysis in ATTR-MC has been scarcely investigated, especially in the absence of overt cardiac involvement. Our study contributes novel evidence that even in the early, preclinical phase of the disease, LV strain, particularly GLS, and LA strain, particularly LA CS, may detect subtle myocardial dysfunction not captured by conventional imaging markers. This underscores the value of integrating strain analysis into the CMR assessment of mutation carriers, enhancing early diagnostic sensitivity and potentially guiding closer monitoring and timely therapeutic interventions.
While both LA and LV strain parameters were impaired in our cohort, a direct comparative analysis between the degree of LA and LV strain reduction was not performed. Future studies are warranted to explore whether LA dysfunction precedes or exceeds that of the LV, as this may provide further insights into the temporal and functional relationship between atrial and ventricular involvement in this clinical setting.
4.4. Study Limitations
One of the key limitations of this study is the relatively small sample size, which may constrain the generalizability of the findings and reduce the power to detect more subtle or nuanced differences between groups. A larger cohort could enhance the robustness of the conclusions and potentially reveal additional insights into the studied parameters. Observer variability represents another potential limitation.
Indeed, while reproducibility was assessed, the LA strain measurements demonstrated slightly lower ICC values compared to the LV strain. This finding suggests that further standardization and protocol refinement may be necessary to improve measurement consistency and reduce variability across different operators or imaging centers.
Another limitation is the retrospective design of this study. This approach was chosen due to the rarity of the condition and the availability of pre-existing, clinically acquired imaging and biomarker data.
Lastly, the lack of longitudinal follow-up in the study design precludes the evaluation of the prognostic significance of the detected early strain abnormalities. A follow-up investigation would be essential to determine whether these early subclinical findings are predictive of the eventual onset of overt cardiac amyloidosis in individuals carrying pathogenic mutations. Such an approach could help elucidate the temporal relationship between strain alterations and disease progression, contributing to improved risk stratification and clinical management.
5. Conclusions
A reduction in ventricular systolic strain, together with an increase in LA BPS, allowed for the identification of subclinical cardiac contractility disorders among ATTR-MC patients compared to controls. CMR-derived strain analysis, therefore, represents a powerful tool for identifying myocardial dysfunction in ATTR mutation carriers, with the potential to significantly enhance clinical management.
Longitudinal studies will be essential to evaluate the prognostic impact of these alterations and guide personalized therapeutic decisions.
The reference list from the paper itself. Each links out to its DOI / PubMed record.
- 1Fontana M. ĆorovićA. Scully P. Moon J.C. Myocardial Amyloidosis: The Exemplar Interstitial Disease JACC Cardiovasc. Imaging 2019122345235610.1016/j.jcmg.2019.06.02331422120 · doi ↗ · pubmed ↗
- 2Rapezzi C. Merlini G. Quarta C.C. Riva L. Longhi S. Leone O. Salvi F. Ciliberti P. Pastorelli F. Biagini E. Systemic cardiac amyloidoses: Disease profiles and clinical courses of the 3 main types Circulation 20091201203121210.1161/CIRCULATIONAHA.108.84333419752327 · doi ↗ · pubmed ↗
- 3Porcari A. Fontana M. Gillmore J.D. Transthyretin cardiac amyloidosis Cardiovasc. Res.20231183517353510.1093/cvr/cvac 11935929637 PMC 9897687 · doi ↗ · pubmed ↗
- 4Carrabba N. Amico M.A. Guaricci A.I. Carella M.C. Maestrini V. Monosilio S. Pedrotti P. Ricci F. Monti L. Figliozzi S. CMR Mapping: The 4th-Era Revolution in Cardiac Imaging J. Clin. Med.20241333710.3390/jcm 1302033738256470 PMC 10816333 · doi ↗ · pubmed ↗
- 5Garcia-Pavia P. Rapezzi C. Adler Y. Arad M. Basso C. Brucato A. Burazor I. Caforio A.L.P. Damy T. Eriksson U. Diagnosis and treatment of cardiac amyloidosis: A position statement of the ESC Working Group on Myocardial and Pericardial Diseases Eur. Heart J.2021421554156810.1093/eurheartj/ehab 07233825853 PMC 8060056 · doi ↗ · pubmed ↗
- 6Muller S.A. Peiró-Aventin B. Biagioni G. Tini G. Saturi G. Kronberger C. Achten A. Dobner S. Rijdt W.P.T. Gasperetti A. Evaluation of the 2021 ESC recommendations for family screening in hereditary transthyretin cardiac amyloidosis Eur. J. Heart Fail.2024262025203410.1002/ejhf.333938887861 · doi ↗ · pubmed ↗
- 7Smiseth O.A. Rider O. Cvijic M. ValkovičL. Remme E.W. Voigt J.U. Myocardial Strain Imaging: Theory, Current Practice, and the Future JACC Cardiovasc. Imaging 20251834038110.1016/j.jcmg.2024.07.01139269417 · doi ↗ · pubmed ↗
- 8Sperry B.W. Hanna M. Maurer M.S. Nativi-Nicolau J. Floden L. Stewart M. Wyrwich K.W. Barsdorf A.I. Kapadia H. Spertus J.A. Association of Tafamidis with Health Status in Patients with ATTR Cardiac Amyloidosis: A Post Hoc Analysis of the ATTR-ACT Randomized Clinical Trial JAMA Cardiol.2023827528010.1001/jamacardio.2022.525136723935 PMC 9996391 · doi ↗ · pubmed ↗