Evaluation of Anthropometric Measurements of 17,693 Newborns: Have Percentile Cut-Off Values Changed?
Nursu Kara, Didem Arman, Adem Gül, Kudret Ebru Erol, Serdar Cömert

TL;DR
This study evaluates newborn anthropometric measurements to determine if percentile cut-off values have changed compared to national and international standards.
Contribution
The study provides updated regional growth curves for newborns and highlights discrepancies with international standards.
Findings
Newborns in the study had higher average weight, length, and head circumference compared to Fenton growth charts.
Regional growth curves differ from international standards, especially for preterm infants.
Differences in SGA and LGA cut-off values suggest implications for diagnosis and follow-up.
Abstract
Objective: The aim of our study was to develop current local anthropometric measurement percentiles for newborns and to compare these values with national and international growth chart percentiles. Methods: This retrospective cross-sectional study evaluated the birth records of 17,693 infants born between 24 and 42 weeks of gestation at the Health Sciences University Istanbul Training and Research Hospital between January 2018 and December 2023. The following data were collected from the birth records: type of delivery, gender, gestational week, birth weight, birth length, head circumference, and the nationality of the infants. Percentile charts for weight, length, and head circumference were generated according to gender and gestational week. The 10th, 50th, and 90th percentiles of the local anthropometric measurement percentiles were compared with the national and the international…
Genes, proteins, chemicals, diseases, species, mutations and cell lines named across the full text — each resolved to its canonical identifier and authoritative record.
Click any figure to enlarge with its caption.
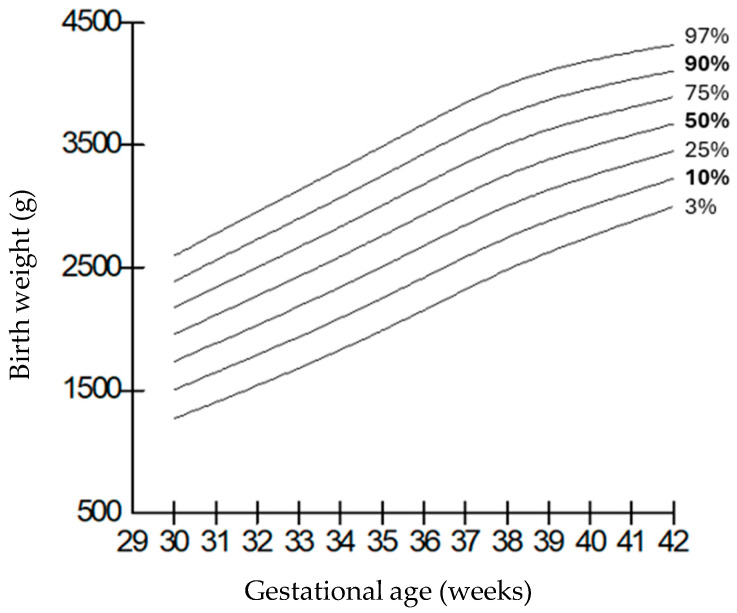 Figure 1
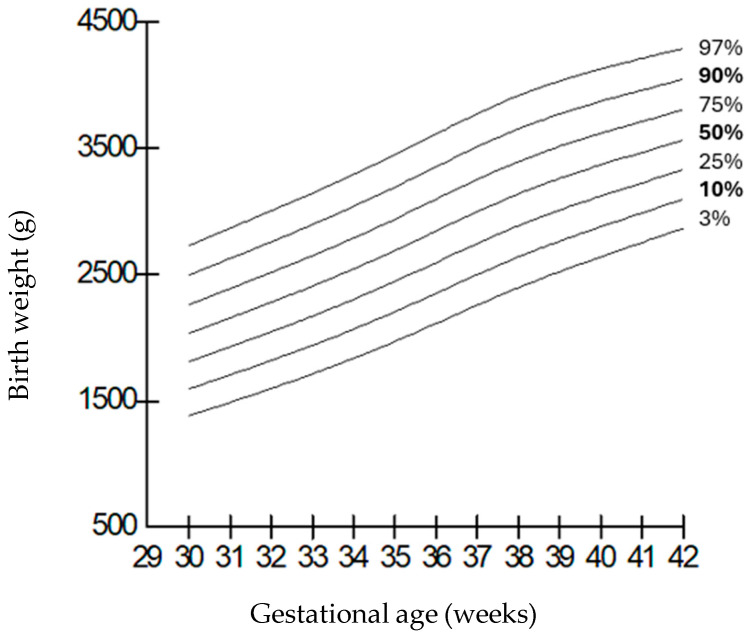 Figure 2
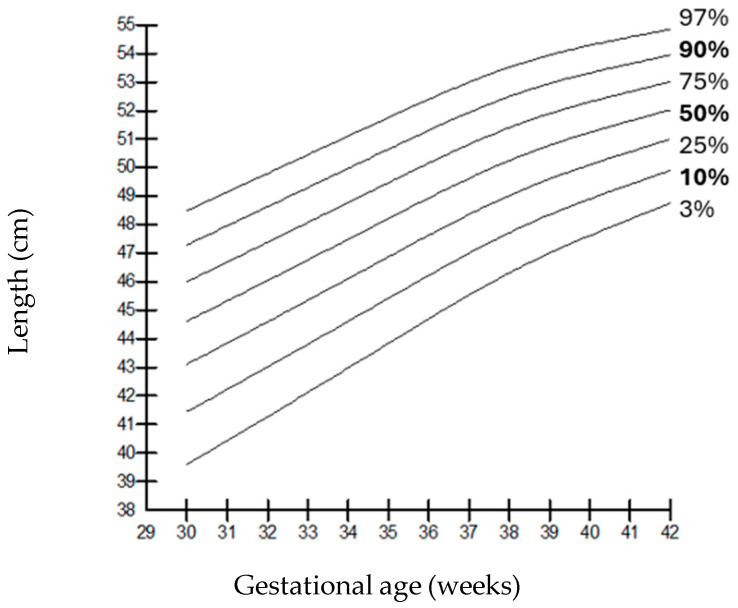 Figure 3
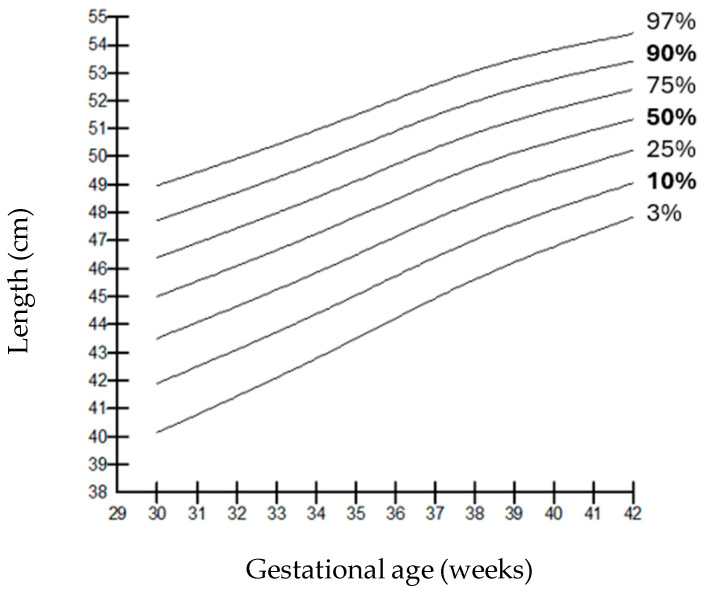 Figure 4
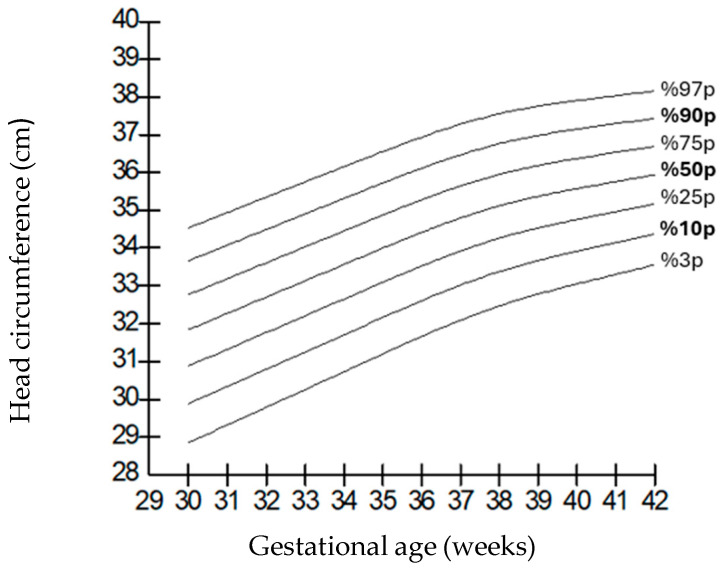 Figure 5
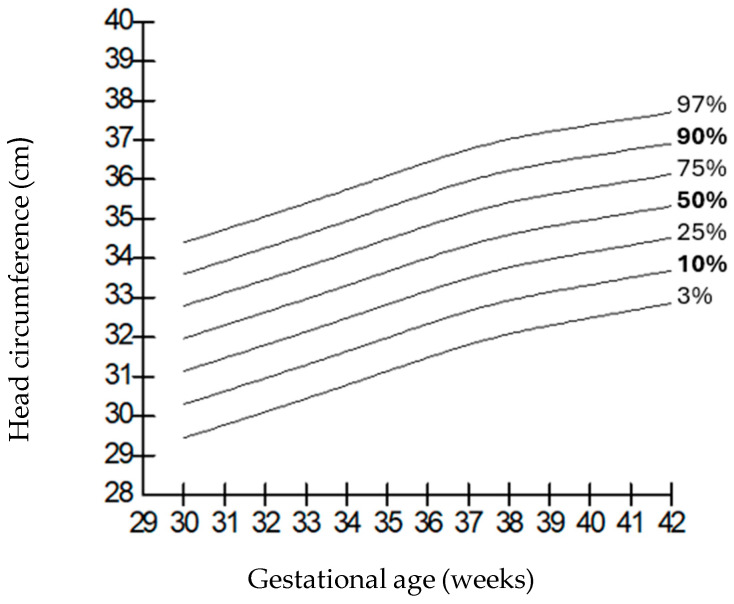 Figure 6
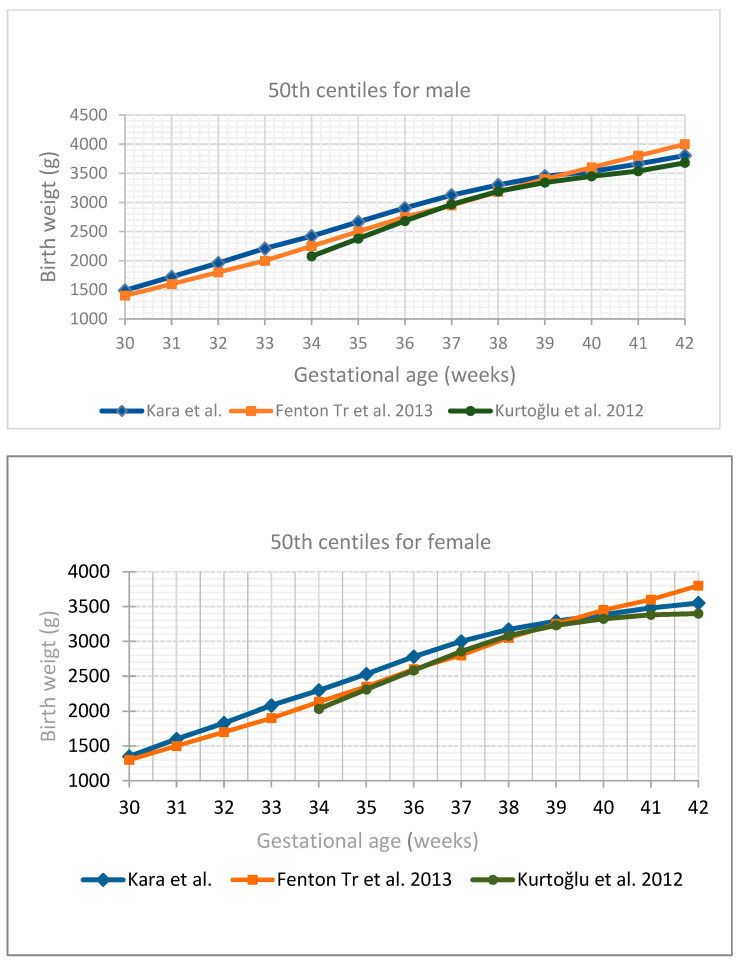 Figure 7
Peer Reviews
No public reviews on file for this paper yet. If you reviewed it on a platform where reviews are public (OpenReview, ICLR, NeurIPS, ICML), you can paste yours below so the community can read it here.
Videos
No videos yet. Explain this paper in a talk, walkthrough, or lecture? Add one.
Taxonomy
TopicsObesity, Physical Activity, Diet · Birth, Development, and Health · Body Composition Measurement Techniques
1. Introduction
Monitoring growth, a crucial aspect of newborn and infant care, is of the utmost importance for both term and preterm infants. Evaluating anthropometric measurements such as body weight, length, and head circumference using reference growth charts provides valuable information regarding fetal and postnatal growth, perinatal morbidity and mortality, and developmental delays [1,2]. Birth weight and its alignment with gestational age are the most significant risk determinants for mortality and morbidity. Identifying infants born small for gestational age (SGA) or large for gestational age (LGA) is crucial for anticipating and managing potential short-term and long-term complications [3,4,5,6].
Normal fetal growth depends on the complex interaction of the fetal, placental, and maternal units. In addition to various maternal factors, environmental factors and ethnic and genetic characteristics also influence fetal growth. In essence, the primary determinant of growth is the infant’s own genetic potential and the extent to which this potential is affected by external factors. At this point, it is thought that evaluations made with universal standard curves, considering environmental and genetic conditions, may be misleading. The question of which reference curve should be used for accurate assessment is still debated. Currently, the most widely used curve in growth monitoring is the Fenton growth curve [7]. In addition to universal growth charts such as Intergrowth-21 and that of the WHO, some countries also have their own local growth charts [8,9,10,11]. Since there may be differences between standard anthropometric measurements in different populations, the ideal approach is to develop national growth charts that reflect the genetic characteristics of each society and to make evaluations in this context.
In our country, studies have been conducted in different regions, including term and preterm infants according to gestational week, covering different years and numbers of infants [12,13,14,15,16]. There are some limitations in these studies, such as the use of small samples and the inability to generate separate curves according to gender. Based on these facts, the aim of our study was to develop current, local growth percentiles based on gestational age and gender by recording the birth weight, length, and head circumference measurements of newborn infants born in our hospital, and to compare these values with national and international growth charts.
2. Materials and Methods
Our study was a retrospective cross-sectional study evaluating the birth records of all newborn infants born between 24 and 42 weeks of gestation at the Health Sciences University Istanbul Training and Research Hospital between January 2018 and December 2023. The following data were recorded from the birth records: type of delivery, sex, gestational week, birth weight, length, head circumference, and the nationality of the infants.
Gestational ages were determined by obstetricians or trained nurses in the delivery room based on the last menstrual period. If gestational age was not determined properly, it was evaluated by using Modified Ballard score in the nursery. Birth weight was recorded by a nurse in the delivery room using a gram-sensitive electronic scale (Medical Research Council, London, UK); length was measured using an infantometer; and head circumference was measured by the same person using a non-stretchable measuring tape from the widest occipitofrontal points.
Infants with severe congenital anomalies incompatible with life, those diagnosed with intrauterine growth restriction due to a fetal and/or maternal cause, those who were not singleton births, those whose gestational week could not be determined according to the last menstrual period, and those with missing data for weight, length, or head circumference measurements were excluded from the study. Based on these data, weight, length, and head circumference percentile curves were developed according to gender and gestational week. An intrauterine growth-restricted (IUGR) infant was defined as an infant with antenatal measurements below the 3rd percentile with an abnormal umbilical artery blood flow [17,18,19]. Infants below the 10th percentile for gestational age and gender were defined as SGA, and those above the 90th percentile were defined as LGA. The 10th, 50th, and 90th percentiles of the curves were compared with the national curves of Kurtoğlu et al. [15] and the growth curves developed by Fenton TR et al [7].
3. Statistical Analysis
Percentile curves of all our measurements were plotted with the SPSS Version 11 program, and extreme values were removed by excluding those below the 3rd percentile and those above the 97th percentile to try to homogenize the sample group. The Lambda–Mu–Sigma (LMS) method was used for the correction process. The curves were corrected using the LMS Chart Maker Pro version 2.3 software program (Medical Research Council, London, UK). The LMS method is based on the assumption that irregularities in the distribution (skewness) can be corrected by power transformation. The most appropriate “exponent” number for the “Box–Cox transformation” to be applied to normalize the distribution was calculated separately for each age group, and the trend of the distribution was summarized in the form of a curve (L). The mean value (M) and the coefficient of variation (S) were calculated in the same way. In our study, the curves were corrected as cubic splines using “penalized likelihood” with non-linear regression, and the limits of the correction were determined according to the equivalent degrees of freedom. The LMS v.5.1 program was used for these operations. Percentile curves (3, 5, 10, 25, 50, 75, 85, 90, 95, 97) were generated for each parameter from the obtained data.
4. Results
The total number of births in our hospital between January 2018 and December 2023 was 18,260. The anthropometric measurements of 17,693 newborns were used in generating the percentile values and graphs. Of the included infants, 9589 (54.2%) were born by normal spontaneous delivery and 8104 (45.8%) by cesarean section. A total of 4955 (28%) of the infants were preterm and 12,738 (72%) were term; 8700 (49.2%) were girls and 8993 (50.8%) were boys (Table 1).
The distributions of weight, length, and head circumference percentiles by gestational week for the female and male genders are shown in Table 2, Table 3 and Table 4, respectively.
When compared by gender, it was observed that the weights of boys were higher than those of girls at all gestational weeks, but the length and head circumferences of both genders were similar. Growth charts according to gestational week and gender-specific weight, length, and head circumference measurements of the infants born in our hospital are shown in Figure 1, Figure 2, Figure 3, Figure 4, Figure 5 and Figure 6.
The comparison of the 50th percentile for gender and gestational week of all measurements obtained with the curves of Kurtoğlu S et al. [15] and the Fenton growth charts is shown in Figure 7.
When compared with the Fenton growth chart, the ranges of difference from the current values used in each week of pregnancy in SGA cut-off values for girls and boys were found to be 30–290 g and 30–230 g, respectively, and those for the LGA cut-off values for girls and boys were 80–300 g and 95–230 g, respectively.
5. Discussion
In our study, while the length and head circumference measurements of girls and boys were similar at all gestational weeks, the boys weighed more than the girls. When we compared the weight, length, and head circumference percentiles by gestational week for girls and boys with the Fenton international growth charts, we found that our babies had higher average values at all percentiles. When compared with the national growth charts of Kurtoğlu et al. [15], we found that the weight, length, and head circumference measurements of the girls and boys in our study were higher, especially under 38 weeks, and that they had similar anthropometric measurements from 38 weeks onwards. We found that the current SGA and LGA cut-off values that we determined were different for each week of pregnancy from those currently in use.
The World Health Organization (WHO) emphasizes the importance of monitoring the growth and development processes of children in child health follow-ups for the early detection of possible health problems and the implementation of necessary interventions [9]. The WHO also recommends the use of standard growth charts for the evaluation of growth and the monitoring of growth rate. The standard growth charts developed are an important reflection of the socioeconomic status of the society to which the selected infants belong, the level of access to health services, and nutritional data [10]. In addition, the fact that the reference group from which the standard values are obtained is from the same ethnic background and geographical region will minimize the errors that may occur during comparisons. At this point, even though universal growth standards have been determined, these standards may not be the most appropriate evaluation indicator for every society. This situation may reflect the need for societies to generate their own national or regional growth charts for their own babies.
When we compared the weight, length, and head circumference percentiles by gestational week for girls and boys with the Fenton growth charts, which we commonly use in the evaluation of growth in our country and clinic, we found that our babies had higher average values in all percentiles [7]. Since they reflect fetal and neonatal growth patterns in Turkish infants, we also compared our data with the growth charts developed by Kurtoğlu and Atıcı et al., which were conducted in our country and based on a population with similar geographic, ethnic, and socioeconomic characteristics. When we compared our results with the growth charts developed by Kurtoğlu et al., we found that the weight, length, and head circumference measurements of the girls and boys in our study were higher, especially under 38 weeks, and that they had similar anthropometric measurements from 38 weeks onwards [15]. When compared with the study by Atıcı et al., in which gender-specific data were shared from the 37th gestational week onwards, we found that our means and SGA and LGA cut-off values were higher for both genders between 37 and 42 weeks [14]. In the study conducted by Salihoğlu et al. in our country, we saw that especially the SGA cut-off values were significantly lower in both genders compared to our study. LGA cut-off values, on the other hand, were similar until the 37th gestational week, while they were found to be higher in our study in girls and boys after 37 weeks [16].
When we evaluated the anthropometric measurements in terms of gender, we found that, while the length and head circumference measurements of girls and boys were similar at all gestational weeks in our study, the weights of the boys were higher than the girls. There are many published studies showing that anthropometric measurements at birth differ between girls and boys depending on gender [15,20,21]. In their studies comparing the 10th, 50th, and 90th percentile weight, length, and head circumference values of newborns, Kurtoğlu et al. reported that male children had higher weights and lengths, and that their head circumference measurements were also higher than girls. In the same study, they found the difference between girls and boys to be an average of 200 g for weight, 0.8 cm for height, and 0.6 cm for head circumference [15]. In a study by Pawlus et al., from Poland, it was stated that all the anthropometric measurements of male infants were found to be higher than those of female ones [22]. These findings, along with our results, support the necessity of creating sex-specific percentile charts to ensure the accurate growth assessment and classification of newborns, given the differences in anthropometric measurements between males and females.
It is obvious that the use of national curves and percentile values is important in terms of detecting SGA and LGA infants, who are in the high-risk group [4,5,23,24,25]. The easiest and most reliable method that can be used to predict these risks is the evaluation of the appropriateness of birth weight for gestational age according to growth charts. Lubchenco growth charts have been widely used for many years around the world to define SGA, LGA, and AGA infants [26]. Studies comparing their own generated curves with Lubchenco growth curves have been reported. However, since it is thought that these historically important curves cannot fully reflect the demographic and health characteristics of today’s populations, it is thought that growth curves need to be updated. As a result of the updates made based on these curves, the most frequently used reference curves today are the Fenton growth curves, which were updated to be gender-specific in 2013 [3]. When we compared the values we obtained in our study with the Fenton growth charts, we found that the SGA and LGA cut-off values were different for each week of pregnancy. Previous studies have reported that the parameters contributing to this difference include maternal weight gain, BMI, paternal birth weight, socioeconomic status, antenatal follow-up, and genetic factors [27]. According to 2018 Turkish Statistical Institute statistics [28], approximately 90% of mothers in Istanbul received optimum antenatal care before birth, underscoring the positive influence of this approach on neonatal anthropometric measurements, which may possibly be an explanation for the differences. Since our study was designed as a retrospective study, we were unable to access these data regarding other confounding factors. When we evaluated our newborns with the regional curve percentiles, we found that the number of infants defined as SGA was higher and the number of infants defined as LGA was lower. This situation can lead to SGA infants being defined as AGA and experiencing problems in receiving the care they need. In addition, since AGA infants are defined as LGA, they may be exposed to unnecessary intensive care monitoring, which may lead to the misuse of intensive care resources.
The fact that our study included the largest infant group in our country and defined updated, current 10th and 90th percentile cut-off values makes our study valuable. However, being single-centered is one of the limitations of our study. Due to the retrospective nature of our study, the inability to access maternal and paternal data represents a limitation. Another limitation of our study is that the number of <30 week premature newborns was not sufficient, and, therefore, growth percentiles at these weeks could not be defined.
As a result, our study reveals the current birth weight, length, and head circumference percentile values in infants in our region, based on a large number of infants. Notably, the generated regional growth curves differ from the existing international standards, which may have significant implications for the accurate diagnosis and follow-up of SGA and LGA infants. We suppose that our current national data can serve as a valuable reference for future multicenter studies involving larger populations and contribute to the optimal assessment of growth parameters in pediatric health surveillance.
The reference list from the paper itself. Each links out to its DOI / PubMed record.
- 1Mc Cormick M.C. The contribution of low birth weight to infant mortality and childhood morbidity N. Engl. J. Med.1985312829010.1056/NEJM 1985011031202043880598 · doi ↗ · pubmed ↗
- 2Chen L.-W. Tint M.-T. Fortier M.V. Aris I.M. Shek L.P.-C. Tan K.H. Chan S.-Y. Gluckman P.D. Chong Y.-S. Godfrey K.M. Which anthropometric measures best reflect neonatal adiposity?Int. J. Obes.20184250150610.1038/ijo.2017.250PMC 586242528990589 · doi ↗ · pubmed ↗
- 3Hack M. Flannery D.J. Schluchter M. Cartar L. Borawski E. Klein N. Outcomes in young adulthood for very-low-birth-weight infants N. Engl. J. Med.200234614910.1056/NEJ Moa 01085611796848 · doi ↗ · pubmed ↗
- 4Joglekar C.V. Fall C.H.D. Deshpande V.U. Joshi N. Bhalerao A. Solat V. Deokar T.M. Chougule S.D. Leary S.D. Osmond C. Newborn size, infant and childhood growth, and body composition and cardiovascular disease risk factors at the age of 6 years: The Pune Maternal Nutrition Study Int. J. Obes.2007311534154410.1038/sj.ijo.080367917653070 PMC 2358952 · doi ↗ · pubmed ↗
- 5Boney C.M. Verma A. Tucker R. Vohr B.R. Metabolic syndrome in childhood: Association with birth weight, maternal obesity, and gestational diabetes mellitus Pediatrics 200511529029610.1542/peds.2004-180815741354 · doi ↗ · pubmed ↗
- 6Köksal N. Özkan H. Gider C. Kiliçbay I. Kiliçbay F. Can S. Öcal M. Long term Follow-up of Babies with Low Birth Weight (SGA) According to Gestational Age—Review J. Curr. Pediatr.200427379
- 7Fenton T.R. Kim J.H. A systematic review and metaanalysis to revise the Fenton growth chart for premature infants BMC Pediatr.2013135910.1186/1471-2431-13-5923601190 PMC 3637477 · doi ↗ · pubmed ↗
- 8Villar J. Giuliani F. Bhutta Z.A. Bertino E. Ohuma E.O. Ismail L.C. Barros F.C. Altman D.G. Victora C. Noble J.A. Postnatal growth standards for preterm infants: The Preterm Postnatal Follow-up Study of the INTERGROWTH-21(st) Project Lancet Glob. Health 20153 e 681e 69110.1016/S 2214-109X(15)00163-126475015 · doi ↗ · pubmed ↗