Transcriptomic Profiling of Hypoxia-Adaptive Responses in Tibetan Goat Fibroblasts
Lin Tang, Li Zhu, Zhuzha Basang, Yunong Zhao, Shanshan Li, Xiaoyan Kong, Xiao Gou

TL;DR
This study identifies gene-environment interactions in Tibetan goats that help them adapt to high-altitude hypoxia, offering insights for breeding and biomedical research.
Contribution
The study reveals transcriptional plasticity as a key mechanism in hypoxia adaptation through novel integration of RNA-seq, WGCNA, and machine learning.
Findings
Interaction-driven DEGs outnumber breed-specific and oxygen-responsive DEGs, highlighting transcriptional plasticity.
Environmental Stress Genes are enriched in oxidative stress defense and metabolic adaptation pathways.
Genetic Adaptation Genes are enriched in vascular remodeling and transcriptional regulation pathways.
Abstract
The Tibetan goat (Capra hircus) has evolved genetic adaptations to high-altitude hypoxia. This study integrated RNA sequencing (RNA-seq), weighted gene co-expression network analysis (WGCNA), and machine learning to explore gene–environment interactions (G × E) in hypoxia adaptation. Fibroblasts derived from the Tibetan goat and lowland goat were cultured under hypoxic (1% O2) and normoxic (21% O2) conditions, revealing transcriptional plasticity as a key mechanism. Our findings provide novel insights into high-altitude livestock breeding and hypoxia-related biomedical research. The Tibetan goat (Capra hircus) exhibits remarkable adaptations to high-altitude hypoxia, yet the molecular mechanisms remain unclear. This study integrates RNA-seq, WGCNA, and machine learning to explore gene-environment interactions (G × E) in hypoxia adaptation. Fibroblasts from the Tibetan goat and Yunling…
Genes, proteins, chemicals, diseases, species, mutations and cell lines named across the full text — each resolved to its canonical identifier and authoritative record.
Click any figure to enlarge with its caption.
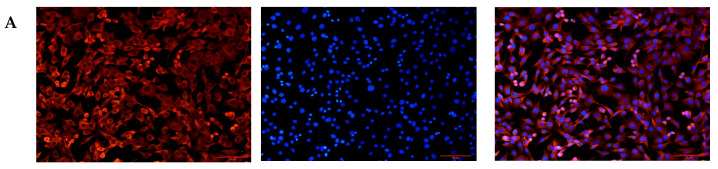 Figure 1
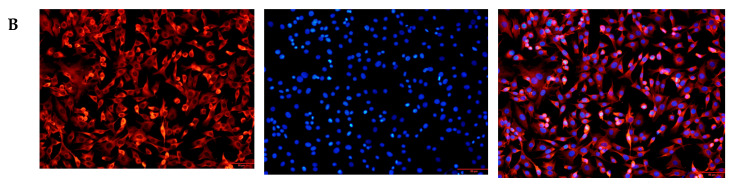 Figure 2
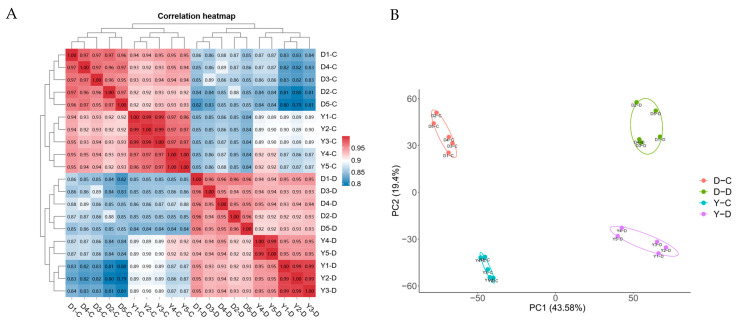 Figure 3
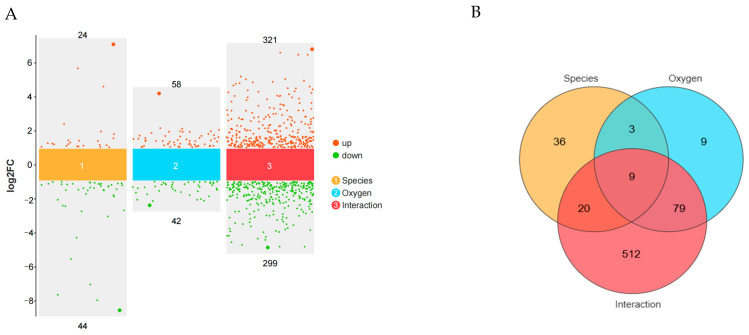 Figure 4
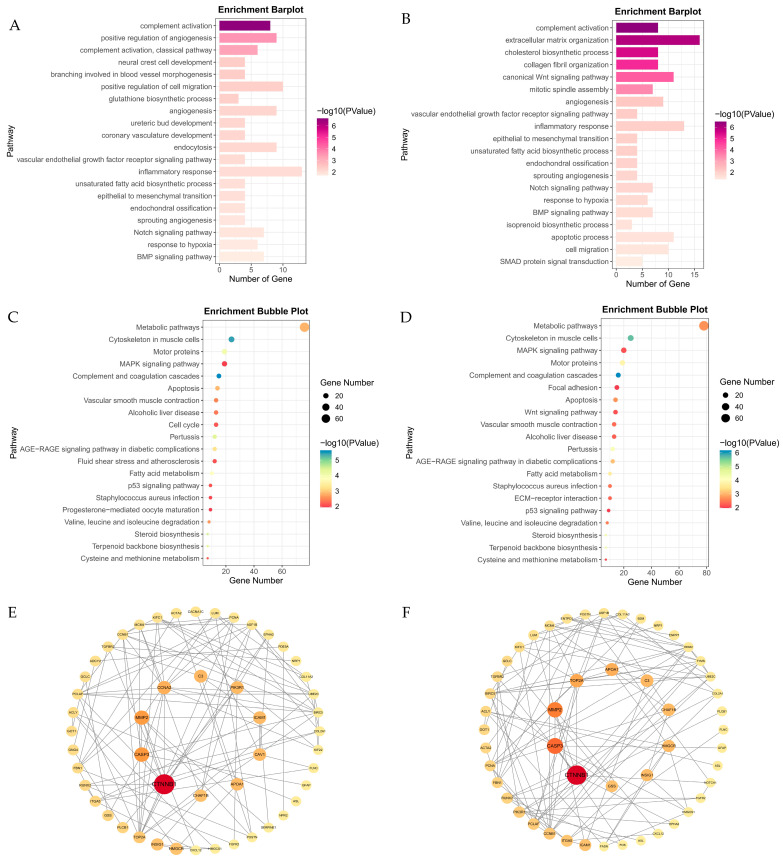 Figure 5
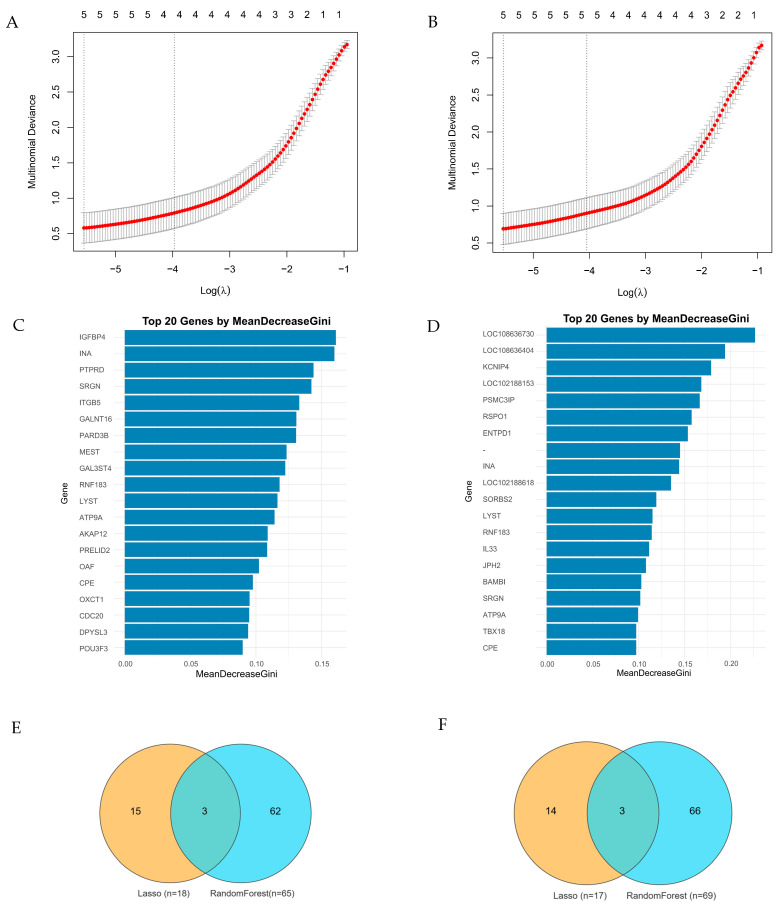 Figure 6
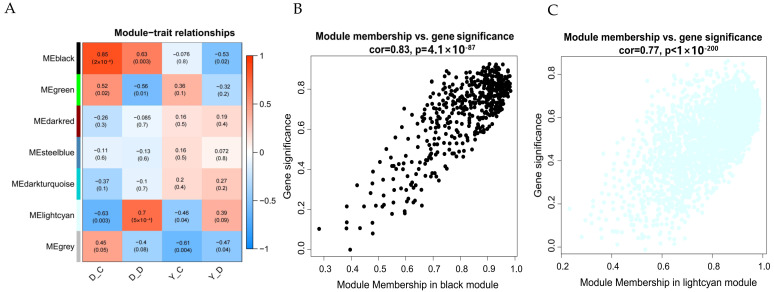 Figure 7
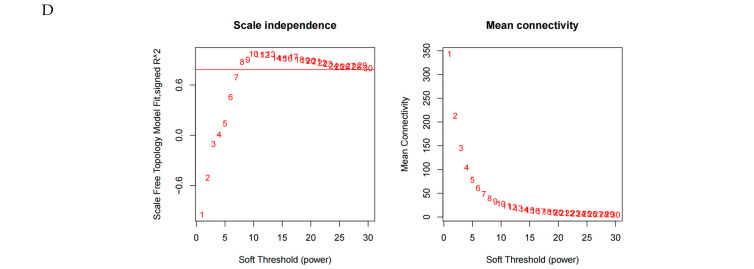 Figure 8
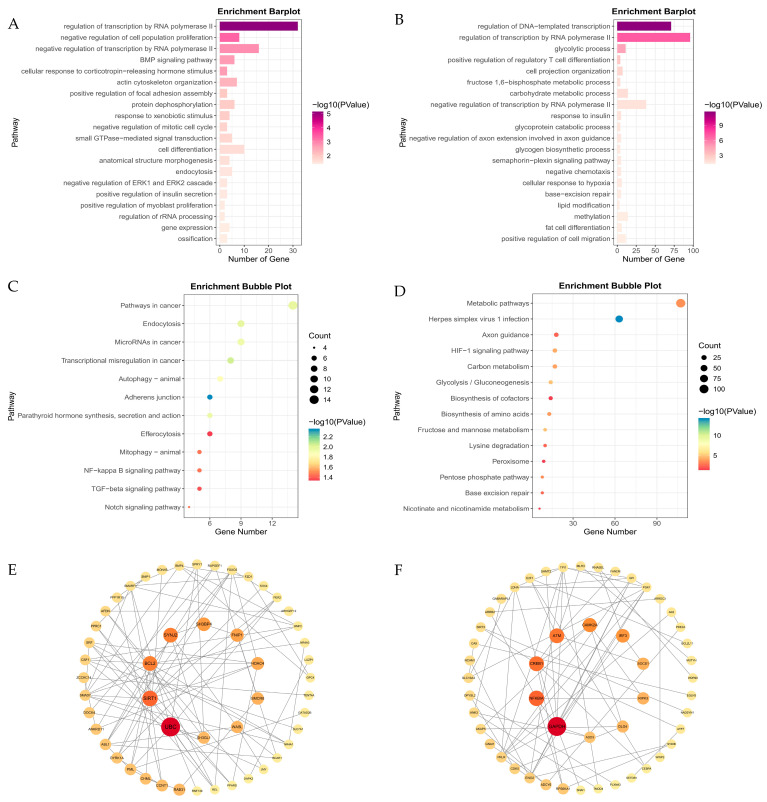 Figure 9
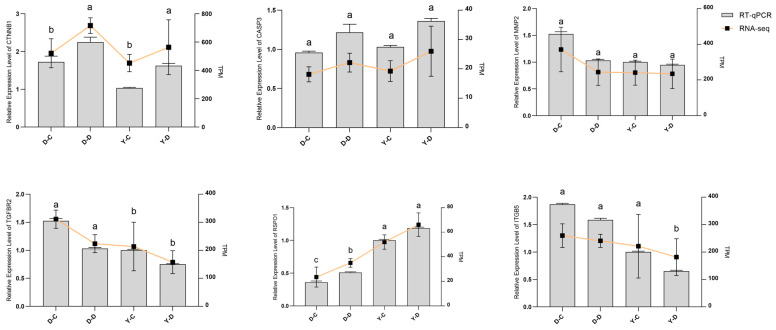 Figure 10
- —Basic Research Program of Yunnan Province—General Program
- —University Fund Project of Xichang University
Peer Reviews
No public reviews on file for this paper yet. If you reviewed it on a platform where reviews are public (OpenReview, ICLR, NeurIPS, ICML), you can paste yours below so the community can read it here.
Videos
No videos yet. Explain this paper in a talk, walkthrough, or lecture? Add one.
Taxonomy
TopicsAdipose Tissue and Metabolism · Cancer, Hypoxia, and Metabolism · High Altitude and Hypoxia
1. Introduction
The Tibetan goat (Capra hircus), native to the Himalayan mountain range, exhibits remarkable genetic and physiological adaptations to extreme high-altitude environments characterized by chronic hypoxia, low temperatures, and intense UV radiation. Key adaptations include elevated hemoglobin levels [1] and metabolic adjustments [2] that optimize oxygen utilization. However, the molecular mechanisms underlying this hypoxia adaptation remain incompletely understood.
Genomic evidence from the Tibetan goat suggests that the adaptive evolution of genes associated with cardiovascular regulation, such as EPAS1 and LDB2, metabolic homeostasis maintenance, including PAPSS2 and DSG3, and vascular remodeling, driven by factors like FGF2 and MITF, likely forms the genetic basis of hypoxia tolerance [3,4,5]. Notably, the PAPSS2 gene, likely introgressed from the wild goat species Capra falconeri, plays a pivotal role in reprogramming energy metabolism [3]. Selection signature analyses further revealed significant enrichment of the VEGF signaling pathway in Tibetan goat populations inhabiting Nagqu, Tibet, with core hub genes such as EGFR, AKT1, and PTEN promoting hypoxia adaptation by coordinating angiogenesis and cellular survival mechanisms [6]. Exome sequencing identified 339 high-altitude-selected genes, including EPAS1, whose Q579L missense mutation was exclusively detected in high-altitude populations [7]. At the molecular level, the HIF signaling pathway serves as a central regulatory axis, driving vascular remodeling and oxygen transport optimization through upregulation of HIF-1α and its downstream targets like VEGF [8]. These findings collectively establish a systemic framework linking genetic variations to physiological phenotypes, providing multidimensional insights into the molecular mechanisms of hypoxia adaptation in plateau-dwelling species.
High-altitude adaptation is shaped by gene–environment (G × E) interactions, yet the mechanisms governing these interactions remain elusive. Hypoxic cell culture models serve as robust tools to simulate high-altitude conditions in vitro. At the cellular level, hypoxia modulates genes in the MMP2, MMP9, and HIF-1 signaling pathways in pig cells [9,10], while yak fibroblasts exhibit distinct hypoxia-adaptive gene expression patterns under varying stress durations [11]. However, research on the Tibetan goat in this domain remains scarce. To further elucidate G × E dynamics in the Tibetan goat, we integrated transcriptomic data, weighted gene co-expression network analysis (WGCNA), and machine learning approaches to identify key genetic drivers of hypoxia adaptation. Through this study, we aim to unravel how genetic adaptations functionally interact with hypoxic stress. These findings advance novel insights into high-altitude adaptation, with implications for evolutionary biology, livestock breeding, and biomedical research.
2. Materials and Methods
2.1. Sampling of Ear Tissues from Tibetan Goat and Yunling Goat in Yunnan Province
Ear tissue samples were collected from Tibetan goats in the Diqing Tibetan Autonomous Prefecture (D, 3300 m), Yunnan Province, China, and Yunling goats in Yuanjiang (Y, 500 m), Yunnan Province, China. Five one-year-old goats were randomly selected from each group. Prior to tissue collection, ear tips were disinfected and depilated. A one-cubic-millimeter tissue fragment was aseptically excised, immediately immersed in Dulbecco’s Modified Eagle Medium (DMEM; Gibco, Miami, FL, USA) supplemented with 1% penicillin–streptomycin (P/S), and stored at 4 °C. The samples were transported to the laboratory within 12 h to maintain viability and prevent contamination.
2.2. Isolation, Culture and Identification of Goat Fibroblast Cells
Ear tissue samples were enzymatically digested using 0.1% collagenase type I for 4 h. Following digestion, the cell suspension was filtered and transferred into T25 culture flasks. Cells were maintained in DMEM supplemented with 10% fetal bovine serum (FBS; Gibco) and incubated at 37 °C under 5% CO_2_. Adherent cells were observed within 24 h and harvested at 90% confluency for subsequent analyses. Immunofluorescence staining was performed to confirm fibroblast identity. Fibroblasts in the logarithmic growth phase were trypsinized and seeded into six-well culture plates containing pre-sterilized glass coverslips. At 80% confluence, cells were fixed with 4% paraformaldehyde for 30 min, permeabilized with 0.5% Triton X-100, and blocked with 5% bovine serum albumin (BSA). Slides were incubated overnight at 4 °C with a primary anti-Vimentin antibody (10366-1-AP, 1:400, Proteintech, Rosemont, IL, USA) followed by a secondary Alexa Fluor 555-labeled Donkey Anti-Rabbit IgG(H + L) antibody (1:200, Beyotime, Haimen, China). Nuclei were stained with DAPI, and fluorescence images were captured using an OLYMPUS fluorescence microscope.
2.3. Hypoxic and Normoxic Treatment of Cell Cultures
Fibroblasts derived from Tibetan goat (D, 3300 m) and Yunling goat (Y, 500 m) ear tissue were seeded at a density of 2 × 10^5^ cells/mL in 6-well plates and pre-incubated at 37 °C under normoxia conditions (21% O_2_, 5% CO_2_) for 24 h. After pre-incubation, the cells were divided into four groups; fibroblasts from Tibetan goat were cultured under normoxic conditions (D-C, 21% O_2_, 5% CO_2_) and hypoxic conditions (D-D, 1% O_2_, 5% CO_2_), while fibroblasts from Yunling goat were cultured under normoxic conditions (Y-C, 21% O_2_, 5% CO_2_) and hypoxic conditions (Y-D, 1% O_2_, 5% CO_2_). For hypoxia treatment, cells were transferred to a tri-gas incubator (Baker Ruskinn InvivO_2_ 400, Sanford, ME, USA) and cultured under 1% O₂ and 5% CO₂ at 37 °C, balanced with N₂, for 48 h. Normoxic control cells were maintained under standard culture conditions (37 °C, 21% O_2_, 5% CO_2_) for the same duration.
2.4. Sample Collection, RNA Extraction and RNA Sequencing
Total RNA was extracted using TRIzol™ Reagent (Thermo Fisher Scientific, Waltham, MA, USA) following the manufacturer’s protocol. RNA concentration was measured with a Nanodrop 2000 spectrophotometer, and integrity was assessed using the RNA Nano 6000 Assay Kit (Agilent Technologies, Santa Clara, CA, USA) on an Agilent Bioanalyzer 2100 system. Only high-quality RNA samples with an RNA Integrity Number (RIN) above 7.0 were selected for subsequent library preparation. mRNA sequencing was performed on an Illumina NovaSeq 6000 platform (Illumina, Inc., San Diego, CA, USA) with paired-end sequencing (PE150, 2 × 150 bp) at Beijing Novogene (Beijing, China).
2.5. RNA-Seq Analysis
Raw paired-end reads were processed using Fastp (v0.12.3) [12] to remove low-quality reads (<50 bp or >6 ambiguous bases (‘N’)). Clean reads were aligned to the goat reference genome ARS1 using HISAT2 (v2.1) [13]. SAM files were converted to BAM format using Samtools (v1.13) [14]. FeatureCounts (v2.0) [15] was used to quantify raw read counts, which were normalized to Transcripts per Million (TPM). Differential expression analysis was conducted using limma (v3.46.0) [16], employing a 2 × 2 interaction model to evaluate oxygen concentration and breed factors as well as their interaction (Table 1). Differentially expressed genes (DEGs) were identified based on an adjusted p-value < 0.05 and |log2FoldChange| ≥ 1. DEGs were classified into three groups: breed effect DEGs (Tibetan goat vs. Yunling goat), oxygen effect DEGs (normoxia vs. hypoxia), and interaction effect DEGs (breed-specific hypoxia responses). Two custom gene sets were defined: Environmental Stress Genes (E ∪ I) and Genetic Adaptation Genes (G ∪ I). A complete list of DEGs is provided in Supplementary Table S2. Functional enrichment analysis, including Gene Ontology (GO) and Kyoto Encyclopedia of Genes and Genomes (KEGG) pathway analyses, was performed using DAVID.
2.6. Machine Learning Analysis
To identify key genetic factors in hypoxic adaptation, we applied Lasso regression and Random Forest approaches to environmental stress genes and genetic adaptation genes, respectively. Lasso, a machine learning technique integrating variable selection and regularization, was employed to enhance predictive accuracy [17]. The Lasso model was constructed using the “glmnet” package with L1-norm regularization, while 10-fold cross-validation ensured model robustness and minimized overfitting risks [18]. For Random Forest implementation, we ranked gene importance through mean decrease in Gini index [19], utilizing the randomForest package to build the model. Genes with importance values exceeding the 90th percentile threshold were prioritized for further analysis. To ensure biological relevance, the Boruta algorithm was concurrently implemented to validate feature importance and eliminate random noise interference. The mtry parameter was optimized through cross-validation to balance model complexity and overfitting potential. The intersection of results from both approaches served as candidate hub genes. These machine learning approaches collectively identified genetic markers potentially associated with hypoxic adaptation, providing mechanistic insights into molecular pathways underlying high-altitude adaptation.
2.7. Weighted Gene Co-Expression Network Analysis (WGCNA)
WGCNA [20] was conducted to identify gene modules associated with hypoxic response. The WGCNA package in R was utilized to construct a gene co-expression network, and key modules linked to hypoxia were identified for further exploration. This analysis facilitated the understanding of gene interactions and regulatory pathways involved in the cellular response to hypoxic stress.
2.8. Protein–Protein Interaction Network Analysis
The STRING database (http://cn.string-db.org (accessed on 15 February 2025)) was utilized to analyze the protein–protein interaction (PPI) network of both environmental stress genes and genetic adaptation genes. The resulting PPI network was visualized using Cytoscape (v3.7.1) [21]. The betweenness centrality (BC) of the network was calculated using the cytoNCA plugin, identifying the top 50 genes with the highest BC values, which would be likely to play central roles in the interaction network.
2.9. Quantitative RT-PCR Analysis
To validate the RNA-seq results, quantitative reverse transcription polymerase chain reaction (RT-qPCR) was performed on six selected genes, with β-actin used as the internal reference. cDNA was synthesized using the PrimeScript™ RT reagent Kit with gDNA Eraser (Takara, RR047A, Kyoto, Japan), following the manufacturer’s protocol. Primer sequences for each gene were designed using Primer Premier 6.25 software. SYBR Green assays were performed with TB Green^®^ Premix Ex Taq™ II (Tli RNaseH Plus) (Takara, RR820A, Kyoto, Japan) on a CFX96 Touch™ Real-Time PCR Detection System (Bio-Rad, Hercules, CA, USA). The reaction setup and thermal cycling conditions strictly followed the manufacturer’s protocols. The PCR reaction was carried out in a total volume of 25 μL containing 12.5 μL TB Green Premix Ex Taq II (Tli RNaseH Plus) (2×), 8.5 μL RNase-free water, 2 μL cDNA template, and 1 μL each of forward and reverse primers (10 μmol/mL). The amplification protocol consisted of initial denaturation at 95 °C for 30 s, followed by 40 cycles of denaturation (95 °C for 5 s) and annealing (60 °C for 30 s), with a final melt curve analysis from 65 °C to 95 °C at a ramp rate of 0.5 °C increments per step. Each sample was run in triplicate, and the relative expression levels of the genes were calculated using the 2^−ΔΔCt^ method, with β-actin serving as the normalization control, providing confirmation of the RNA-seq results. The primer sequences used for RT-qPCR validation are provided in Table 2.
3. Results
3.1. Cultivation and Identification of Goat Fibroblast Cells
Goat ear tissue was digested with collagenase and cultured. Cells were observed to adhere to the culture surface within 24 h. By day 4–5, spindle-shaped or fusiform cells with typical fibroblast morphology were clearly visible. After two rounds of purification using the differential adhesion method, a relatively pure population of fibroblast cells was obtained. Immunofluorescence staining was performed to confirm the identity of the isolated cells. Vimentin-positive cells exhibited red fluorescence, while the nuclei were counterstained with DAPI, displaying blue fluorescence. The merged image revealed a high percentage of positive cells (Figure 1). These results indicate that the experiment successfully isolated a highly pure population of goat fibroblast cells from ear tissue.
3.2. Summary of mRNA Data
We obtained 255.4 GB of clean bases and 1464 million clean reads from 20 samples, with an average sequencing yield of 12.77 GB per sample. The Q20 values exceeded 97%, Q30 values were above 91%, and the GC content remained stable at ~50%, ensuring high data quality (Table S1). The clean reads ranged from 63.8 M to 116.5 M, with D1-C and D4-C exhibiting the highest sequencing depth, while D5-D had the lowest. To assess data reliability, Pearson’s correlation and principal component analysis (PCA) were performed based on TPM values. Strong within-group correlations (>0.94) were observed (Figure 2A), while PCA revealed distinct clustering between groups, with PC1 explaining 43.58% of variance and PC2 19.4% (Figure 2B). These results confirm that the sequencing data were of high quality and suitable for downstream bioinformatics analyses.
3.3. Analysis of Differentially Expressed Genes (DEGs) and Functional Enrichment
To identify genetic factors associated with hypoxia adaptation, differentially expressed genes (DEGs) were classified based on breed, oxygen concentration, and their interaction effects, yielding 68 DEGs in the breed effect group (24 upregulated, 44 downregulated), 100 DEGs in the oxygen effect group (58 upregulated, 42 downregulated), and 620 DEGs in the interaction effect group (321 upregulated, 299 downregulated) (Figure 3A). Further classification identified 632 environmental stress genes and 659 genetic adaptation genes based on the union of oxygen-related and breed-related DEGs, respectively (Figure 3B). A complete list of DEGs and their classifications is provided in Supplementary Table S2.
DEG analysis identified 632 environmental stress genes and 659 genetic adaptation genes based on oxygen- and breed-related effects (Figure 3A,B; Table S2). GO and KEGG analyses revealed that environmental stress genes were enriched in angiogenesis and VEGF signaling, suggesting vascular remodeling enhances oxygen delivery. Additionally, inflammatory response and glutathione biosynthesis enrichment indicate immune regulation and oxidative stress defense. KEGG pathways, including MAPK signaling, vascular smooth muscle contraction, and fluid shear stress, suggest hemodynamic adaptation, while fatty acid metabolism and apoptosis regulation highlight metabolic reprogramming (Figure 4A,C; Table S3). Genetic adaptation genes also showed enrichment in hypoxia response, angiogenesis, and blood vessel regulation, indicating long-term vascular remodeling. Enrichment of TGF-β signaling and apoptosis regulation suggests genetic modulation of cell survival. KEGG analysis further confirmed MAPK signaling, vascular contraction, and glutathione metabolism as key pathways optimizing oxygen utilization and oxidative stress resistance (Figure 4B,D; Table S4). The PPI network revealed distinct regulatory patterns between environmental stress and genetic adaptation genes. In the environmental stress network (Figure 4E; Table S5), CTNNB1 was the central hub (BC = 27,649.34), interacting with CASP3 and MMP2. Other key genes (CAV1, PIK3R1, ICAM1, APOA1) were associated with cellular response to hypoxia (GO:0001666) and cholesterol metabolism (GO:0008203), indicating that stress responses and metabolic changes play dominant regulatory roles under hypoxic stress conditions. In the genetic adaptation network (Figure 4F; Table S5), CTNNB1 remained a central hub (BC = 24,717.29) and continued to interact with CASP3 and MMP2. However, other key genes (TGFBR2, RUNX2, FBN1, TOP2A, INSIG1) were associated with vascular regulation (GO:0045766, GO:0001569), the BMP signaling pathway (GO:0030509), and the TGF-β signaling pathway (chx04350), suggesting that vascular and tissue remodeling, as well as transcriptional regulation, play dominant roles during long-term adaptation. Overall, the environmental stress network drives immediate responses through stress responses and metabolism, while the genetic adaptation network promotes long-term hypoxia tolerance via vascular and tissue remodeling and transcriptional regulation, highlighting the interplay between physiological stress responses and evolutionary adaptation.
3.4. Key Transcription Genes During Hypoxia Stress Identified by Machine Learning
To elucidate the genetic basis of hypoxia adaptation, we applied Lasso regression and Random Forest to identify key genes from environmental stress genes (n = 632) and genetic adaptation genes (n = 659) (Table S6). Among the environmental stress genes, Lasso regression identified 18 genes while Random Forest detected 65 genes (Table S6), with MAP3K5, TGFBR2, and ITGB5 emerging as overlapping candidate genes between the two approaches (Figure 5E). Similarly, among the genetic adaptation genes, Lasso regression selected 17 genes whereas Random Forest recognized 69 genes (Table S6), where RSPO1, TGFBR2, and ITGB5 were consistently screened by both analytical methods (Figure 5F).
3.5. Key Transcription Genes During Hypoxia Stress Identified by WGCNA
The soft-threshold power in this research was calibrated to 8 (scale-free R^2^ = 0.85) (Figure 6D). The module-trait and gene significance analyses reveal the distinct roles of MEblack and MElightcyan in hypoxic adaptation (Table S7). The MEblack module exhibited significant positive correlations with traits in Tibetan goat cell groups (D-C: correlation coefficient = 0.85, p = 2 × 10^−6^; D-D: 0.63, p = 0.003; Figure 6A). In contrast, it showed negative correlations in Yunling goat cell groups (Y-D: correlation coefficient = −0.53, p = 0.02). This distinct divergence suggests that MEblack may represent fundamental adaptive mechanisms specific to high-altitude groups, potentially involving genes critical for maintaining cellular homeostasis under hypoxic conditions. Conversely, MElightcyan shows positive correlations in hypoxic conditions (D-D: cor = 0.70, p = 5 × 10^−4^; Y-D: cor = 0.39, p = 0.02) and negative correlations in normoxia (D-C: cor = −0.63, p = 0.003; Y-C: cor = −0.45, p = 0.03), highlighting its key role in hypoxic stress responses (Figure 6A). Further analysis of module membership (MM) vs. gene significance (GS) confirms these roles, with MEblack showing a strong MM–GS correlation (cor = 0.83, p = 4.1 × 10^−87^; Figure 6B) and MElightcyan exhibiting a robust correlation (cor = 0.77, p < 1 × 10^−200^; Figure 6C). These results suggest that MEblack mediates long-term hypoxia adaptation, whereas the MElightcyan module regulates hypoxic stress responses, particularly in the Tibetan goat.
To investigate the role of the black and light cyan modules in hypoxia adaptation, we integrated GO_BP, KEGG pathway enrichment, and PPI network analyses, revealing key molecular mechanisms of hypoxia tolerance in plateau animals.
In the black module (Table S8), GO_BP enrichment (Figure 7A; Table S9) identified transcriptional regulation (GO:0006357) and the BMP signaling pathway (GO:0030509). KEGG analysis (Figure 7C; Table S9) further revealed enrichment in the Notch signaling pathway (chx04330), NF-κB signaling pathway (chx04064), TGF-β signaling pathway (chx04350), and autophagy (chx04140), highlighting the role of gene transcription regulation. PPI analysis (Figure 7E; Table S11) identified the core genes UBC, SMCR8, and WASL, which are involved in pathways related to autophagy (chx04140, chx04137). Additionally, other key genes participate in RNA and protein synthesis processes, further reinforcing the role of the black module in transcriptional regulation during long-term hypoxia adaptation.
In the light cyan module (Table S8), GO_BP analysis (Figure 7B; Table S10) identified cellular response to hypoxia (GO:0071456) and glycolysis (GO:0006096), including key glycolytic genes such as EGLN1, EGLN3, GPI, ENO1, PGK1, and PFKP that support ATP production under hypoxia. KEGG analysis (Figure 7D; Table S10) further emphasized the HIF-1 signaling pathway (chx04066) and glycolysis/gluconeogenesis (chx00010), highlighting the roles of stress response and metabolic changes under hypoxic stress. In PPI analysis (Figure 7F; Table S11), the core gene GAPDH was involved in glycolysis (GO:0006096, chx00010) and the HIF-1 signaling pathway (chx04066).
These findings suggest that the light cyan module, together with the environmental stress genes, primarily responds to hypoxic stress through stress responses and glycolytic metabolism. In contrast, the black module, together with the genetic adaptation genes, mainly participates in long-term hypoxia adaptation through its role in transcriptional regulation.
3.6. RT-qPCR Validation of RNA-Seq Results
To validate the RNA-seq results, RT-qPCR was performed on six randomly selected genes with β-actin as the internal reference. The selected genes, including CTNNB1, CASP3, MMP2, TGFBR2, ITGB5, and RSPO1, represent a subset of candidate genes screened in this study. The findings revealed that the expression levels of these genes exhibited consistent trends with the RNA sequencing results (Figure 8). These results confirm the reliability of the RNA-seq data and highlight the functional relevance of the identified genes in Tibetan goats’ adaptation to high-altitude environments.
4. Discussion
Gene–environment interactions (G × E) are central to hypoxia adaptation, with transcriptional plasticity playing a more dominant role than fixed genetic variation [22,23]. Our findings demonstrate that the number of DEGs driven by interaction effects (n = 620) far exceeded those associated with breed effects (n = 68) or oxygen effects (n = 100), highlighting the critical role of gene–environment interactions in the Tibetan goat’s hypoxic adaptation mechanisms. Functional categorization revealed two distinct sets of genes: environmental stress genes (n = 632), enriched in oxidative stress response, immune regulation, and metabolic adaptation, which promote hypoxic stress responses through cytokine signaling and hemodynamic adaptation; and genetic adaptation genes (n = 659), associated with transcriptional regulation, TGF-β signaling, and apoptosis regulation, which support long-term structural changes to tolerate hypoxia. Further identification via machine learning found TGFBR2 and ITGB5. TGFBR2, a receptor for TGF-β cytokine, forms a heterodimeric complex with TGFBR1. Its combination with TGF-β regulates many physiological and pathological processes. Studies show that in pulmonary hypertension models, TGFBR2’s transcriptional activation under hypoxia is suppressed, and the interaction between its promoter and distal enhancer is weakened [24]. In prostate cancer research, hypoxia-induced EZH2 causes hypermethylation of the TGFBR2 promoter, reducing its expression [25]. In this study, the expression of TGFBR2 was downregulated under hypoxia, which is consistent with previous studies. As an integrin β subunit member, ITGB5 is proven to be involved in ROS and angiogenesis regulation [26,27], and it may participate in hypoxia regulation through this pathway. However, its mechanism needs further exploration.
In the PPI networks of two different gene sets, CTNNB1 (Catenin Beta-1) was found to be in the central position. CTNNB1 is a key component of the canonical Wnt signaling pathway. HIF-1α can activate Wnt signaling by binding to its key components [28]. In fibroblasts, CTNNB1 (β-catenin) is essential for HIF-1α accumulation, and its knockdown reduces VEGF secretion. Therefore, fibroblasts can activate VEGFR2 through HIF-1α -and CTNNB1-dependent mechanisms [29]. CASP3, which interacts with CTNNB1 in the PPI network, is targeted by miRNAs in yaks and activated in hypoxia to reduce hypoxia - induced apoptosis [30,31]. MMP2, which belongs to the matrix metalloproteinase (MMP) family, has a wide range of functions in hypoxic conditions. Its homeostasis is crucial for regulating hypoxia-induced pulmonary vascular remodeling [32] and also serves as a key factor in the hypoxic response of adipocytes in mice [33]. Additionally, under hypoxic conditions, the expression of MMP2 and MMP9 increases, accompanied by the activation of nuclear factor-κB (NF-κB)/HIF-1α [34].
WGCNA identified two hypoxia-related modules: the black module, predominantly active under chronic hypoxia, was enriched in transcriptional regulation and BMP signaling pathways [35,36], while the light cyan module, associated with hypoxic stress, was enriched in HIF-1 signaling and glycolysis, regulating hypoxia-induced metabolic reprogramming [37,38,39]. Transcriptional regulation represents a core mechanism of hypoxia adaptation, enabling organisms to modulate gene expression in response to oxygen deprivation [40]. In the black module, our study highlighted the enrichment of key pathways, including RNA polymerase II-mediated transcriptional regulation (GO:0006357, GO:0000122), driven by transcription factors such as FOXO3, HEXIM1, and PPARD. FOXO3, a member of the FOXO transcription factor family, plays a central role in regulating metabolism, oxidative stress responses, and cell cycle progression. Hypoxia-induced suppression of the tricarboxylic acid (TCA) cycle and reduced α-ketoglutarate levels inhibit prolyl hydroxylase domain (PHD)-mediated prolyl hydroxylation of FOXO3, thereby decreasing its degradation via the ubiquitin–proteasome pathway—a stabilization mechanism analogous to HIF under hypoxic conditions [41]. HEXIM1 regulates RNA polymerase II activity by controlling the localization and activity of positive transcription elongation factor b (pTEFb) and modulates erythroid gene expression and function. Overexpression of HEXIM1 promotes erythrocyte proliferation and fetal hemoglobin expression [42]. PPARD (peroxisome proliferator-activated receptor delta) protects cells under hypoxia through multiple mechanisms, such as stabilizing HIF-1α, promoting vascular repair [43,44], and alleviating inflammation. Hypoxia upregulates and activates PPARD in endothelial cells, which stabilizes HIF-1α protein by preventing its ubiquitin-mediated degradation [45].
Furthermore, the black module was enriched in the BMP signaling (GO:0030509) and TGF-β signaling pathways (KEGG: chx04350). Under hypoxia, the expression of BMP2 and BMP4 is upregulated, activating BMP signaling—consistent with our findings [46,47]. The BMP signaling pathway regulates intracellular signaling and transcriptional activation via Smad-dependent pathways. For instance, it inhibits PHD enzyme activity, prolongs the half-life of HIF-1α, and forms a positive feedback loop to enhance hypoxia adaptation [46,48]. Both TGF-β and BMP signaling pathways belong to the TGF-β superfamily, with hypoxia serving as an upstream trigger for TGF-β signaling. The deubiquitinase USP9X, a downstream effector of TGF-β, stabilizes HIF-2α through hydroxylation- and ubiquitination-dependent mechanisms under hypoxia, thereby promoting cellular adaptation [49]. These findings underscore the multi-layered adaptive strategies employed by the Tibetan goat to maintain oxygen homeostasis under chronic hypoxia, balancing immediate transcriptional responses with long-term structural remodeling.
In the light cyan module, we observed enrichment of cellular response to hypoxia (GO:0071456) and the HIF-1 signaling pathway (KEGG: chx04066). The HIF-1 signaling pathway is pivotal for hypoxia adaptation. Under normoxia, the HIF-1α subunit is hydroxylated by prolyl hydroxylases, recognized by von Hippel–Lindau (VHL) protein, and targeted for ubiquitination and degradation. Under hypoxia, hydroxylation of HIF-1α is inhibited, allowing its stabilization and nuclear translocation, where it dimerizes with HIF-1β to activate hypoxia-response elements. EGLN1 and EGLN3, which directly regulate HIF-1α stability via oxygen-dependent hydroxylation [50,51], were identified in our analysis. This regulatory network is evolutionarily conserved in high-altitude species, including yaks [52,53], Tibetan pigs [54], Tibetan chickens [55], and Tibetan sheep [37], whereas lowland species exhibit limited hypoxia tolerance, highlighting the evolutionary significance of HIF-1α regulation [40]. Our findings reinforce this evolutionary convergence, emphasizing its critical role in shaping hypoxia tolerance. Under hypoxia, the expression of NDRG1 is upregulated, aligning with our results [56]. NDRG1 modulates the PI3K-Akt, p53, and HIF-1 signaling pathways, influencing cell growth, differentiation, and stress responses, and plays a key role in hypoxia-induced vascular remodeling [57]. VEGFA, a canonical HIF-1α target gene, is induced under hypoxia to stimulate angiogenesis, thereby enhancing oxygen and nutrient delivery to tissues—a critical mechanism for hypoxia adaptation [58]. This gene has also been observed in our study and is implicated in vascular remodeling to improve oxygen transport and blood supply in high-altitude species, including humans [59,60], yaks [61], Tibetan pigs [62], Tibetan sheep [8], and plateau zokors [63].
Additionally, the turquoise module showed enrichment in glycolysis (GO:0006096) and glycolysis/gluconeogenesis (KEGG: chx00010). Metabolic adaptation is essential for maintaining ATP production under hypoxia, and Tibetan goats exhibit a shift toward anaerobic metabolism. Key glycolytic enzymes, including GAPDH, PGK1, PFKP, PDK1, ENO1, ENO2, and LDH-A [64,65], were upregulated in our study, with GAPDH occupying a central position in the PPI network. This indicates enhanced glycolysis as a primary energy supply pathway under hypoxic stress. Similar metabolic adjustments are observed in yaks, which optimize energy metabolism to survive extreme high-altitude environments [37], and in other plateau animals such as Tibetan chickens and Tibetan sheep, where pathways related to carbohydrate metabolism are also enriched [66,67]. Beyond glycolysis, Tibetan goats demonstrate enhanced fatty acid metabolism and mitochondrial efficiency, as evidenced by upregulation of SIRT3 and CAMK2A in the turquoise module [68,69]. These adaptations parallel those observed in Tibetan sheep and yaks, where fatty acid oxidation reduces reliance on oxygen-intensive ATP synthesis [70,71].
In summary, the Tibetan goat employs multi-layered genetic and molecular mechanisms to synergistically adapt to high-altitude hypoxia. Environmental stress genes mediate acute hypoxic responses through cytokine signaling and hemodynamic adaptations, while genetic adaptation genes drive long-term structural remodeling via transcriptional regulation and epigenetic modifications. The core of this adaptation lies in the dynamic integration of gene–environment interactions (G × E) with transcriptional regulatory networks and key signaling pathways, forming a plasticity-driven, multi-level adaptive system. This system balances hypoxic stress responses with chronic oxygen homeostasis, ultimately achieving synergistic coordination between hypoxia tolerance and energy metabolism efficiency.
5. Conclusions
The findings highlight a hypoxia adaptation mechanism in the Tibetan goat characterized by a multi-layered adaptive system dominated by transcriptional plasticity, driven by gene–environment (G × E) interactions that integrate dynamic transcriptional regulatory networks with critical signaling pathways. Future studies should integrate metabolomics and proteomics approaches to systematically analyze the metabolic profiles and protein expression patterns in high- and low-altitude Tibetan goat populations. This multi-omics framework will comprehensively dissect hypoxia-associated dynamic changes in metabolic pathways, identify key metabolite variations, and map protein functional regulatory networks. By integrating metabolomic data (including TCA cycle intermediates and lipid metabolites) with proteomic data (such as oxidative phosphorylation-related enzymes, HIF signaling pathway proteins, and their post-translational modifications), and correlating these findings with transcriptomic profiles, we aim to elucidate the synergistic mechanisms between metabolic remodeling and genetic/epigenetic regulatory factors. Such integration will enable the construction of a multidimensional “gene–protein–metabolite” interaction model to pinpoint core molecular hubs underlying high-altitude adaptation.
Furthermore, the conservation and utilization of Tibetan goats’ unique genetic resources will not only safeguard genetic diversity but also facilitate molecular marker development for breeding programs through the establishment of multi-omics databases. The hypoxia adaptation mechanisms of Tibetan goats provide a distinctive cross-species model for biomedical research. Deciphering their genetic and physiological strategies in extreme environments may yield novel insights into human hypoxia-related pathologies and therapeutic targets, particularly in advancing treatment strategies for ischemic diseases such as myocardial infarction and stroke.
The reference list from the paper itself. Each links out to its DOI / PubMed record.
- 1Storz J.F. Hemoglobin-oxygen affinity in high-altitude vertebrates: Is there evidence for an adaptive trend?J. Exp. Biol.20162193190320310.1242/jeb.12713427802149 PMC 5091379 · doi ↗ · pubmed ↗
- 2Zhao B. Suo L. Wu Y. Chen T. Tulafu H. Lu Q. Liu W. Sammad A. Wu C. Fu X. Stress adaptation in Tibetan cashmere goats is governed by inherent metabolic differences and manifested through variable cashmere phenotypes Genomics 202411611080110.1016/j.ygeno.2024.11080138286347 · doi ↗ · pubmed ↗
- 3Li C. Wu Y. Chen B. Cai Y. Guo J. Leonard A.S. Kalds P. Zhou S. Zhang J. Zhou P. Markhor-derived Introgression of a Genomic Region Encompassing PAPSS 2 Confers High-altitude Adaptability in Tibetan Goats Mol. Biol. Evol.202239 msac 25310.1093/molbev/msac 25336382357 PMC 9728798 · doi ↗ · pubmed ↗
- 4Guo J. Tao H. Li P. Li L. Zhong T. Wang L. Ma J. Chen X. Song T. Zhang H. Whole-genome sequencing reveals selection signatures associated with important traits in six goat breeds Sci. Rep.201881040510.1038/s 41598-018-28719-w 29991772 PMC 6039503 · doi ↗ · pubmed ↗
- 5Kumar C. Song S. Jiang L. He X. Zhao Q. Pu Y. Malhi K.K. Kamboh A.A. Ma Y. Sequence Characterization of DSG 3 Gene to Know Its Role in High-Altitude Hypoxia Adaptation in the Chinese Cashmere Goat Front. Genet.2018955310.3389/fgene.2018.0055330510564 PMC 6254015 · doi ↗ · pubmed ↗
- 6Jin M. Lu J. Fei X. Lu Z. Quan K. Liu Y. Chu M. Di R. Wei C. Wang H. Selection Signatures Analysis Reveals Genes Associated with High-Altitude Adaptation in Tibetan Goats from Nagqu, Tibet Animals 202010159910.3390/ani 1009159932911823 PMC 7552128 · doi ↗ · pubmed ↗
- 7Song S. Yao N. Yang M. Liu X. Dong K. Zhao Q. Pu Y. He X. Guan W. Yang N. Exome sequencing reveals genetic differentiation due to high-altitude adaptation in the Tibetan cashmere goat (Capra hircus)BMC Genom.20161712210.1186/s 12864-016-2449-0PMC 475808626892324 · doi ↗ · pubmed ↗
- 8Yang K. Zhang Z. Li Y. Chen S. Chen W. Ding H. Tan Z. Ma Z. Qiao Z. Expression and distribution of HIF-1alpha, HIF-2alpha, VEGF, VEGFR-2 and HIMF in the kidneys of Tibetan sheep, plain sheep and goat Folia Morphol.20207974875510.5603/FM.a 2020.001132020576 · doi ↗ · pubmed ↗