How to handle lipemic CBC samples on Sysmex hematology analyzers?
Vanja Radišić Biljak, Lucija Dolovčak, Iva Bakarić, Ana Nikler, Andrea Saračević, Marija Grdić Rajković

TL;DR
This study evaluates how well the Sysmex XN-1000 hematology analyzer handles blood samples with high lipid levels, finding that optical hemoglobin measurement is the most reliable method.
Contribution
The study introduces a validated method for managing lipemic CBC samples using optical hemoglobin measurement on the Sysmex XN-1000.
Findings
Hb-O measurements showed no significant bias compared to initial Hb measurements, even with varying lipemia levels.
Replacing lipemic plasma with diluent led to a small but significant bias in Hb measurements.
Recalculating Hb based on plasma measurements resulted in large, unacceptable bias.
Abstract
Lipemia poses a significant preanalytical problem for complete blood count (CBC) measurement due to limited and non-standardized methods for recognition and removal. We aimed to verify the optical hemoglobin (Hb-O) measurements on the Sysmex XN-1000 hematology analyzer (HA) as a possible reliable method for managing lipemic CBC samples. Ninety CBC samples with varying Hb concentrations were gradually spiked with a lipid emulsion. Measurements were repeated and Hb-O concentrations were recorded. Spiked CBC samples were centrifuged (400 g/10 min). Plasma was carefully removed, and Hb concentration was measured. The values obtained from the lipemic samples were adjusted according to the measurements in the plasma. The removed plasma was substituted with the analyzer’s diluent, and measurements were repeated. Triglyceride concentrations were measured in lipemic plasma samples. Hb-O showed…
Genes, proteins, chemicals, diseases, species, mutations and cell lines named across the full text — each resolved to its canonical identifier and authoritative record.
Click any figure to enlarge with its caption.
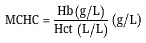 Figure 1
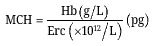 Figure 2
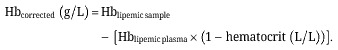 Figure 3
 Figure 4
 Figure 5
 Figure 6
 Figure 7
 Figure 8
 Figure 9
| Initial Hb concentration, g/L | Addition of lipid emulsion, µL | |||||
|---|---|---|---|---|---|---|
| 20 | 40 | 60 | 80 | 100 | 120 | |
| 50–110 | 5 | 5 | 5 | 5 | 5 | 5 |
| 110–150 | 5 | 5 | 5 | 5 | 5 | 5 |
| >150 | 5 | 5 | 5 | 5 | 5 | 5 |
| Steps | Analysis | Additional |
|---|---|---|
| CBC measurement in non-lipemic native samples | Hemoglobin, MCH and MCHC measured in the native samples will be considered as “true value”. | Print the original CBC measurement. |
| Lipid emulsion addition | Smoflipid lipid emulsion will be added to the selected samples. Starting with 20 µL and gradually increasing the volume. | The samples will be gently mixed well to evenly distribute the lipid emulsion. |
| Hb-O and MCHC-O measurement | Lipemic samples will be analyzed in the retic measurement mode. | The Hb-O and MCHC-O measurement is located in the Lab only tab. |
| Lipemic sample centrifugation | Lipemic samples will be centrifuged for 10 min at 400 | Choose CSF program on the centrifuge. |
| Lipemic plasma removal | After centrifugation, the plasma level in the CBC sample will be recorded. | The lipemic plasma will be carefully separated into a clean plastic tube using an automatic pipette. |
| Hb measurement in lipemic plasma samples | Separated lipemic plasma will be analyzed in open sampling mode on a Sysmex XN-1000 analyzer. | The result of Hb in the lipemic plasma is printed. Plasma is referred to biochemistry for triglyceride and HIL index measurement. |
| Addition of analyzer’s diluent | Analyzer diluent (Sysmex Cellpack™ DCL) will be added to the CBC sample up to the mark where the plasma has reached. | The sample will be gently mixed well to evenly distribute the diluent throughout the sample. |
| Reanalyzing the sample | The CBC samples will be reanalyzed on Sysmex XN-1000 HA. | The results are printed. |
| Results entry | All results are entered in the suitable Excel sheet. | All possible problems during the implementation of the protocol are recorded. |
| Precision, % | Patient samples | Control samples | ||||||||||||||||
|---|---|---|---|---|---|---|---|---|---|---|---|---|---|---|---|---|---|---|
| Low | Medium | High | L1 | L2 | L3 | |||||||||||||
|
| CV | BV |
| CV | BV |
| CV | BV |
| CV | BV |
| CV | BV |
| CV | BV | |
| HB-O | 101 | 1.4 | 2.0 | 119 | 1.6 | 2.0 | 141 | 1.3 | 2.0 | 56 | 1.7 | 2.0 | 104 | 0.9 | 2.0 | 132 | 1.7 | 2.0 |
|
| ||||||||||||||||||
| HB-O, measurement of optical hemoglobin on Sysmex XN-1000 hematology analyzer; CV, coefficient of variation; BV, acceptance criteria for precision derived from the EFLM biological variability database (miminum). | ||||||||||||||||||
| Within acceptance criteria | ||||||||||||||||||
| Added volume of lipid emulsion | Hb native | Hb+ lipid emulsion | Percentage change | MCHC native | MCHC+ lipid emulsion | Percentage change | TG | L index | H index | |
|---|---|---|---|---|---|---|---|---|---|---|
| 20 | Median | 113 | 117 | 3.5 | 336 | 350 | 4.1 | 8.2 | 264 | 31 |
| IQR | 97–166 | 103–170 | 2.9–5.5 | 331–341 | 339–356 | 3.0–5.8 | 7.2–9.8 | 223–387 | 11–64 | |
| 40 | Median | 115 | 124 | 7.1 | 333 | 361 | 9.1 | 14.7 | 497 | 19 |
| IQR | 97–156 | 107–162 | 4.8–9.7 | 328–339 | 352–373 | 6.8–11.7 | 12.8–18.6 | 454–622 | 5–42 | |
| 60 | Median | 138 | 148 | 10.6 | 331 | 369 | 13.1 | 21.6 | 803 | 66 |
| IQR | 90–158 | 103–173 | 7.5–14.3 | 323–340 | 362–400 | 9.5–17.8 | 16.9–30.3 | 647–1115 | 27–92 | |
| 80 | Median | 127 | 148 | 13.9 | 330 | 381 | 15.8 | 25.7 | 998 | 61 |
| IQR | 102–156 | 117–168 | 11.2–15.1 | 318–341 | 369–399 | 13.9–18.5 | 22.8–33.4 | 797–1181 | 16–91 | |
| 100 | Median | 134 | 158 | 17.9 | 332 | 404 | 21.4 | 40.5 | 1539 | 37 |
| IQR | 94–157 | 125–176 | 12.8–27.0 | 314–341 | 389–438 | 13.8–36.3 | 32.7–45.7 | 1192–1712 | 22–94 | |
|
| ||||||||||
| Reference change value (RCV) for hemoglobin=6.8 %; RCV for MCHC=3.0 %. | ||||||||||
| Within RCV | Greater than RCV | |||||||||
| Lipemia removal method | Bias % | 95 % CI | p-Value | Biological variability criteria for biasa | |||
|---|---|---|---|---|---|---|---|
| Optimal bias | Desirable bias | Minimum bias | |||||
| 1. Measurement of lipemic samples in reticulocyte measurement mode | |||||||
| Hb-O | −0.4 | −1.2 to 0.3 | 0.244 | 0.8 | 1.7 | 2.5 | |
| MCH (Hb-O/RBC) | −1.2 | / | / | 0.6 | 1.2 | 1.7 | |
| MCHC-O | 1.3 | / | / | 0.2 | 0.4 | 0.6 | |
| MCHC (Hb-O/HCT) | −0.5 | / | / | 0.2 | 0.4 | 0.6 | |
| 2. Hemoglobin concentration measurement in spun lipemic plasma samples | |||||||
| Hb corrected | −3.5 | −4.1 to (−2.9) | <0.001 | 0.8 | 1.7 | 2.5 | |
| MCH calculated | −4.4 | / | / | 0.6 | 1.2 | 1.7 | |
| MCHC calculated | −1.5 | / | / | 0.2 | 0.4 | 0.6 | |
| 3. Replacement of the removed lipemic plasma with the analyzer’s diluent | |||||||
| Hb diluent | −1.1 | −2.0 to (−0.1) | 0.025 | 0.8 | 1.7 | 2.5 | |
| MCH diluent | 2.5 | / | / | 0.6 | 1.2 | 1.7 | |
| MCHC diluent | 2.7 | / | / | 0.2 | 0.4 | 0.6 | |
| MCHC (Hb diluent/HCT) | 0.7 | / | / | 0.2 | 0.4 | 0.6 | |
|
| |||||||
| aAarsand AK, Fernandez-Calle P, Webster C, Coskun A, Gonzales-Lao E, Diaz-Garzon J, et al. The EFLM Biological Variation Database. https://biologicalvariation.eu/. Allowed bias: <0.25 × (CVI2 + CVG2)1/2 The factor 0.25 refers to desirable Analytical Performance Specification (APS). The factor for optimum and minimum performance specifications are 0.125 and 0.375, respectively. CVI, within-subject (CVI) estimate; CVG, between-subject (CVG) estimate. Available at: Aarsand AK, Fernandez-Calle P, Webster C, Coskun A, Gonzales-Lao E, Diaz-Garzon J, et al. The EFLM Biological Variation Database. https://biologicalvariation.eu/. Hb-O, measurement of optical hemoglobin on Sysmex XN-1000 hematology analyzer; MCHC-O, measurement of optical MCHC concentration on Sysmex XN-1000 hematology analyzer; RBC, red blood cell concentration; HCT, hematocrit. | |||||||
| Within acceptance criteria | Greater than acceptance criteria | ||||||
| Comparison of measurements, n=75 | 1. Native sample measurement | 2. Optical measurement | 3. Spun lipemic plasma samples correction | 4. Replacement of the removed lipemic plasma with the analyzer’s diluent | p-Value |
|---|---|---|---|---|---|
| Median (IQR) | Median (IQR) | Median (IQR) | median (IQR) | ||
| Hemoglobin (all samples) | 132 (101–158) | 129 (102–158) | 124a (97–151) | 126a (98–155) | <0.00001 |
| <110 g/L | 92 (83–98) | 91 (83–96) | 89a (83–96) | 92 (86–98) | 0.00484 |
| 110–150 g/L | 128 (119–137) | 127 (121–137) | 122a (116–131) | 125a (119–133) | 0.00001 |
| >150 g/L | 162 (158–167) | 163 (158–170) | 158a (155–167) | 155a (151–164) | <0.00001 |
| MCH | 30.2 (28.4–31.2) | 30.2 (28.3–31.2) | 29.2a (27.5–30.1) | 30.9a (29.3–32.6) | <0.00001 |
| MCHC | 334 (323–340) | 340a (324–353) | 331a (319–337) | 341a (331–348) | <0.00001 |
|
Calculated bias |
Triglycerides (mmol/L) |
Lipemia degree (L index) |
Hemolysis (H index) | |||
|---|---|---|---|---|---|---|
|
Rho (95% CI) |
p-Value |
Rho (95% CI) |
p-Value |
Rho (95% CI) |
p-Value | |
|
Hb-O |
−0.072 (−0.295 to 0.157) |
0.537 |
−0.041 (−0.266 to 0.187) |
0.725 |
0.068 (−0.161 to 0.291) |
0.559 |
|
Hb-corrected |
−0.915 (−0.946 to (−0.868)) |
<0.001 |
−0.918 (−0.947 to (−0.873)) |
<0.001 |
−0.390 (−0.566 to (−0.178)) |
0.001 |
|
Hb-diluent |
−0.369 (−0.550 to (−0.155)) |
0.001 |
−0.412 (−0.590 to (−0.196)) |
0.001 |
−0.406 (−0.585 to (−0.190)) |
0.001 |
|
| ||||||
|
Statistically significant correlation. | ||||||
Peer Reviews
No public reviews on file for this paper yet. If you reviewed it on a platform where reviews are public (OpenReview, ICLR, NeurIPS, ICML), you can paste yours below so the community can read it here.
Videos
No videos yet. Explain this paper in a talk, walkthrough, or lecture? Add one.
Taxonomy
TopicsClinical Laboratory Practices and Quality Control · Blood groups and transfusion · Blood properties and coagulation
Introduction
Lipemia, defined as sample turbidity due to the accumulation of lipoprotein particles, causes a significant problem in the clinical laboratory setting [1]. Although relatively uncommon, it poses a significant preanalytical problem for complete blood count (CBC) measurement in lipemic whole blood samples for various reasons. As most hematology analyzers (HA) measure hemoglobin spectrophotometrically on 530 nm, lipemia interferes with hemoglobin measurement, causing falsely high concentrations of hemoglobin and, consequently, mean corpuscular hemoglobin (MCH) and mean corpuscular hemoglobin concentration (MCHC) [2]. In biochemistry and endocrinology measurements hemolysis, icteria and lipemia interference is mostly identified visual inspection, by (semi)quantitative HIL measurements, or some combination of both [3]. Contrary, the most common alert that could indicate a lipemic CBC sample is the increase of MCHC above a certain threshold. Although some authors propose MCHC of 360 g/L as a lipemia threshold [4], every laboratory should have an established cut-off level of lipemia above which results should not be reported [5]. Several possible solutions to eliminate lipemia interference in CBC measurement are present in routine hematology laboratories worldwide [6]. One includes hemoglobin concentration measurement in spun lipemic plasma samples. The obtained hemoglobin value measured in lipemic plasma samples allows further whole blood hemoglobin concentration correction. The measured hemoglobin concentration from the lipemic plasma sample is subtracted from the hemoglobin concentration in the whole blood sample. After correction, MCH and MCHC values are recalculated. Another widespread lipemia removal procedure is the plasma replacement procedure. This procedure involves removing the lipemic plasma and replacing it with an appropriate volume of the analyzer’s diluent, followed by a sample re-analysis. The most practical solution for obtaining reliable CBC results from lipemic whole blood samples is employing hematology analyzers insensitive to lipemia interference. Siemens Advia 2120i HA measures cellular hemoglobin concentration mean (CHCM) – hemoglobin is measured directly in the intact erythrocytes. This approach allows for accurate hemoglobin measurement without interference from lipemia [7], [8], [9].
In 2019 The Croatian Working Group for Laboratory Hematology, on behalf of the Croatian Society of Medical Biochemistry and Laboratory Medicine, wanted to explore the background in field of laboratory hematology routine practice among Croatian laboratories in order to develop future strategies for producing national recommendations in order to promote harmonization in the field [5]. The survey showed various strategies for resolving lipemia-related issues in CBC measurements [5]. The most common strategy was the first procedure in which hemoglobin concentration was measured in spun lipemic plasma samples, which accounted for 40 % of cases [5]. However, this method requires considerable sample manipulation and necessitates recalculating results to ensure reliable hemoglobin values.
Until recently, our laboratory utilized Siemens Advia 2120i hematology analyzers. Thus, lipemia certainly was not an issue for CBC measurements. However, Advia has been replaced with Sysmex XN-1000. Therefore, in order to optimize and standardize our practice, as well as to ensure patient safety, we aimed to establish our lipemia interference protocol for reliable hemoglobin measurement. Although Sysmex recognizes this possible sample interference, the company does not provide any practical solution for lipemia removal under the System limitations subheading in the Automated Hematology Analyzer XN series (XN-1000) Instructions for Use user manual. However, based on the recent Berda-Haddad et al. study results [10], Sysmex Corporation proposes an algorithm for resolving increased MCHC measurements. This algorithm can be integrated into laboratory-extended IPU (EPU) if available. As increased sample turbidity is one of the possible causes of increased MCHC measurements, based on the proposed Sysmex algorithm, a reliable method for eliminating lipemia interference in lipemic CBC samples is the measurement of optical hemoglobin in the reticulocyte measurement mode (Hb-O) [11]. However, Hb-O is currently a research-only parameter and is not included in the quality control (QC) menu. Therefore, we wanted to explore the analytical characteristics of the new optical hemoglobin measurement and compare it with the most commonly used lipemia-eliminating protocols.
Materials and methods
The experimental study was performed in the Department of Medical Laboratory Diagnostics, University Hospital “Sveti Duh”, Zagreb, Croatia, during October and November 2024.
Precision
Before the lipemia assessment, a short precision study was performed regarding Hb-O measurements on the Sysmex XN-1000 hematology analyzer (HA) (Sysmex, Kobe, Japan). Within-day precision was explored by using patient samples in three different concentration ranges, and commercial control samples (Sysmex XN Check, lot: Level 1 42461101, Level 2 42461102, Level 3 42461103, exp: 24.11.2024.) by 20 consecutive analyses. Between-day precision was established by using commercial control samples, daily for 30 days. The coefficient of variation was calculated for within- and between-day precision study.
Accuracy
Ninety whole blood K_2_EDTA patient samples with varying Hb concentrations and a clinician request for CBC were analyzed on Sysmex XN-1000 HA. The initial CBC measurement was considered the true value. To ensure various Hb concentrations, samples were selected according to the distribution presented in Table 1.
To simulate lipemia interference the samples were gradually spiked with a SMOFlipid 200 mg/mL Emulsion zur Infusion lipid emulsion (Fresenius Kabi, Graz, Austria, exp. 03/2025), by following the predetermined emulsion volumes (Table 1).
After the addition of lipemic emulsion CBC measurements were repeated, and standard Hb concentrations measured by spectrophotometrical method were recorded.
Verification protocol for reliable measurement of CBC parameters in lipemic whole blood samples on the Sysmex XN-1000 hematology analyzer included three different methods:
- Measurement of lipemic samples in reticulocyte measurement mode to obtain Hb-O and MCHC-O measurements.
- Hemoglobin concentration measurement in spun lipemic plasma samples.Spiked lipemic samples were centrifuged on 400 g for 10 min. Lipemic plasma was carefully removed in order not to disturb the cells, and standard Hb concentrations were measured in lipemic plasma samples. Consenquently, the values obtained from the lipemic samples were adjusted according to the measurements in the plasma by following the simple equation:
MCH and MCHC were calculated as instructed:
- Replacement of the removed lipemic plasma with an adequate volume of the analyzer’s diluent.The removed plasma was substituted with the analyzer’s diluent (Sysmex Cellpack™ DCL). After thorough mixing, measurements were repeated and standard Hb concentrations were recorded.
To assess the degree of simulated lipemia, triglyceride concentrations, as well as HIL index, were measured in lipemic plasma samples on Abbott Alinity c analyzer (Abbott, Abbott Park, IL, USA). Tryglicerides were measured utilizing the glycerol phosphate oxidase method that produces a quinoneimine dye, where the absorbance of the dye, measured at 604 nm is proportional to the concentration of triglyceride present in the sample. HIL indices were measured spectrophotometrically using different wavelength pairs and a specific algorithm to obtain HIL index values that approximately correspond to free hemoglobin, bilirubin and triglycerides concentrations.
The whole protocol is presented in Table 2.
No patient information was collected in this study as the interference study included the remnant plasma samples with CBC orders. The ethics committee ot University Hospital “Sveti Duh”, Zagreb, Croatia granted an universal approval for verification studies on remnant samples. They confirmed that patient consent in such studies were not needed.
Statistical analysis
An average bias between the measurements obtained from different lipemia removing methods, compared to the initial measurements, was calculated by employing the Bland-Altman plot. Average bias was expressed as percentage and compared to biological variability criteria for bias according to the European Federation of Clinical Chemistry and Laboratory Medicine (EFLM) Biological Variation Database [12]. To assess the possible correlation of the calculated biases and the degree of lipemia, as well as hemoglobin concentration, rank correlation was performed [13]. Differences between three lipemia removing methods were tested by the Friedman test, as variables were not normally distributed. p values<0.05 were considered statistically significant. Statistical analysis was performed in MedCalc^®^ Statistical Software version 23.0.2 (MedCalc Software Ltd, Ostend, Belgium).
Results
Precision
The precision study results were within the acceptance criteria and are presented in Table 3. The Hb-O measurement on Sysmex XN-1000 HA is currently a research-only parameter, and there are no manufacturer-defined acceptability criteria for precision. Therefore, we have used the biological variability criteria for precision.
Accuracy
Fifteen samples with the highest degree of simulated lipemia (addition of 120 μL of lipid emulsion) were grossly hemolyzed and were excluded from further statistical analysis. The gradual increase in hemoglobin concentration, MCHC measurement and triglyceride concentration is presented in Table 4.
The results of the accuracy study are presented in Table 5. Hb-O showed statistically insignificant and acceptable bias compared to the initial Hb measurement according to the strictest acceptability criteria (−0.4 %, 95 % CI: −1.2–0.3, p=0.2447). Hemoglobin measured in samples with lipemic plasma replaced by analyzer diluent exhibited minimal, albeit statistically significant, bias (−1.1 %, 95 % CI: −2.0 – (−0.1), p=0.025). The highest unacceptable bias was found in the recalculated hemoglobin values based on the measured plasma hemoglobin (−3.5 %, 95 % CI: −4.1 – (−2.9), p<0.0001).
MCHC measured with all three lipemia removal protocols showed unacceptable results according to the acceptability criteria for accuracy. However, if a mathematical correction is applied to the calculation of MCHC by using the Hb-O measurement, we obtained an acceptable bias according to the criteria of minimally acceptable accuracy compared to native MCHC.
Friedman’s test showed a statistically significant difference between the observed hemoglobin measurements (p<0.00001). Post hoc testing showed a statistically significant difference between hemoglobin measured in the native sample and hemoglobin obtained by correction for plasma hemoglobin and hemoglobin measured in samples where plasma was replaced by the analyzer’s diluent (p<0.05). No statistically significant difference was observed between initial hemoglobin measurement and Hb-O (Table 6). The same results were obtained when all included hemoglobin measurements were divided into categories: <110 g/L, 110–150 g/L, and >150 g/L, thus reflecting low, normal, and high hemoglobin concentrations. Hb-O measurements were equally reliable independently of concentration spans (Table 6).
The rank correlation statistical analysis explored the possible correlations between the observed biases in Hb measurement in all three lipemia removal methods and the degree of lipemia/hemolysis (measured by triglyceride concentration and HIL indexes). The results are presented in Table 7.
Discussion
The Sysmex XN-1000 Hb-O measurement has effectively addressed interference caused by lipemia in lipemic whole blood EDTA samples. By re-analyzing samples in the reticulocyte measurement mode, we eliminated the need for the manual procedures traditionally used in medical-biochemistry laboratories to remove lipemia interference.
While we observed a significant increase in hemoglobin (Hb) concentrations, even with the smallest addition of lipids (20 µL), this increase was not clinically significant when compared to reference change values (RCV) obtained from the EFLM database. The concentration of triglycerides in such samples could reach up to 10 mmol/L. However, further addition of lipid emulsion did result in Hb concentrations exceeding the clinically significant RCV, prompting us to reevaluate the proposed Sysmex MCHC cut-off of 365 g/L as an indicator of lipemic CBCs. To minimize unnecessary testing and, at the same time effectively identify lipemia interference, we suggest a lower MCHC threshold of 360 g/L that could enhance the management of analytical interferences, similar to recommendations made by Henry et al. [14].
Another advantage of Hb-O measurement, in contrast to the existing protocols for lipemia removal, is its independence from the levels of both lipemia and hemolysis. It is well-known that increased lipid concentration is associated with heightened hemolysis, as demonstrated in our study [15]. The typical approach for addressing lipemia-related issues in CBC measurements in Croatia – measuring hemoglobin concentration in spun lipemic plasma samples – is significantly affected by both the degree of lipemia and hemolysis, leading to unreliable results in samples with high levels of lipemia. Similar findings were reported in a study by Aruga et al., which highlighted the effectiveness of the optical method for measuring hemoglobin in chylous samples [16]; however, their research did not include a comparison with the commonly used lipemia-removal methods.
Our study does have some limitations. The results might vary with different lipid emulsions used for simulating lipemia interference. However, simulating lipemia this way is the best we can achieve in laboratories. The absence of internal quality control or Hb-O measurement presents a potential concern regarding using this research-only parameter in routine clinical assessments. Although Hb-O showed higher total imprecision compared to the spectrophotometrically measured Hb concentrations, the observed imprecision was well within the Sysmex acceptance criteria. Sysmex internal QC samples can further be validated for Hb-O measurement in various QC lots.
Despite some shortcomings, we have successfully demonstrated that Hb-O measurement using the Sysmex HA is superior in eliminating lipemia interference compared to existing lipemia removal methods used worldwide, including in Croatia. This method offers a straightforward approach to standardizing the lipemia elimination protocol for complete blood count (CBC) measurements, without necessitating any manipulation of the samples. Traditional lipemia removal techniques often involve sample manipulation, which can introduce significant bias, potentially leading to erroneous results and compromising patient safety [17], 18]. Ultimately, adopting a simple and safe procedure for lipemia removal through direct Hb-O measurement could reduce the overall workload in light of the globally recognized shortage of laboratory personnel [19].
The reference list from the paper itself. Each links out to its DOI / PubMed record.
- 1Nikolac N Lipemia: causes, interference mechanisms, detection and management Biochem Med 201424576710.11613/bm.2014.008PMC 393697424627715 · doi ↗ · pubmed ↗
- 2Gulati G Uppal G Gong J Unreliable automated complete blood count results: causes, recognition, and resolution Ann Lab Med 2022425153010.3343/alm.2022.42.5.51535470271 PMC 9057813 · doi ↗ · pubmed ↗
- 3Cadamuro J Lippi G von Meyer A Ibarz M van Dongen-Lases E Cornes M European survey on preanalytical sample handling – Part 2: Practices of European laboratories on monitoring and processing haemolytic, icteric and lipemic samples. On behalf of the European Federation of Clinical Chemistry and Laboratory Medicine (EFLM) Working Group for the Preanalytical Phase (WG-PRE)Biochem Med 20192902070510.11613/BM.2019.020705 PMC 655962331223259 · doi ↗ · pubmed ↗
- 4Fernández Prendes C Castro Castro MJ Sánchez Navarro L Rapún Mas L Morales Indiano C Arrobas Velilla T Handling of lipemic samples in the clinical laboratory Adv Lab Med 2023451510.1515/almed-2023-000337359904 PMC 10197190 · doi ↗ · pubmed ↗
- 5Radišić Biljak V LapićI Vidranski V Herceg I TomićF Šimac B Policies and practices in the field of laboratory hematology in Croatia – a current overview and a call for improvement Clin Chem Lab Med 202160271823484588310.1515/cclm-2021-1027 · doi ↗ · pubmed ↗
- 6Zandecki M Genevieve F Gerard J Godon A Spurious counts and spurious results on haematology analysers: a review. Part II: White blood cells, red blood cells, haemoglobin, red cell indices and reticulocytes Int J Lab Hem 200729214110.1111/j.1365-2257.2006.00871.x 17224005 · doi ↗ · pubmed ↗
- 7Zeng S-G Zeng T-T Jiang H Wang L-L Tang S-Q Sun Y-M A simple, fast correction method of triglyceride interference in blood hemoglobin automated measurement J Clin Lab Anal 201327341510.1002/jcla.2156824038218 PMC 6807499 · doi ↗ · pubmed ↗
- 8Harris N Kunicka J Kratz A The ADVIA 2120 hematology system: flow cytometry-based analysis of blood and body fluid sin the routine hematology laboratory Lab Hematol 200511476110.1532/lh 96.0407515790553 · doi ↗ · pubmed ↗