Cell-integrated serum-induced signalling patterns can differentiate between hand and knee osteoarthritis patients
Margot Neefjes, Bas A C Housmans, Charlotte Kaffa, Nathalie G M Thielen, Leo A B Joosten, Cornelia H M van den Ende, Elly L Vitters, Guus G H van den Akker, Tim J M Welting, Arjan P M van Caam, Peter M van der Kraan

TL;DR
This study shows that serum from hand and knee osteoarthritis patients causes different cell signaling patterns, suggesting distinct biological mechanisms for each type of OA.
Contribution
The study introduces a method to differentiate hand and knee osteoarthritis based on serum-induced cell signaling patterns.
Findings
Hand OA serum induces high MAPK-related AP1 activity, while knee OA serum induces SRE, ISRE, and SOX9 activity.
Principal component analysis clearly separates hand OA and knee OA into distinct clusters.
No distinct subtypes were identified within either hand or knee OA groups.
Abstract
OA is a very heterogeneous disease. Here, we aimed to differentiate OA patients based on their serum-induced cell-integrated signalling patterns. In order to monitor the activity of different cellular homeostasis-regulating pathways in response to patient serum, we analysed the response of human OA serum samples to 16 cell-based transcription factor luciferase reporter assays. In this study we compared serum samples from 55 patients with knee OA, 56 patients with hand OA and 42 healthy controls. Differential serum-induced pathway activity was observed between samples from healthy controls, knee OA and hand OA patients: serum of hand OA patients induced high MAPK-related AP1 activity whereas serum of knee OA patients induced more SRE, ISRE and SOX9 activity, which is related to ELK1-SRF, STAT1-STAT2 and SOX9 activity, respectively. Principal component analysis revealed that these…
Genes, proteins, chemicals, diseases, species, mutations and cell lines named across the full text — each resolved to its canonical identifier and authoritative record.
Click any figure to enlarge with its caption.
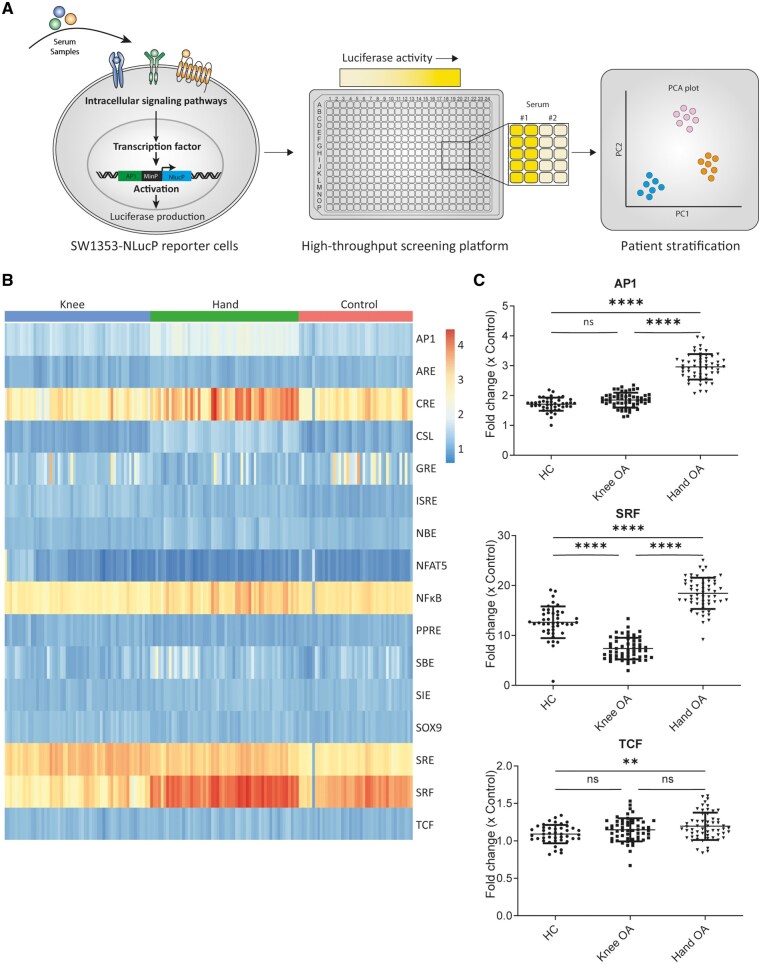 Figure 1
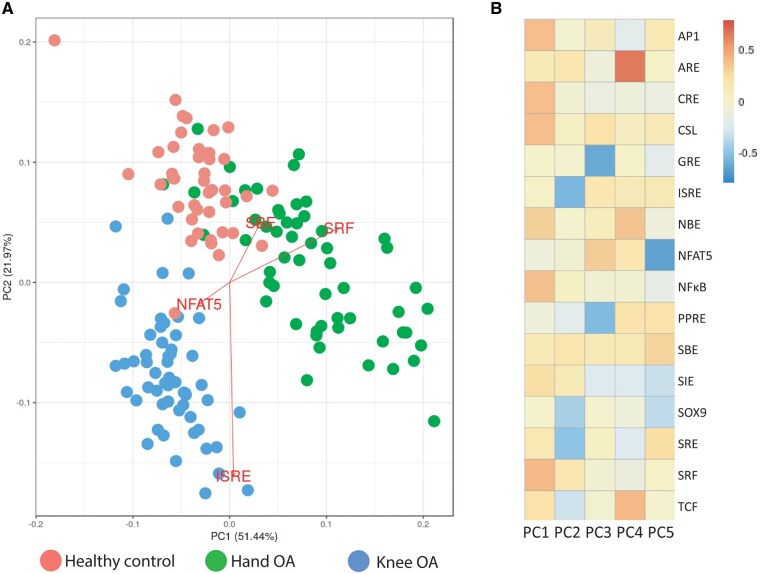 Figure 2
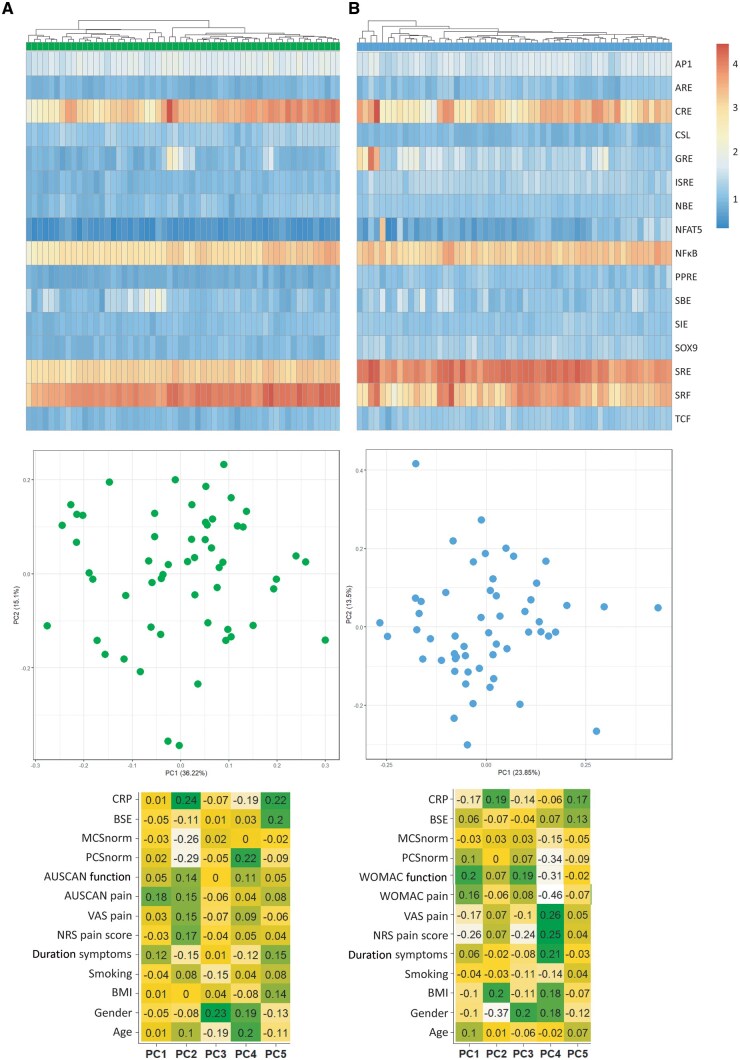 Figure 3
| Clinical parameters | Hand OA | Knee OA | HC I |
|---|---|---|---|
|
| 56 | 55 | 42 |
| Age (years), mean ( | 65 (6.6) | 65 (9) | 61 (7) |
| Women, | 44 (79) | 28 (51) | 15 (36) |
| BMI (kg/m2), mean ( | 28 (4.6) | 28 (5) | |
| Kellgren and Lawrence ≥2, | 27 (48) | 32 (58) | |
| Duration of symptoms, | |||
| 1–3 years | 10 | 17 | |
| 3–5 years | 12 | 13 | |
| 5–10 years | 13 | 11 | |
| 10–15 years | 8 | 6 | |
| >15 years | 13 | 8 | |
| NRS pain score (0–10), mean ( | 6 (1.7) | 6 (2) | |
| VAS pain | 6 (2) | 6 (2) | |
| AUSCAN pain (0–100) | 55 (16.9) | ||
| WOMAC pain (0–100) | 60 (15) | ||
| AUSCAN function (0–100) | 57 (21) | ||
| WOMAC function (0–100) | 61 (18) | ||
| ESR (mm/h) | 14 (9.5) | 13 (8) | |
| CRP (mg/l) | 4 (9.4) | 3 (6) | |
| Smoking, | |||
| Yes | 7 | 3 | |
| No | 49 | 52 |
| Transcription factor element | Sequence |
|---|---|
| AP1, Activator protein 1 response element | TGAGTCAGTGACTCAGTGAGTCAGTGACTCAGTGAGTCAGTGACTCAGCTCGAGGATATCAAGATCTGGCCTCGGCGGCCAAGCTTAGACACTAGAGGGTATATAATGGAAGCTCGACTTCCAG |
| ARE, Antioxidant response element | TAGCTTGGAAATGACATTGCTAATGGTGACAAAGCAACTTTTAGCTTGGAAATGACATTGCTAATGGTGACAAAGCAACTTTCTCGAGGATATCAAGATCTGGCCTCGGCGGCCAAGCTTAGACACTAGAGGGTATATAATGGAAGCTCGACTTCCAG |
| CRE, Cyclic AMP response element | TGACGTCAGCTGCCAGATCCCATGGCCGTCATACTGTGACGTCTTTCAGACACCCCATTGACGTCAATGGGAGAACAGATCTGGCCTCGGCGGCCAAGCTTAGACACTAGAGGGTATATAATGGAAGCTCGACTTCCAG |
| GRE, Glucocorticoid receptor element | AGAACATTTTGTCCGAGAACATTTTGTCCGAGAACATTTTGTCCGAGAACATTTTGTCCGAGAACATTTTGTCCGAGAACATTTTGTCCGCTCGAGGATATCAAGATCTGGCCTCGGCGGCCAAGCTTAGACACTAGAGGGTATATAATGGAAGCTCGACTTCCAG |
| ISRE, Interferon-stimulated response element | TAGTTTCACTTTCCCTAGTTTCACTTTCCCTAGTTTCACTTTCCCTAGTTTCACTTTCCCTATTTCACTTTCCCCTCGAGGATATCAAGATCTGGCCTCGGCGGCCAAGCTTAGACACTAGAGGGTATATAATGGAAGCTCGACTTCCAG |
| NFAT5, Nuclear factor of activated T cells 5 response element | TGGAAAAGTCCATGGAAAAGTCCATGGAAAAGTCCATGGAAAAGTCCATGGAAAAGTCCATGGAAAAGTCCATGGAAAAGTCCATGGAAAAGTCCACTCGAGGATATCAAGATCTGGCCTCGGCGGCCAAGCTTAGACACTAGAGGGTATATAATGGAAGCTCGACTTCCAG |
| NFκB, Nuclear factor k B response element | GGGAATTTCCGGGGACTTTCCGGGAATTTCCGGGGACTTTCCGGGAATTTCCAGATCTGGCCTCGGCGGCCTAGATGAGACACTAGAGGGTATATAATGGAAGCTCGACTTCCAG |
| PPRE, Peroxisome proliferator activated receptor-y response element | GTCGACAGGGGACCAGGACAAAGGTCACGTTCGGGAGTCGACAGGGGACCAGGACAAAGGTCACGTTCGGGAGTCGACAGGGGACCAGGACAAAGGTCACGTTCGGGAGTCGACCTCGAGGATATCAAGATCTGGCCTCGGCGGCCAAGCTTAGACACTAGAGGGTATATAATGGAAGCTCGACTTCCAG |
| SBE, SMAD binding element | AGTATGTCTAGACTGAAGTATGTCTAGACTGAAGTATGTCTAGACTGACTCGAGGATATCAAGATCTGGCCTCGGCGGCCTAGATGAGACACTAGAGGGTATATAATGGAAGCTCGACTTCCAG |
| SIE, Sis inducible element | AGCTTCATTTCCCGTAAATCGTCGAAGCTTCATTTCCCGTAAATCGTCGAAGCTTCATTTCCCGTAAATCGTCGAAGCTTCATTTCCCGTAAATCGTCGAAGCTTCATTTCCCGTAAATCGTCGACTCGAGGATATCAAGATCTGGCCTCGGCGGCCAAGCTTAGACACTAGAGGGTATATAATGGAAGCTCGACTTCCAG |
| SOX9, SRY-box transcription factor 9 response element | AGAACAATGGAGAACAATGGAGAACAATGGAGAACAATGGAGAACAATGGAGAACAATGGAGAACAATGGCTCGAGGATATCAAGATCTGGCCTCGGCGGCCAAGCTTAGACACTAGAGGGTATATAATGGAAGCTCGACTTCCAG |
| SRE, Serum response element | AGGATGTCCATATTAGGACATCTAGGATGTCCATATTAGGACATCTAGGATGTCCATATTAGGACATCTAGGATGTCCATATTAGGACATCTAGGATGTCCATATTAGGACATCTAGATCTGGCCTCGGCGGCCAAGCTTAGACACTAGAGGGTATATAATGGAAGCTCGACTTCCAG |
| SRF, Serum response factor | AGTATGTCCATATTAGGACATCTACCATGTCCATATTAGGACATCTACTATGTCCATATTAGGACATCTTGTATGTCCATATTAGGACATCTAAAATGTCCATATTAGGACATCTAGATCTGGCCTCGGCGGCCAAGCTTAGACACTAGAGGGTATATAATGGAAGCTCGACTTCCAG |
| TCF/LEF, T cell factor/lymphoid enhancer factor family response element | AGATCAAAGGGTTTAAGATCAAAGGGCTTAAGATCAAAGGGTATAAGATCAAAGGGCCTAAGATCAAAGGGACTAAGATCAAAGGGTTTAAGATCAAAGGGCTTAAGATCAAAGGGCCTACTCGAGGATATCAAGATCTGGCCTCGGCGGCCAAGCTTAGACACTAGAGGGTATATAATGGAAGCTCGACTTCCAG |
- —TTW Perspectief
- —William Hunter Revisited
- —NWO10.13039/501100003246
Peer Reviews
No public reviews on file for this paper yet. If you reviewed it on a platform where reviews are public (OpenReview, ICLR, NeurIPS, ICML), you can paste yours below so the community can read it here.
Videos
No videos yet. Explain this paper in a talk, walkthrough, or lecture? Add one.
Taxonomy
TopicsOsteoarthritis Treatment and Mechanisms · Asthma and respiratory diseases · Rheumatoid Arthritis Research and Therapies
Introduction
OA is the most common joint disease, affecting up to 7% of the global population [1]. Clinically, OA is characterized by pain and loss of joint function, leading to disability. Despite decades of research, there are still no disease-modifying drugs for OA [2]. Besides the problem of our limited knowledge of the regulatory mechanisms of OA development and progression, it has been suggested that the origin of the lack of treatments can be attributed to OA heterogeneity [3, 4]. OA has a multifactorial nature, with risk factors including age, sex, previous joint injury and obesity [5]. Besides this, OA can also affect different anatomical joints. Therefore, there is a high clinical need for effective methods that can stratify OA in different subtypes and identify underlying pathological processes. Identification and characterization of these OA subtypes is essential for the development of personalized treatment strategies.
In recent years, studies have attempted to stratify OA patients based on clinical phenotypes, such as inflammatory, metabolic and mechanical OA [6, 7]. However, these subgroupings have not yet led to breakthroughs in treatment. A possibly more promising way to stratify OA is by the use of endotypes. An endotype is defined as a subtype of disease where the pathophysiology can be explained by the involvement of certain (distinct) molecular pathways [4]. Several studies have stratified OA in a number of endotypes, based on the transcriptomic profiles of different joint tissue biopsies (e.g. cartilage, synovium and bone) [8–10]. This stratification is very valuable as it offers insight into to underlying disease mechanisms and can provide clues for therapeutic targets in a specific patient population. However, clinical implementation of such an endotyping approach is challenging due to the invasiveness of a biopsy and the extra damage it can cause. Therefore, a less invasive method would be preferred, ideally a blood-based assay, e.g. using serum. Serum is a blood component, which can be easily collected and therefore is an ideal candidate for the use in diagnostic purposes.
To tackle the heterogeneous aspect of OA, we questioned whether serum from hand OA, knee OA or healthy controls (HCs) induced distinct cell-integrated signalling patterns indicative of endotypes. For this purpose, we generated a screening platform consisting of 16 cell-based transcription factor luciferase reporter assays, which allowed us to monitor various cellular homeostasis-regulating pathways in response to patient serum.
Methods
Human serum collection
Serum was collected from 55 knee OA patients and 56 hand OA patients as part of randomized, double-blinded, sham-controlled superiority trial to study the effects of low-dose radiation therapy [11, 12]. We analysed serum that was collected at baseline (T0, before start intervention). Baseline characteristics of OA patients were similar between the two groups (Table 1). The local Medical Ethics committee approved the study (2014–275). All patients gave written informed consent. Serum from 42 healthy subjects of the 200 FG cohort (www.humanfuntionalgenomics.org) was used in this study [13]. The ethnicity distribution of both OA cohorts and the healthy subjects was all white.
Construction reporter plasmids and virus production
Binding sequences (Table 2) specific for 14 transcription factors were extended with a minimal promoter and were synthesized by Genecust (Boynes, France). Binding sequences were directionally cloned into the pNL1.2 vector (Promega, Madison, WI, USA). Subsequently, lentiviral constructs were generated by re-cloning pNL1.2 reporters with the In-Fusing Cloning method (TakaraBio, Kusatsu, Shiga, Japan) into the ClaI site of the pLVX-EF1α-IRES-Puro producer vector (TakaraBio). The 4th generation lentiviral production system (TakaraBio) was used to generate viral supernatants in Lenti-X HEK 293 T cells (TakaraBio). Polyethylenimine (PEI; Polysciences, Warrington, USA) 1 mg/ml was used to transfect viral constructs into Lenti-X 293 T cells. Viral supernatant collected after 48 and 72 h post-transfection were concentrated using ultracentrifugation (2 h, 25 000 × g, 4°C). Lentiviral titre was determined by p24 ELISA (Fujirebio, Gent, Belgium).
SW1353 cell culture and stable cell-line generation
SW1353 cells (ATCC, HTB-94) were cultured in growth medium consisting of Dulbecco’s Modified Eagle Medium/Nutrient Mixture F-12 (DMEM/F12; ThermoFisher, Carlsbad, CA, USA) supplemented with 10% fetal calf serum (FCS; Sigma, St Louis, Missouri, USA) and 1% penicillin-streptomycin-glutamine (Gibco, Carlsbad, CA) in a humidified atmosphere containing 5% CO_2_ at 37°C. SW1353 reporter cell lines were generated using lentiviral transduction (250 ng virus particles/62 500 cells) with 8 µg/ml hexadimethrine bromide (Sigma) for 8 h. Two days post-transduction, cells were selected using 1 µg/ml puromycin (Sigma) and expanded for three passages before cryopreservation and stored in liquid nitrogen until further use. All 14 reporter cell lines were functionally validated with known positive stimuli (Supplementary Fig. S1, available at Rheumatology online).
Stimulation and transcription factor luciferase reporter assay
SW1353 reporter cell lines were defrosted and expanded for another two passages before the start of the experiment. Cells were trypsinized and re-seeded (95 250 cells/cm^2^) into white polystyrene 384-well plates (Greiner Bio-One, Alpen aan den Rijn, The Netherlands) and serum-starved overnight in 0% FCS supplemented DMEM/F12. Serum-starved cells were stimulated with 10% OA serum (n = 111 donors) or HC serum (n = 42 donors) for 6 h. After stimulation cells were lysed using 15 µl ultrapure H_2_O. Nano-Glo (Promega) was added at 1:1 ratio to the cell lysate to measure luminescence. All luminescent measurements were performed with the CLARIOstar (BMG Labtech) at room temperature.
Data analysis
Luciferase reporter measurement were investigated in quadruple. Fold-change (FC) data from reporter measurements were calculated by consecutively subtracting the background signal and normalizing to the mean of the unstimulated negative control conditions. To test whether luciferase FC was different between groups, a (grouped) mixed effect model was used and to control the false-discovery rate we used the two-stage linear step-up method of Benjamini, Krieger and Yekutieli with a Q of 0.05 (GraphPad Prism 9.3.1). The generated p and q values are listed in Supplementary Table S1, available at Rheumatology online. Data were considered statistically significant when P ≤ 0.05. Each dot represents mean of quadruple measurement.
Heatmaps and principal component analysis (PCA) plots were created using R (v. 4.1.2), using packages readxl (v. 1.3.1), pheatmap (v. 1.0.12), ggfortify (v. 0.4.14) and PCAtools (v. 2.6.0). The reporter FCs were read into R with the read_xlsx function. In figures where data were transformed a log2 transformation was applied.
Results
Serum-induced pathway activity is different between samples from healthy, knee OA and hand OA donors
To investigate the heterogeneous aspect of OA, we investigated whether serum from knee OA, hand OA or HCs induced distinct cell-integrated signalling patterns. Sixteen SW1353 reporter cell lines were validated with known positive stimuli (Supplementary Fig. S1, available at Rheumatology online). Fourteen transcription factor reporters were significantly upregulated by known positive stimuli, while two reporters (CSL and NBE) were not. To identify potential serum-induced differences between hand OA, knee OA and HCs, we performed functional pathway analysis of 153 serum samples (hand n = 55, knee n = 56, HC n = 42) using our transcription factor response element reporter screening platform (Fig. 1A).
*Serum-induced pathway activity different between samples from healthy controls, knee OA and hand OA donors. (A) Schematic depiction of experimental design. (B) Log-transformed clustered heatmap of response of all 153 serum samples (n = 55 knee OA patients, n = 56 hand OA patients, n = 42 healthy control donors) on transcription factor response element reporters. (C) Comparison of AP1, SRF and TCF reporter response between healthy control, knee OA and hand OA samples. Fold-change data from reporter measurements were calculated by consecutively subtracting the background signal and normalizing to the mean of the unstimulated negative control conditions. To test whether luciferase fold change was different between groups, one-way analysis of variance was used with Tukey’s multiple comparison test. Each dot represents mean of quadruple measurement. ns: not significant; *P-value ≤0.01; *P-value ≤0.0001
A clustered heatmap of log-transformed luciferase reporter data revealed differences in specific reporter outcome between hand OA, knee OA and HC (Fig. 1B). Overall CRE, NFκB, SRE and SRF reporters demonstrated the highest inducibility by all different groups, while ARE, CSL, NBE, NFAT5, PPRE, SIE, SOX9 and TCF displayed only minor FCs by any of the groups (FC ≤2.0). However, for all reporters, significant differences were found between at least two of the groups (Fig. 1C; Supplementary Fig. S2, available at Rheumatology online). For example, the hand OA serum-induced response of the AP1 reporter (FC 3.0 ± SD 0.4) was significantly higher than the induced response by HC serum (FC 1.7 ± SD 0.2) and knee OA. However, knee OA–induced response of the AP1 reporter (FC 1.8 ± SD 0.2) did not significantly differ from HC serum. For the SRF reporter, knee OA serum induced a significantly lower response (FC 7.2 ± 2.2) compared with HC serum (FC 12.6 ± 3.2) and hand OA serum (FC 18.4 ± 3.1). Lastly, for the TCF reporter, only serum from hand OA (FC 1.2 ± 0.2) induced a significantly higher response than HC serum (FC 1.1 ± 0.1), but no difference was observed between knee OA serum and HC and knee OA serum and hand OA serum. Furthermore, magnitude of induced serum responses differed greatly between transcription factor response element reporters (Fig. 1C; Supplementary Fig. S2, available at Rheumatology online). For example, AP1 showed an average inducibility (highest FC 4.0), while SRF reporter showed the highest inducibility (highest FC 25.1) and TCF showed a very weak inducibility (highest FC 1.6). In total, 14 out of 16 reporters (TCF and GRE not) revealed a significant difference between stimulation with hand OA and knee OA serum, indicating that serum is indeed different between OA patients.
Serum-induced signalling patterns can stratify hand OA, knee OA and HCs
To investigate if these observed differences between serum-induced signalling patterns could be used to differentiate phenotypes, we performed a PCA. The first two components of PCA (which explained 73.4% of total variance) clearly separated two cohorts (Fig. 2A). Knee OA clustered separately from HCs and hand OA, primarily by ISRE and NFAT reporter activity. In addition, hand OA patients and HCs showed a small overlap in the PCA plot due to large variability in the hand OA group. Still, individual clouds could be determined and these were mainly separated by SRF and SRE. Next, we investigated whether the variance explained by a principal component (PC) is the result of one or more reporters (Fig. 2B). PC1, explaining 51.4% of the variance, is mainly determined by six different reporters (AP1, CRE, CSL, NBE, NFκB and SRF). PC2, explaining 21.9% of the variance, is predominantly determined by four reporters (ISRE, SOX9, SRE and TCF).
Serum-induced signalling patterns can stratify hand OA, knee OA and healthy controls. (A) Principal component analysis (PCA) plot of all 153 serum samples. (B) Visualization of the transcription factors reporters that explain the variance of the principal components 1–5 (PC1–PC5)
No subtypes can be identified by the serum-induced signalling patterns within the hand OA and knee OA group
Next, we questioned whether we could also identify joint specific subtypes. Therefore, we generated a clustered heatmap of log-transformed luciferase reporter data (Fig. 3A and B). The dendrogram split the hand OA patients into two separate groups (n = 25 and n = 21 per group; Fig. 3A). However, in the PCA plot no clear separate groups are visible. Next, we investigated if the variation within the hand OA samples could be explained by a more simplistic clinical parameter. Hence, we correlated the PCs to a list of clinical parameters (e.g. age, gender, NRS pain, etc.). No significant correlation could be identified between the PCs and a clinical parameter. Likewise, for knee OA the dendrogram split the patient group into two (n = 4 and n = 51 per group; Fig. 3B). Additionally, no separate groups were visible in the PCA plot and no significant correlation were found between PCs and clinical parameters.
No subtypes can be identified by serum-induced signalling patterns within either the hand OA or knee OA group. (A) Log-transformed clustered heatmap of response of hand OA patients on transcription factor response element reporters. Principal component analysis (PCA) plot of hand OA samples and correlation of principal components to different clinical parameters. (B) Log-transformed clustered heatmap of response of knee OA patients on transcription factor response element reporters. PCA plot of hand OA samples and correlation of principal components to different clinical parameters
Discussion
OA is a very heterogeneous disease, with most likely different underlying molecular mechanisms that drive the disease. This is thought to be one of the main reasons why there is no disease-modifying drug available yet. Here, we aimed to clarify the heterogeneous aspect of OA by investigating whether the cell-integrated signalling patterns induced by serum from either hand OA patients, knee OA patients or HCs could help stratify them into groups and identify underlying disease processes (endotypes). We report that serum-induced cellular signalling pathway activity is different between samples from healthy, knee OA and hand OA donors and that this signalling pattern can be used to differentiate these patients. Furthermore, we investigated whether this method could be used to stratify patients within one joint group into different subtypes, but we could not confirm this in our groups with the current relatively small sample size.
In recent years there have been multiple studies investigating the difference between OA in different joints. There have been multiple animal studies in which evidence suggests that the molecular pathophysiology is different between joints, especially knee and hip OA [14–16]. In addition, studies with human samples revealed that the serum and SF cytokine profile is different between hip and knee OA [17]. Furthermore, the inflammatory processes in the synovium are also different between hip and knee OA as is the mononuclear cell population and their cytokine release profiles [18]. For example, synovial membrane cells isolated from hip tissue biopsies released higher concentrations of inflammatory cytokines, such as IL-17, TNF-α and IFN-γ, than those from knee biopsies. Besides differences between hip and knee OA, differences have also been reported between knee and post-traumatic wrist OA. Teunis et al. [19] described general higher inflammatory levels (e.g. IL-6 and IL-17) in SF from posttraumatic wrist OA compared with SF from primary knee OA. Furthermore, SF from knee OA and hand OA differed in protein composition and the SF provoked significant different responses in cytokine release, cell death and hypertrophy [20].
In the previously discussed studies, mainly SF was used. A disadvantage of SF is that it is not as easily accessible as serum. However, multiple efforts have been made to find a biomarker for patient stratification in serum, but none has proven successful for in-clinic use [21–24]. Most of these studies have focused on a single molecule as biomarker, but we think this approach very challenging in the case of OA as it is an extremely complex disease. We propose that a solution might be to investigate a panel of, e.g. cytokines or activated cell signalling pathways. Furthermore, the advantage of our method, a bioassay, is that it is a cell-based system in which the cell itself integrates all the signals that are presented by the stimulus, which mimicks the in vivo situation.
We demonstrated that based on 16 cell-based transcription factor luciferase reporter assays, we could subgroup serum derived from hand OA patients, knee OA patients and HCs. Furthermore, we have shown that the PCs are explained not by a single reporter assay, but by the combination of multiple reporters. This highlights again both the complexity of the disease as well as the need for more advanced techniques to identify signalling patterns/expression patterns (signatures) that can help us to better understand the molecular mechanisms driving OA. For example, our data point towards the use of a combination of the AP1, CRE, CSL, NBE, NFκB and SRF reporters as these together explained 51.4% of the variance of PC1. Of note, in this study we used the SW1353 chondrosarcoma cell line. We chose for this cell type because we have validated that positive controls induce activity of the designed transcription factor luciferase constructs in this cell type. This is important because each transcription factor is not present or active in every cell type, and results of transcription factor luciferase reporter assays can differ between cell types. However, a drawback of this cell line is that it is not a chondrocyte, making interpretation of our results in context of chondrocyte biology more difficult.
A limitation of this study is that serum samples from only one patient cohort were investigated, and that we could only match these cohorts for age, and not for sex, BMI or smoking. Furthermore, we cannot fully exclude that some patients had both hand and knee OA, because patients were not clinically evaluated for (subclinical) OA in other joints than the one they were included for. These factors could be confounding the results. Therefore, the subgroups defined herein need to be validated by a second, independent cohort of patients in which there is better matching of the patient and control groups. Only then can the true discriminative capacity of our bioassay be confirmed. Furthermore, serum samples used in this study were derived from a clearly defined patient group (e.g. age ≥50 years and pain score ≥5/10) and it would be highly interesting to investigate whether our developed bioassay also has potential to identify early OA and other types of OA such as post-traumatic OA. Serum also comes with the limitation that the differences we observe are not necessarily joint-derived, but can also be the result of a systemic response of other organs to the disease process or be confounded by the physiological condition of the patient due to, e.g. fasting, recent exercise or pain killer use. This makes interpretation of these findings in context of the pathophysiology of OA more difficult. Another limitation of our study is that the ethnicity of both the OA and healthy volunteer cohorts was all white, which possibly limits the value of our observations in people of other ethnicities.
We could not identify different subgroups within either the knee or the hand OA group. We found indications that differences exist, however we could not clearly uncover distinct groups. This may be attributed to the relatively low number of samples per group (hand OA n = 55, knee OA n = 56). Further investigations are needed, with larger cohorts, to determine whether our developed reporter assay can also be used for joint-specific patient stratification.
In conclusion, our novel OA serum induced cell-integrated signalling screening method was able to differentiate knee OA, hand OA and HC serum. These distinct OA types may require different pharmacological interventions [25]. For this, it will be interesting to further investigate intracellular pathways and upstream effectors that drive the activation of the identified transcription factors. In addition, further refinement of the current cell-based OA endotyping tool could improve personalized medicine approaches.
Supplementary Material
keae555_Supplementary_Data
The reference list from the paper itself. Each links out to its DOI / PubMed record.
- 1Hunter DJ , March L, Chew M. Osteoarthritis in 2020 and beyond: a Lancet Commission. Lancet 2020;396:1711–2.33159851 10.1016/S 0140-6736(20)32230-3 · doi ↗ · pubmed ↗
- 2Hermann W , Lambova S, Muller-Ladner U. Current treatment options for osteoarthritis. Curr Rheumatol Rev 2018;14:108–16.28875826 10.2174/1573397113666170829155149 · doi ↗ · pubmed ↗
- 3Berenbaum F. Deep phenotyping of osteoarthritis: a step forward. Ann Rheum Dis 2019;78:3–5.30154088 10.1136/annrheumdis-2018-213864 · doi ↗ · pubmed ↗
- 4Mobasheri A , Saarakkala S, Finnila M et al Recent advances in understanding the phenotypes of osteoarthritis. F 1000 Res 2019;8(F 1000 Faculty Rev):2091.10.12688/f 1000 research.20575.1PMC 691322531885861 · doi ↗ · pubmed ↗
- 5O'Neill TW , Mc Cabe PS, Mc Beth J. Update on the epidemiology, risk factors and disease outcomes of osteoarthritis. Best Pract Res Clin Rheumatol 2018;32:312–26.30527434 10.1016/j.berh.2018.10.007 · doi ↗ · pubmed ↗
- 6Dell’Isola A , Allan R, Smith SL et al Identification of clinical phenotypes in knee osteoarthritis: a systematic review of the literature. BMC Musculoskelet Disord 2016;17:425.27733199 10.1186/s 12891-016-1286-2PMC 5062907 · doi ↗ · pubmed ↗
- 7Karsdal MA , Christiansen C, Ladel C et al Osteoarthritis—a case for personalized health care? Osteoarthritis Cartilage 2014;22:7–16.24216058 10.1016/j.joca.2013.10.018 · doi ↗ · pubmed ↗
- 8Soul J , Dunn SL, Anand S et al Stratification of knee osteoarthritis: two major patient subgroups identified by genome-wide expression analysis of articular cartilage. Ann Rheum Dis 2018;77:423.29273645 10.1136/annrheumdis-2017-212603 PMC 5867416 · doi ↗ · pubmed ↗