Prognostic impact of effusion in multiple body cavities after allogeneic hematopoietic stem cell transplantation
Yasutaka Masuda, Akira Honda, Takashi Oyama, Yosuke Masamoto, Mineo Kurokawa

TL;DR
This study examines how fluid buildup in multiple body cavities after stem cell transplants affects patient survival, finding that more cavities involved are linked to worse outcomes.
Contribution
The study introduces a novel analysis of cumulative effusion sites as a prognostic indicator in allo-HSCT recipients.
Findings
Patients with effusions in three cavities had a 18.8% 2-year survival rate, significantly lower than those with fewer or no effusions.
Effusion in multiple cavities was associated with an additive adverse effect on patient outcomes.
Cumulative incidence of effusions in different cavities was highest in the first 100 days post-transplant.
Abstract
Fluid retention presenting as effusions in body cavities is sometimes encountered following allogeneic stem cell transplantation (allo-HSCT). It is unclear whether cavity effusions at independent sites may serve as cumulative correlates of fluid overload and whether a higher number of effusion sites are associated with a worse prognosis. Here, we comprehensively reviewed pleural, peritoneal, and pericardial effusions in 178 first allo-HSCT recipients retrospectively. A total of 123 (69.1%) patients developed effusions in any cavity. New pleural, peritoneal, and pericardial effusions were found after allo-HSCT in 106, 88, and 53 patients, at a median of 38.0 (range, 2–2950), 22.5 (range, 2–1324), and 40 (range, 2–945) days, respectively. The cumulative incidence at day 100 was 41.0%, 40.4%, and 20.8%, respectively. Of the 92 patients who presented with effusions by day 100, 28 patients…
Genes, proteins, chemicals, diseases, species, mutations and cell lines named across the full text — each resolved to its canonical identifier and authoritative record.
Click any figure to enlarge with its caption.
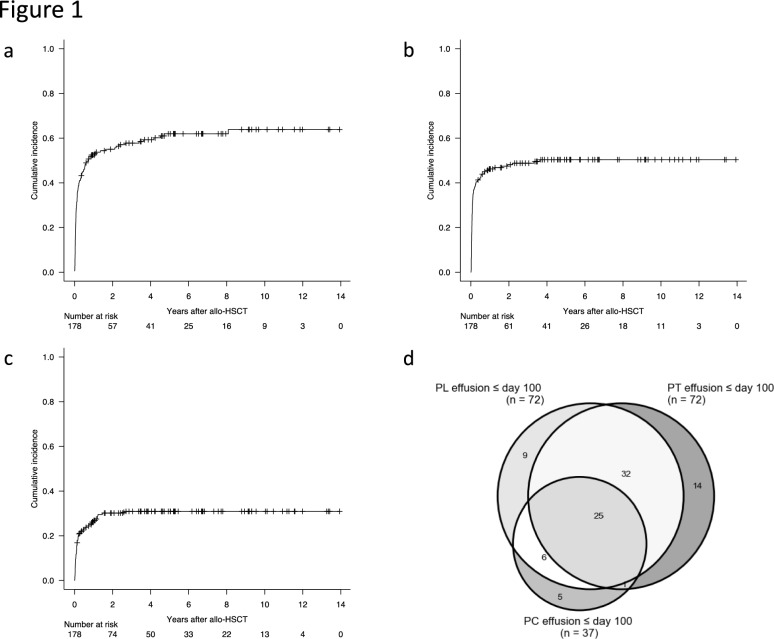 Figure 1
 Figure 2
- —http://dx.doi.org/10.13039/501100001691Japan Society for the Promotion of Science
- —The University of Tokyo
Peer Reviews
No public reviews on file for this paper yet. If you reviewed it on a platform where reviews are public (OpenReview, ICLR, NeurIPS, ICML), you can paste yours below so the community can read it here.
Videos
No videos yet. Explain this paper in a talk, walkthrough, or lecture? Add one.
Taxonomy
TopicsHematopoietic Stem Cell Transplantation · Lymphatic Disorders and Treatments · Neutropenia and Cancer Infections
Introduction
The outcome of allogeneic hematopoietic stem cell transplantation (allo-HSCT) has improved over the last decades [1–3]; however, a unique array of complications still puts some patients at risk for potentially life-threatening situations. Thus, comprehensive assessment of the patient’s status and timely management are warranted to improve transplantation outcomes. Fluid retention presenting as effusions in body cavities is sometimes encountered post-allo-HSCT. Few studies have examined cavity effusions in adult patients undergoing allo-HSCT. While the causal link between effusions and prognosis is still obscure, previous studies have suggested that cavity effusions could be surrogates for poor survival [4–8]. These studies examined pleural (PL), peritoneal (PT), or pericardial (PC) effusions independently, and few studies have addressed when and where cavity effusions in different locations occur and how much those are related to prognosis. Under the hypothesis that cavity effusions at independent sites may serve as cumulative correlates of fluid overload and may be associated with a worse prognosis depending on the number of effusion sites, we conducted a comprehensive analysis of effusions in three body cavities simultaneously post-allo-HSCT to identify predictive factors for and prognostic impact of effusions.
Methods
Patients and data collection
We conducted a retrospective study of adult patients (aged ≥ 16) who underwent their first allo-HSCT between January 2010 and December 2020 at the University of Tokyo Hospital. Patients who underwent computed tomography (CT) allowing cavity effusions at least once after transplantation were included for analysis. The clinical data were collected from electronic medical records. This study was approved by the Ethics Committee of the University of Tokyo Hospital.
The size of PL effusion was classified into small (≤20% of the hemithorax), moderate (20–40%), and large (>40%) based on the estimation of the anteroposterior quartile [9]. The size of PT effusion was classified into small when confined to the rectovesical pouch and large in other cases [6]. PC effusion was defined as a fluid collection within pericardium with a maximal depth of 10 mm or more [7].
Definitions
For malignant hematological diseases, refined disease risk index (DRI) was defined as previously described [10]. For non-malignant and non-hematological diseases, DRI was defined low. For solid tumors, DRI was not defined. Myeloablative conditioning was defined as regimens that included either total body irradiation >8 Gy, busulfan >9 mg/kg, or melphalan >140 mg/m^2^, and all other regimens were considered reduced intensity conditioning [11, 12]. The donor group was classified according to the number of mismatched alleles of human leucocyte antigen (HLA) loci (HLA-A, -B, -C, and -DR) for the graft-versus-host direction. The Hematopoietic Cell Transplantation-Comorbidity Index was evaluated based on the criteria by Sorror et al. [13]. Neutrophil engraftment was defined as the first day of three consecutive days with absolute neutrophil count exceeding 0.5 × 10^9^/L. Performance status was evaluated as per Eastern Cooperative Oncology Group Performance Status Scale [14]. Acute GVHD, thrombotic microangiopathy (TMA), and sinusoidal obstruction syndrome (SOS) were diagnosed according to the traditional criteria [15–20]. Cytomegalovirus (CMV) viremia was defined as three or more positive cells per two slides (CMV pp65 antigenemia C10/C11) [21]. Pre-transplant EASIX was calculated by lactate dehydrogenase (U/L) × creatinine (mg/dL)/thrombocytes (nL), each obtained before conditioning chemotherapy [22].
During the first 100 days post-allo-HSCT (D100) and at the time of effusion recurrence, the number of concurrent cavities with effusion (zero to three) was counted. In a patient who underwent several CT examinations by D100, the maximum number of effusion-positive cavities was used for analysis. For the analysis of the prognosis according to the attenuation of effusions, the date when the number of affected cavities reached the maximum by D100 was defined as the date of onset of effusion.
Endpoints
The primary endpoint was the 2-year overall survival (OS, time from transplantation until death from any cause) rate. Secondary endpoints included 100-day and 2-year cumulative incidence of cavity effusions, the 2-year cumulative incidence of relapse (CIR, the first documented relapse or progression of the disease) rate, the 2-year non-relapse mortality (NRM, death without evidence of relapse or progression of the disease) rate, and the relation between patient characteristics and the onset of cavity effusions.
Patients who were alive at the last follow-up or who received a second transplantation were censored. Disease relapse was diagnosed with molecular, morphological, and/or imaging findings. When complete response was not achieved after transplantation in cases with a pre-transplantation disease status of not in remission in malignant disorders, the day of relapse was defined as day +0.1 from the landmark point (described below).
Statistical analysis
Pearson’s chi-squared test was used for comparing categorical data. Wilcoxon signed-rank sum test and Mann–Whitney U test were used for comparing continuous data with paired and unpaired variables, respectively. The probability of OS was estimated according to the Kaplan–Meier method, and the groups were compared using the log-rank test; Holm–Bonferroni correction was applied for the comparisons among more than two groups. Probabilities of CIR, NRM, and cavity effusions were analyzed by cumulative incidence methods, and the groups were compared using the Gray test [23]. Relapse and NRM were considered competing risks with each other. The competing risk for cavity effusions was death before cavity effusions of interest. The Cox proportional hazard regression model was employed to identify the factors influencing OS, and the Fine–Gray competing risk regression model for CIR, NRM, and cavity effusions. Wald test was employed to assess overall P values for factors with >2 levels (e.g., number of cavities of effusion). Univariate and multivariate analyses were performed to identify predictive factors for cavity effusions after allo-HSCT. Variables with a P value <0.1 in the univariate analysis were subjected to the multivariate analysis.
The effects of clinical events occurring post-transplantation on clinical outcomes were analyzed among patients who survived without undergoing second HSCT by D100 (landmark point).
All tests were two sided, and P < 0.05 was considered statistically significant. Statistical analyses were performed with R (version 4.4.1; https://cran.r-project.org) and EZR (Saitama Medical Center, Jichi Medical University, Saitama, Japan) [24], which is a graphical user interface for R version 4.3-1 (R Foundation for Statistical Computing, Vienna, Austria). Figure presentation was performed either with EZR or with Python software program for Mac (version 3.8.18; https://www.python.org).
Results
Patient characteristics
During the study period, 191 patients underwent the first allo-HSCT at our department. 178 patients who underwent CT examinations at least once post-allo-HSCT were subjected to further analysis. Table 1 summarizes the baseline characteristics of the studied population. Post-transplant cyclophosphamide was not used in any patients. Table 1. Characteristics of studied patientsCharacteristicsValueAge—no. (%) <5093 (52.2) ≥5085 (47.8)Recipient sex—no. (%) Male111 (62.4) Female67 (37.6)Sex match between recipient and donor—no. (%) Match103 (57.9) Male to female28 (15.7) Female to male39 (21.9) Not confirmed8 (4.5)Diagnosis—no. (%) AML69 (38.8) Other myeloid neoplasms^a^34 (19.1) Lymphoid and ambiguous lineage neoplasms^b^57 (32.0) Inborn errors of metabolism^c^14 (7.9) Others^d^4 (2.2)Refined DRI—no. (%) Low/intermediate104 (58.4) High/very high71 (39.9) Not confirmed3 (1.7)Donor type—no. (%) MRD/MUD101 (56.7) MMRD/MMUD44 (24.7) CB33 (18.5)Cell source—no. (%) PBSC29 (16.3) BM116 (65.2) CB33 (18.5)ABO—no. (%) Match74 (41.6) Major mismatch35 (19.7) Minor mismatch40 (22.5) Bidirectional mismatch29 (16.3)CMV antibody—no. (%) Both negative25 (14.0) Either positive133 (74.7) Not confirmed20 (11.2)HCT-CI score—no. (%) 0103 (57.9) ≥175 (42.1)ECOG PS—no. (%) 0103 (57.9) ≥175 (42.1)Conditioning regimen intensity—no. (%) MAC109 (61.2) RIC69 (38.8)GVHD prophylaxis—no. (%) CNI + MTX160 (89.9) Others18 (10.1)Engraftment day—no. (%) <Day 1843 (24.2) ≥Day 18121 (68.0) Not engrafted/not confirmed14 (7.9)Grade 2–4 acute GVHD—no. (%) No95 (53.4) Yes77 (43.3) Not confirmed6 (3.4)TMA—no. (%) No166 (93.3) Yes12 (6.7)SOS—no. (%) No171 (96.1) Yes7 (3.9)CMV viremia—no. (%) No100 (56.2) Yes75 (42.1) Not confirmed3 (1.7)AML acute myeloid leukemia, BMT bone marrow transplantation, CB cord blood, CBT cord blood transplantation, CMV cytomegalovirus, DRI disease risk index, ECOG PS Eastern Cooperative Oncology Group Performance Status Scale, GVHD graft-versus-host disease, HCT-CI Hematopoietic Cell Transplantation-Comorbidity Index, MAC myeloablative conditioning, MMRD HLA-mismatched related donor, MMUD HLA-mismatched unrelated donor, MRD HLA-matched related donor, MUD HLA-matched unrelated donor, PBSCT peripheral blood stem cell transplantation, RIC reduced intensity conditioning, SOS sinusoidal obstruction syndrome, TMA thrombotic microangiopathy^a^20 patients with myelodysplastic syndrome, 11 with myeloproliferative neoplasms, and 3 with myelodysplastic/myeloproliferative neoplasms^b^28 patients with acute lymphoblastic leukemia, 26 with other T-cell/NK-cell neoplasms, and 3 with other B-cell neoplasms^c^14 patients with adrenoleukodystrophy^d^1 patient with aplastic anemia, 2 with hemophagocytic lymphohistiocytosis, and 1 with invasive thymoma
Timing of cavity effusions
A total of 123 (69.1%) presented with effusions either in the PL, PT, or PC cavity post-allo-HSCT during the whole observation period. CT examinations were performed with the median of 9 (range, 1–50) times and 5 (range, 1–18) times in patients with and without effusion in at least one cavity, respectively (P < 0.001).
To explore the temporal characteristics of cavity effusions post-allo-HSCT, the date of first or recurrent effusion was studied. The PL, PT, and PC effusions were found in 106, 88, and 53 patients for the first time post-allo-HSCT with a median of 38.0 (range, 2–2950), 22.5 (range, 2–1324), and 40 (range, 2–945) days. The cumulative incidence of PL, PT, and PC effusions were 41.0% (95% confidence interval (CI), 33.7–48.1%), 40.4% (95% CI, 33.2–47.6%), and 20.8% (95% CI, 15.2–27.1%) at D100, and 55.0% (95% CI, 47.3–62.1%), 48.1% (95% CI, 40.5–55.3%), and 30.1% (95% CI, 23.4–37.1%) at 2 years post-allo-HSCT, respectively (Fig. 1a–c).Fig. 1. Incidence and locations of cavity effusions following allo-HSCT. Cumulative incidence of pleural (a), peritoneal (b), and pericardial (c) effusions after allo-HSCT. d Combinations of effusion locations that presented within 100 days following allo-HSCT
We next focused on cavity effusions detected by D100. CT examinations were performed with the median of 2 (range, 0–16) times and 4 (range, 1–16) times in patients with and without effusion in at least one cavity by D100, respectively (P < 0.001). A total of 92 (51.7%) out of 178 patients presented with effusions in either cavity. The combinations of effusion-positive cavities are presented in Fig. 1d. The PL, PT, and PC were found in 72, 72, and 37 patients, respectively. While 28 (30.4%) out of 92 patients with at least one effusion-positive cavity presented with an effusion in a single cavity, other patients presented with effusions in two or more studied cavities simultaneously or sequentially: 39 (42.4%) patients presented with effusions in two cavities, and 25 (27.2%) in all of three cavities.
Out of 92 patients who presented with cavity effusions by D100, 42 (45.7%) patients developed recurrent cavity effusions at the same cavity beyond D100. The day of recurrence clustered around day 200, with a median of 213 (inter-quartile range, 154–379.3). Effusions in other cavities besides the recurrent cavities were observed in a subset of patients, with the number of affected cavities at recurrence totaling one in 18 patients, two in 17, and three in 7. Most of the effusion relapse occurred at PL: a total of 38, 24, and 11 patients presented with PL, PT, and PC effusions, respectively.
These results show that the majority of the cavity effusions, mostly involving PL and PT cavities, occur acutely within D100 following allo-HSCT, with a subset of patients presenting recurrence beyond D100.
Prognostic impact of cavity effusions
The median observation period was 778 (range, 8–5088) days, 430 (range, 11–4839) days, and 1413 (range, 8–5088) days in patients with and without effusion in at least one cavity (P < 0.001). By D100, 5 patients underwent second allo-HSCT, and 18 died, with 155 remaining alive on D100 (landmark point). As a primary endpoint, the 2-year OS rate of the whole studied population was 63.7% (95% CI, 55.7–70.5%). The 2-year CIR and NRM rate were 30.1% (95% CI, 23.4–37.1%) and 19.7% (95% CI, 14.1–26.0%), respectively.
Our primary goal of the research was to investigate the association of fluid retention in various body cavities and their prognostic impact. On univariate and multivariate analysis to assess the impact of transplantation-related factors on OS, cavity effusions by D100 were associated with significant inferior OS regardless of its locations (Table 2). The presence of effusions was associated with significantly worse OS on univariate analysis. Concomitantly, the 2-year OS rate of patients with PL, PT, and PC effusions was 51.1% (95% CI, 36.0–64.3%), 54.4% (95% CI, 39.2–67.3%), and 23.9% (95% CI, 8.8–43.0%), respectively (Fig. 2a–c). Table 2. Risk factors affecting overall survival, cumulative incidence of relapse, and non-relapse mortalityCharacteristicsOverall survivalCumulative incidence of relapseNon-relapse mortalityUnivariate analysisMultivariate analysisUnivariate analysisMultivariate analysisUnivariate analysisMultivariate analysisHR (95% CI)P valuesHR (95% CI)P valuesHR (95% CI)P valuesHR (95% CI)P valuesHR (95% CI)P valuesHR (95% CI)P valuesAge—no. (%) <5011111 ≥501.99 (1.24–3.19)0.0041.33 (0.61–2.90)0.471.05 (0.64–1.71)0.852.55 (1.35–4.84)0.0043.49 (1.26–9.64)0.02Recipient sex—no. (%) Male1111 Female1.47 (0.92–2.34)0.101.52 (0.93–2.49)0.101.45 (0.89–2.37)0.141.10 (0.60–2.04)0.76Sex match between recipient and donor—no. (%) Match111 Male to female1.62 (0.91–2.90)0.101.22 (0.67–2.24)0.511.50 (0.71–3.20)0.29 Female to male0.89 (0.48–1.64)0.710.67 (0.34–1.34)0.260.83 (0.39–1.78)0.63Diagnosis—no. (%) AML11111 Other myeloid neoplasms1.01 (0.55–1.86)1.000.70 (0.33–1.49)0.350.68 (0.33–1.38)0.280.56 (0.25–1.24)0.151.62 (0.83–3.15)0.16 Lymphoid and ambiguous lineage neoplasms0.85 (0.49–1.48)0.570.68 (0.32–1.47)0.331.34 (0.81–2.21)0.251.32 (0.76–2.27)0.320.85 (0.43–1.67)0.64 Inborn errors of metabolism0.23 (0.05–0.95)0.040.57 (0.12–2.74)0.490.00 (0.00–0.00)<****0.0010.00 (0.00–0.00)<****0.0010.52 (0.14–1.98)0.34 Others0.97 (0.23–4.06)0.960.00 (0.00-Inf)1.000.75 (0.10–5.39)0.770.00 (0.00–0.00)<****0.0011.14 (0.13–10.23)0.91Refined DRI—no. (%) Low/intermediate111111 High/very high3.32 (2.05–5.37)<****0.0012.39 (1.24–4.60)0.0092.12 (1.29–3.49)0.0032.46 (1.48–4.08)<****0.0012.16 (1.17–3.98)0.010.74 (0.32–1.71)0.48Donor type—no. (%) MRD/MUD111 MMRD/MMUD1.02 (0.59–1.76)0.940.87 (0.48–1.56)0.631.18 (0.62–2.27)0.61 CB1.05 (0.55–2.00)0.881.48 (0.84–2.62)0.181.00 (0.43–2.32)0.99Cell source—no. (%) PBSC111 BM1.57 (0.77–3.18)0.210.68 (0.41–1.11)0.121.29 (0.66–2.55)0.46 CB1.51 (0.63–3.58)0.351.48 (0.84–2.62)0.181.00 (0.43–2.32)0.99ABO—no. (%) Match11111 Major mismatch0.92 (0.47–1.81)0.801.25 (0.70–2.24)0.451.59 (0.79–3.18)0.190.68 (0.28–1.64)0.390.45 (0.09–2.10)0.31 Minor mismatch1.23 (0.69–2.20)0.491.73 (1.03–2.90)0.042.22 (1.18–4.17)0.0140.52 (0.23–1.21)0.130.66 (0.24–1.81)0.42 Bidirectional mismatch1.25 (0.65–2.42)0.500.83 (0.40–1.70)0.611.22 (0.55–2.69)0.621.87 (0.98–3.59)0.060.94 (0.29–3.10)0.92CMV antibody—no. (%) Both negative1.07 (0.48–2.38)111 Either positive2.84 (1.14–7.06)0.032.33 (0.67–8.01)0.181.39 (0.62–3.14)0.432.62 (0.78–8.83)0.12HCT-CI score—no. (%) 0111 ≥11.45 (0.91–2.31)0.111.11 (0.68–1.81)0.691.55 (0.85–2.83)0.15ECOG PS—no. (%) 0111 ≥11.21 (0.76–1.92)0.421.05 (0.64–1.73)0.840.98 (0.53–1.80)0.94Conditioning regimen intensity—no. (%) MAC11111 RIC1.56 (0.98–2.48)0.060.89 (0.42–1.86)0.750.74 (0.43–1.26)0.272.22 (1.21–4.07)0.010.92 (0.37–2.27)0.85GVHD prophylaxis—no. (%) CNI + MTX111 Others1.33 (0.66–2.68)0.421.06 (0.47–2.41)0.881.28 (0.48–3.36)0.62Engraftment day—no. (%) <day 18111 ≥day 181.75 (0.88–3.49)0.111.16 (0.64–2.09)0.632.19 (0.76–6.25)0.15Grade 2–4 acute GVHD—no. (%) No1111 Yes1.34 (0.79–2.29)0.280.70 (0.41–1.19)0.182.66 (1.16–6.13)0.022.86 (1.16–7.08)0.02TMA—no. (%) No111 Yes1.30 (0.41–4.17)0.660.38 (0.05–2.75)0.331.94 (0.50–7.56)0.34SOS—no. (%) No1111 Yes1.73 (0.42–7.13)0.451.37 (0.35–5.44)0.650.00 (0.00–0.00)<****0.0010.00 (0.00–0.00)<****0.001CMV viremia—no. (%) No1111 Yes1.45 (0.85–2.48)0.170.69 (0.41–1.16)0.162.53 (1.13–5.67)0.021.98 (0.79–5.00)0.15Fluid retention—no. (%) Locations No PL/PT/PC effusion1111 PL effusion2.96 (1.73–5.05)<****0.0011.42 (0.84–2.38)0.192.32 (1.09–4.97)0.03 PT effusion2.29 (1.34–3.91)0.0021.18 (0.70–2.00)0.542.44 (1.14–5.23)0.02 PC effusion4.63 (2.61–8.23)<****0.0011.79 (0.98–3.26)0.061.57 (0.91–2.71)0.102.33 (0.97–5.61)0.06Number of affected cavities None11111 Single cavity2.60 (1.24–5.44)0.012.96 (1.30–6.76)0.011.29 (0.68–2.46)0.441.13 (0.42–2.99)0.812.36 (0.86–6.47)0.10 Double cavities3.12 (1.56–6.25)0.0012.77 (1.30–5.90)0.0081.25 (0.69–2.27)0.461.60 (0.69–3.73)0.271.96 (0.73–5.29)0.18 Triple cavities7.94 (3.59–17.56)<****0.0016.69 (2.77–16.15)<****0.0011.42 (0.63–3.19)0.43.13 (1.13–8.65)0.036.27 (1.40–28.13)0.02Bold values indicate values with statistical significanceAML acute myeloid leukemia, BMT bone marrow transplantation, CB cord blood, CBT cord blood transplantation, CMV cytomegalovirus, CNI calcineurin inhibitor, DRI disease risk index, ECOG PS Eastern Cooperative Oncology Group Performance Status Scale, GVHD graft-versus-host disease, HCT-CI Hematopoietic Cell Transplantation-Comorbidity Index, MAC myeloablative conditioning, MMRD HLA-mismatched related donor, MMUD HLA-mismatched unrelated donor, MRD HLA-matched related donor, MTX methotrexate, MUD HLA-matched unrelated donor, PBSCT peripheral blood stem cell transplantation, RIC reduced intensity conditioning, SOS sinusoidal obstruction syndrome, TMA thrombotic microangiopathyFig. 2Prognostic impact of cavity effusions following allo-HSCT. Overall survival of patients with pleural (a), peritoneal (b), and pericardial (c) effusions within the first 100 days following allo-HSCT. Overall survival (d), cumulative incidence (e), and non-relapse mortality (f) stratified according to the number of effusion-positive cavities within the first 100 days following allo-HSCT
The impact of the number of effusion-positive cavities on OS showed additive effect; effusions in single, double, and triple cavities were associated with OS with the HR of 2.96 (95% CI, 1.30–6.67; P = 0.01), 2.77 (95% CI, 1.30–5.90; P = 0.008), and 6.69 (95% CI, 2.77–16.1; P < 0.001), respectively, on multivariate analysis (overall P < 0.001; Table 2). The 2-year OS rate of patients with effusions at no, single, double, and triple cavities were 86.1% (95% CI, 76.3–92.1), 60.0% (95% CI, 38.3–76.2), 59.6% (95% CI, 39.0–75.3), and 18.8% (95% CI, 3.1–44.7), respectively (overall P < 0.001; Fig. 2d).
To investigate the relationship between cavity effusions and OS, regression analysis of CIR and NRM was performed, and the primary causes of death in patients with or without cavity effusions were examined. Neither PL, PT, nor PC effusions were associated with CIR (Table 2). Concomitantly, the number of effusion-positive cavities was not associated with CIR (overall P = 0.43; Fig. 2e). In contrast, PL and PT effusions were significantly associated with NRM on univariate analysis. Although a number of effusion-positive cavities were not significantly associated with NRM overall (P = 0.08), effusion in triple cavities was significantly associated with NRM on multivariate analysis (HR, 6.27; 95% CI, 1.40–28.1; P = 0.02; Fig. 2f; Table 2). Regarding the primary causes of death, patients with multiple effusion-positive cavities were more likely to die due to infection than those with none or single effusion-positive cavities (16 out of 41 deaths vs. 3 out of 32 deaths: Table 3). Table 3. Primary death causes stratified by the number of effusion-positive cavities within day 100 following allo-HSCTNone or singleMultipleTotalDisease recurrence—no. (%)10 (32.3)9 (22.0)19 (26.4)Infection—no. (%)3 (9.7)16 (39.0)19 (26.4)Pulmonary complications other than infection—no. (%)4 (12.9)4 (9.8)8 (11.1)Organ failure—no. (%)3 (9.7)2 (4.9)5 (6.9)Bleeding—no. (%)3 (9.7)2 (4.9)5 (6.9)Acute GVHD—no. (%)2 (6.5)3 (7.3)5 (6.9)TMA—no. (%)2 (6.5)1 (2.4)3 (4.2)SOS—no. (%)1 (3.2)1 (2.4)2 (2.8)Chronic GVHD—no. (%)0 (0.0)2 (4.9)2 (2.8)Aging—no. (%)1 (3.2)0 (0.0)1 (1.4)Trauma—no. (%)1 (3.2)0 (0.0)1 (1.4)Graft failure—no. (%)0 (0.0)1 (2.4)1 (1.4)Unknown—no. (%)1 (3.2)0 (0.0)1 (1.4)Total—no. (%)31 (100.0)41 (100.0)72 (100.0)GVHD graft-versus-host disease, SOS sinusoidal obstruction syndrome, TMA thrombotic microangiopathy
Taken together, cavity effusions following allo-HSCT were strongly and independently associated with inferior survival in a manner dependent on the number of effusion-positive cavities.
Characteristics and conditions associated with cavity effusions
Knowing the association between effusion and poor prognosis, we set out to characterize the cavity effusions in terms of its size and associated allo-HSCT conditions. Out of 106 PL effusions which were found for the first time in each patient after allo-HSCT, 76 (71.7%) were bilateral. Left-sided effusions (31, 29.2%) were slightly more common than right-sided effusions (22, 20.8%). The majority of the PL effusions was small (81 (76.4%) cases), even when restricted to the acute phase in the first 100 days following allo-HSCT (57 (79.2%) out of 72 cases of PL effusion during the first 100 days following allo-HSCT), while the minority was moderate sized (14 (13.2%) cases during the whole observation period, and 6 (8.3%) cases during the first 100 days following allo-HSCT; others lack original imaging data). Similarly, small PT effusions were more frequently encountered than moderate PT effusions during the whole observation period and during the first 100 days (67 vs. 21, and 57 vs. 15, respectively). During the first 100 days, 6 cases of moderate PL effusions and 15 cases of PT effusions were only found in patients with multiple sites of effusions. The albumin level was 2.8 g/dL (range, 1.4–5.0 g/dL), 2.8 g/dL (range, 1.4–4.8 g/dL), and 2.8 g/dL (range, 1.8–4.4 g/dL) when PL, PT, and PC effusions were first observed, respectively (reference range, 4.1–5.1 g/dL). These values were significantly lower compared to albumin level on day 0 (median, 3.6 mg/dL for all 178 patients; P < 0.001 for each effusion). By D100, the proportion of patients who were administered systemic steroids was higher in patients with effusions(s) than those without: 22 out of 92 (23.9%) patients vs. 9 out of 86 (10.5%) patients (P = 0.03).
Primarily associated conditions at the time of effusions were next investigated. Cavity effusions were associated with varying conditions depending on the time of onset and whether they were recurrent or not (Table 4). While volume overload/heart failure, SOS, and engraftment syndrome were predominantly associated with effusions within the first 100 days, pneumonia was associated with PL effusions both in the acute (14 cases) and chronic (8 cases) phases after allo-HSCT. Of note, no specific causes of effusions were identified in a substantial proportion of patients. To reveal possible associations with these complications and effusions, the number of patients diagnosed with specific complications by D100 were compared with or without effusion in at least one cavity by D100 (Supplementary Table 1). The proportion of patients who experienced engraftment syndrome, thrombotic microangiopathy, and bacterial infection was significantly higher in those with CT-identified effusion(s). Table 4. Conditions associated with cavity effusionsFirst timeRecurrent > 100 days≤100 days>100 daysTotalPL effusion Pneumonia^a^—no. (%)14 (19.4)8 (23.5)22 (20.8)18 (47.4) Volume overload/heart failure—no. (%)11 (15.3)4 (11.8)15 (14.2)3 (7.9) NIPC—no. (%)2 (2.8)8 (23.5)10 (9.4)3 (7.9) Kidney injury excluding TMA—no. (%)2 (2.8)1 (2.9)3 (2.8)1 (2.6) Sepsis—no. (%)0 (0.0)0 (0.0)0 (0.0)1 (2.6) Engraftment syndrome—no. (%)2 (2.8)0 (0.0)2 (1.9)0 (0.0) SOS—no. (%)1 (1.4)0 (0.0)1 (0.9)0 (0.0) Malignancy—no. (%)0 (0.0)1 (2.9)1 (0.9)3 (7.9) TMA—no. (%)2 (2.8)0 (0.0)2 (1.9)1 (2.6) GI GVHD—no. (%)0 (0.0)0 (0.0)0 (0.0)1 (2.6) Others—no. (%)0 (0.0)0 (0.0)0 (0.0)2 (5.3) Not determined—no. (%)38 (52.8)12 (35.3)50 (47.2)5 (13.6) Total—no. (%)72 (100.0)34 (100.0)106 (100.0)38 (100.0)PT effusion Volume overload/heart failure—no. (%)9 (12.5)1 (6.3)10 (11.4)2 (8.3) Engraftment syndrome—no. (%)6 (8.3)0 (0.0)6 (6.8)0 (0.0) SOS—no. (%)3 (4.2)0 (0.0)3 (3.4)0 (0.0) TMA—no. (%)2 (2.8)0 (0.0)2 (2.3)1 (4.2) Kidney injury excluding TMA—no. (%)1 (1.4)1 (6.3)2 (2.3)1 (4.2) GI GVHD—no. (%)2 (2.8)0 (0.0)2 (2.3)2 (8.3) Ileus, enteritis—no. (%)5 (6.9)1 (6.3)6 (6.8)1 (4.2) Sepsis—no. (%)0 (0.0)0 (0.0)0 (0.0)1 (4.2) Others—no. (%)0 (0.0)0 (0.0)0 (0.0)2 (8.3) Not determined—no. (%)44 (61.1)13 (81.3)57 (64.8)14 (58.3) Total—no. (%)72 (100.0)16 (100.0)88 (100.0)24 (100.0)PC effusion Volume overload/heart failure—no. (%)6 (16.2)0 (0.0)6 (11.3)1 (9.1) TMA—no. (%)2 (5.4)0 (0.0)2 (3.8)1 (9.1) Kidney injury excluding TMA—no. (%)0 (0.0)1 (6.3)1 (1.9)0 (0.0) Sepsis—no. (%)0 (0.0)0 (0.0)0 (0.0)1 (9.1) GI GVHD—no. (%)0 (0.0)0 (0.0)0 (0.0)1 (9.1) Not determined—no. (%)29 (78.4)15 (93.8)53 (83.2)7 (63.6) Total—no. (%)37 (100.0)16 (100.0)53 (100.0)11 (100.0)GVHD graft-versus-host disease, NIPC non-infectious pulmonary complications, SOS sinusoidal obstruction syndrome, TMA thrombotic microangiopathy^a^Cases with determined causative microbes of pneumonia were as follows: multi-drug-resistant Pseudomonas aeruginosa was identified from sputum culture in two cases, Mycobacterium tuberculosis DNA from sputum in one case, Stenotrophomonas maltophilia from sputum culture in one case, and CMV DNA from sputum in one case
As for 42 patients with recurrent effusions beyond D100, 37 were hospitalized for underlying conditions. Eighteen patients were receiving immunosuppressants for active chronic GVHD. A total of 18 cases with PL effusion were associated with pneumonia, although the causal microbes were not detected in all cases. Volume overload or heart failure was scarcely represented in this period.
Predictive factors for cavity effusions
Finally, to identify predictive factors for cavity effusions, various transplant-related variables were subjected to univariate and multivariate analysis. During the whole observation period, high/very high refined DRI was associated with effusions on univariate analysis, regardless of their location (Supplementary Table 2). Except for PC effusion, high/very high refined DRI was associated with effusions also on multivariate analysis.
Predictive factors for effusions depending on the number of effusion-positive cavities during the acute phase (≤D100) following allo-HSCT were next investigated. Higher refined DRI was consistently associated both with single and with multiple cavities of effusions on multivariate analysis (Table 5). These patients with higher DRI were significantly associated with older age at transplantation, higher HCT-CI scores, and higher pre-transplant EASIX (Supplementary Table 3). Although not statistically significant, worse ECOG PS and shorter time from diagnosis to transplantation despite comparable cycles of cytotoxic chemotherapy were also observed in patients with higher DRI. Table 5. Transplantation variables associated with cavity effusions according to the number of effusion-positive cavitiesCharacteristicsSingle cavityDouble cavitiesTriple cavitiesUnivariate analysisMultivariate analysisUnivariate analysisMultivariate analysisUnivariate analysisMultivariate analysisHR (95% CI)P valuesHR (95% CI)P valuesHR (95% CI)P valuesHR (95% CI)P valuesHR (95% CI)P valuesHR (95% CI)P valuesAge—no. (%) <501111 ≥501.09 (0.72–1.63)0.691.64 (1.00–2.69)0.051.26 (0.59–2.70)0.561.70 (0.76–3.76)0.19Recipient sex—no. (%) Male111 Female0.95 (0.63–1.45)0.810.68 (0.41–1.14)0.150.76 (0.33–1.75)0.52Sex match between recipient and donor—no. (%) Match111 Male to female0.80 (0.45–1.41)0.440.92 (0.48–1.76)0.790.96 (0.33–2.79)0.95 Female to male1.01 (0.61–1.67)0.981.41 (0.80–2.49)0.241.35 (0.57–3.23)0.50Diagnosis—no. (%) AML1111 Other myeloid neoplasms1.43 (0.88–2.32)0.151.24 (0.69–2.24)0.471.41 (0.56–3.56)0.471.33 (0.43–4.08)0.62 Lymphoid and ambiguous lineage neoplasms1.35 (0.88–2.06)0.171.40 (0.85–2.32)0.190.81 (0.34–1.92)0.630.87 (0.33–2.28)0.78 Inborn errors of metabolism0.47 (0.16–1.34)0.160.33 (0.08–1.37)0.130.00 (0.00–0.00)<0.0010.00 (0.00–0.00)<0.001 Others2.99 (0.59–15.05)0.192.00 (0.36–11.27)0.432.18 (0.24–19.74)0.494.70 (0.24–90.46)0.31Refined DRI—no. (%) Low/intermediate111111 High/very high1.71 (1.14–2.57)0.011.71 (1.14–2.57)0.012.13 (1.30–3.48)0.0031.81 (1.04–3.17)0.042.79 (1.24–6.30)0.012.62 (1.10–6.25)0.03Donor type—no. (%) MRD/MUD111 MMRD/MMUD1.35 (0.86–2.13)0.191.06 (0.60–1.88)0.840.97 (0.39–2.43)0.95CB1.08 (0.65–1.79)0.761.13 (0.62–2.05)0.691.07 (0.41–2.79)0.88Cell source—no. (%) PBSC111 BM1.06 (0.69–1.63)0.791.24 (0.74–2.09)0.420.96 (0.43–2.16)0.93 CB1.08 (0.65–1.79)0.761.13 (0.62–2.05)0.691.07 (0.41–2.79)0.88ABO—no. (%) Match1111 Major mismatch1.14 (0.68–1.91)0.621.23 (0.67–2.24)0.502.11 (0.91–4.90)0.082.29 (0.83–6.35)0.11 Minor mismatch0.76 (0.46–1.27)0.301.21 (0.69–2.12)0.510.86 (0.32–2.28)0.760.93 (0.25–3.51)0.91 Bidirectional mismatch1.04 (0.59–1.81)0.900.94 (0.48–1.83)0.850.66 (0.21–2.14)0.490.69 (0.20–2.45)0.57CMV antibody—no. (%) Both negative1111 Either positive1.67 (0.81–3.47)0.172.29 (0.91–5.76)0.082.07 (0.76–5.64)0.152.06 (0.48–8.73)0.33HCT-CI score—no. (%) 01111 ≥11.25 (0.83–1.88)0.281.37 (0.84–2.22)0.212.16 (0.97–4.79)0.061.75 (0.73–4.19)0.21ECOG PS—no. (%) 01111 ≥11.35 (0.90–2.03)0.141.90 (1.17–3.09)0.011.76 (0.99–3.15)0.061.82 (0.83–3.99)0.14Conditioning regimen intensity—no. (%) MAC1111 RIC1.38 (0.92–2.07)0.121.66 (1.02–2.70)0.041.14 (0.57–2.27)0.711.51 (0.69–3.29)0.30GVHD prophylaxis—no. (%) CNI + MTX111 Others1.01 (0.56–1.84)0.960.83 (0.38–1.81)0.640.75 (0.18–3.11)0.69Bold values indicate values with statistical significanceAML acute myeloid leukemia, BMT bone marrow transplantation, CB cord blood, CBT cord blood transplantation, CNI calcineurin inhibitor, DRI disease risk index, ECOG PS Eastern Cooperative Oncology Group Performance Status Scale, HCT-CI Hematopoietic Cell Transplantation-Comorbidity Index, MAC myeloablative conditioning, MMRD HLA-mismatched related donor, MMUD HLA-mismatched unrelated donor, MRD HLA-matched related donor, MTX methotrexate, MUD HLA-matched unrelated donor, PBSCT peripheral blood stem cell transplantation, RIC reduced intensity conditioning
Together, effusions observed following allo-HSCT are predominantly small, and their specific causes could not be determined in most cases. However, higher disease risk posed a risk to the development of effusions following allo-HSCT, suggesting effusions serve as proxies for severe primary disease status.
Discussion
In this study, we comprehensively analyzed CT-detected effusions in body cavities following allo-HSCT. We revealed that cavity effusions in the acute phase post-allo-HSCT are associated with adverse outcome even when most of them were small or with undermined etiology. Our findings build on the existing evidence of post-transplant fluid retention to propose that the number of effusion-positive cavities serves as proxy for survival.
In our retrospective analysis, most effusions occurred in the acute phase following allo-HSCT, with the median cumulative incidence of PL, PT, and PC effusions reaching 41.0%, 40.4%, and 20.8% at D100, respectively. The cumulative incidence of PL effusion was much higher than in the previous study, reporting 9.9% (95% CI, 7.7–12.5%) at 1 year [4]. The discrepancy would be explained by the definition of PL effusion; in that study, PL effusions were included in the analysis only when symptomatic, while in our study, all PL effusions detected on CT were included. Assessing whether PL effusion is symptomatic or not could be arbitrary, especially in a retrospective study. Therefore, we adopted CT-based judgment on the existence of effusions, in line with several other studies [5, 6, 8, 25], showing the incidence of PT and PC effusions 27% [6] and 20–26% [5, 8] in adult patients.
The unique aspect of our study was that effusions in three cavities were examined in the same cohort simultaneously, enabling the comparative and combinatory assessment of the incidence and outcome of effusions in each cavity. First, the incidence of PL and PT effusions was higher than PC effusion. Second, higher disease risk was associated with the development of PL and PT, but not of PC, in multivariate analysis. Third, although not mutually exclusive and thus denied direct comparison, PC effusions tended to be associated with a worse prognosis than PL or PT effusions, which showed similar prognostic impact. These findings suggest that PL and PT cavities might be more sensitive to fluid and disease burden than PC cavities. This might reflect the distinct pathophysiological basis among different body cavities or simply that PL and PT effusions could be more easily detected on CT than PC effusion. Another interesting observation was that the number of effusion-positive cavities showed an additive adverse effect on the transplantation outcome. This finding is an important confirmation that fluid retention is associated with worse survival. Inferior survival in these effusion-positive patients was attributed to increased NRM, particularly due to infection. This might partly be a consequence of higher proportion of patients who were administered steroids. Rondón et al. reported that fluid overload, defined by weight gain immediately following allo-HSCT, was associated with higher NRM and worse OS [26]. However, the immunological disturbance post-allo-HSCT adds complexity to a mere fluid overload in traditional intensive care unit settings [27]. In the allo-HSCT setting, the complex combinations of fluid overload, endothelial damage, and inflammatory conditions may all contribute to cavity effusions in a single patient. Indeed, the proportion of patients with engraftment syndrome, thrombotic microangiopathy, and bacterial infection was significantly higher in those with effusion(s) in our analysis. Our findings extend the current knowledge to propose that cavity effusion serves as a qualitative surrogate for these multifactorial conditions and as a quantitative proxy for survival.
Further, we showed that patients with higher disease risk were associated with increased risk for post-HSCT effusions. This is a stark contrast to patients with inborn errors of metabolisms undergoing allo-HSCT, who were at minimal risk for effusions. In patients with malignancy, increased vascular permeability and inflammatory status could contribute to the emergence of effusions [28]. Indeed, in our series, pre-transplant EASIX, a recently defined indicator of endothelial injury [22], was significantly higher in patients with higher disease risk. This might be attributable to older age at transplantation, more comorbidities, and history of intensive chemotherapies in a relatively shorter time from diagnosis, all of which were also observed in this subset of patients. Our results therefore indicate the emergence of post-transplant cavity effusions significantly relies on each patient’s background before allo-HSCT.
We acknowledge that our study harbors limitations inherent to a retrospective study. CT was conducted only upon some clinical suspicion of the patient’s status. Therefore, the true incidence and timing of effusions might have been underestimated. Indeed, CT examinations were more often performed in patients with effusion than in those without effusion in shorter period of observation period (9 CT scans in 430 days of observation period and 5 CT scans in 1413 days, respectively; all represented in median). CT scans were also conducted more frequently in patients with effusion by D100, compared to those without (median 4 and 2, respectively). Although it is possible that patients with cavity effusions were more closely monitored, but it is an equally reasonable postulation that cavity effusions were detected because of the intense monitoring. Precise documentation of the temporal emergence of cavity effusions would also guide the fluid and immunosuppressant management post-allo-HSCT. Furthermore, effusions arise from a variety of causes, each requiring different management. Effusion with undermined causes in our cohort therefore presents an important knowledge gap. A prospective study design with standardized time points of CT and inclusion of body weight and laboratory data would be necessary to further characterize the fluid dynamics following allo-HSCT.
In conclusion, we showed that fluid retention observed as effusions in body cavities is a frequent complication associated with inferior survival after allo-HSCT. The number of effusion-positive cavities showed an additive adverse effect on the transplantation outcome. We expect further studies to determine the fluid dynamics in post-transplantation setting.
Supplementary Information
Below is the link to the electronic supplementary material.Supplementary file1 (DOCX 17 KB)Supplementary file2 (DOCX 33 KB)Supplementary file3 (DOCX 18 KB)