Restrictive versus Liberal blood transfusion strategies for patients undergoing orthopedic surgery: a meta-analysis of randomised trials with trial sequential analysis
Zhou Zhou, Zefeng Xiao, Yan Luo, Tuanbiao Nie, Xuelian Xiao

TL;DR
This study compares restrictive and liberal blood transfusion strategies in orthopedic surgery patients, finding that restrictive transfusion increases cardiovascular risks but does not affect other adverse outcomes.
Contribution
The study provides a meta-analysis and trial sequential analysis to evaluate the effectiveness of blood transfusion strategies in orthopedic surgery.
Findings
Restrictive blood transfusion increases cardiovascular events, particularly myocardial infarction.
There is no significant difference in infection rates, thrombotic events, mortality, or delirium between transfusion strategies.
Restrictive transfusion is associated with shorter hospital stays and lower infection rates in joint replacement surgeries.
Abstract
A meta-analysis was conducted to explore the prognostic differences of restrictive blood transfusion (RBT) versus liberal blood transfusion (LBT) strategies in orthopedic patients. A comprehensive search was performed in PubMed, Embase, Cochrane Central Register of Controlled Trials, Embase, and clinicaltrials.gov up to 20 October 2024. The quality of included studies was assessed according to Cochrane risk of bias, and quality of evidence was assessed using the GRADE system. We performed sensitivity and publication bias analyses and used trial sequential analysis (TSA) to assess the risk of random error in the analysis results. 19 studies involving 7833 patients were included in the analysis. Compared with LBT, RBT reduced transfusion rate and increased the occurrence of cardiovascular events (RR = 1.44; 95% CI: 1.15–1.80, P = 0.001; I2 = 0%), mainly increased myocardial infarction…
Genes, proteins, chemicals, diseases, species, mutations and cell lines named across the full text — each resolved to its canonical identifier and authoritative record.
Click any figure to enlarge with its caption.
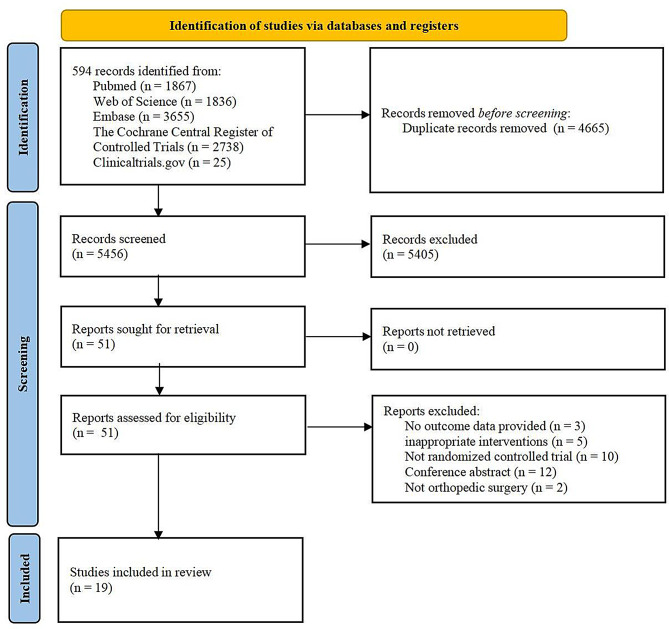 Figure 1
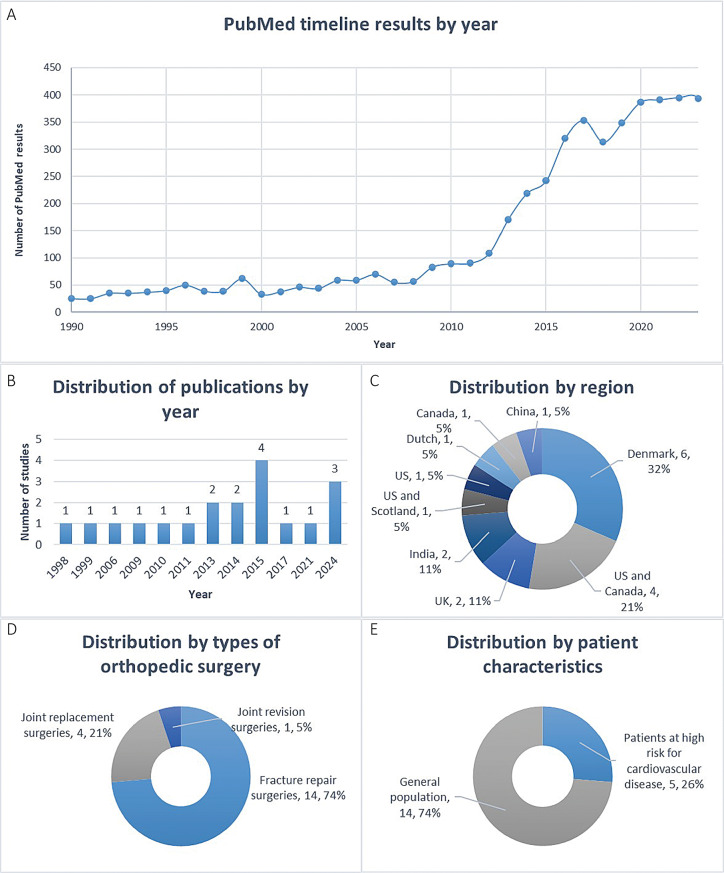 Figure 2
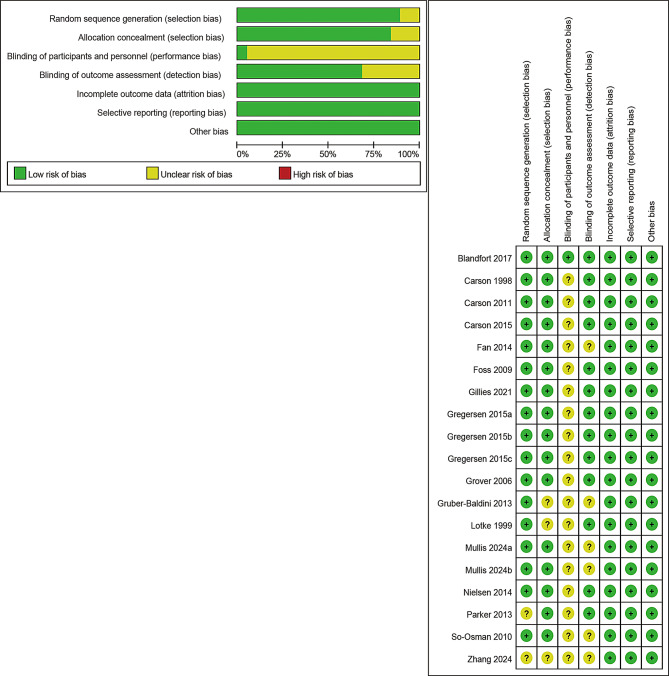 Figure 3
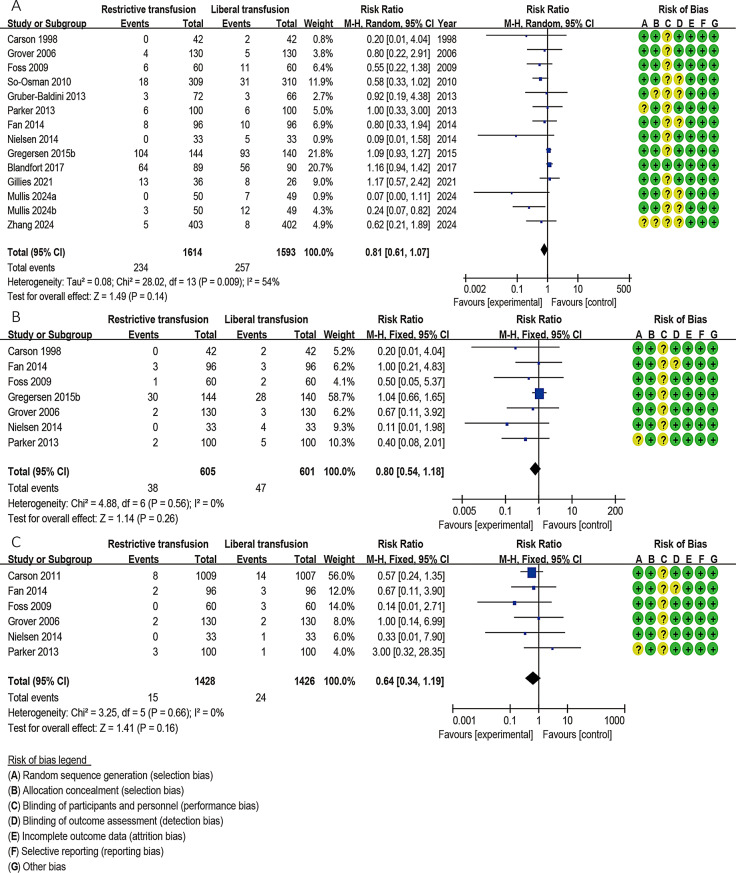 Figure 4
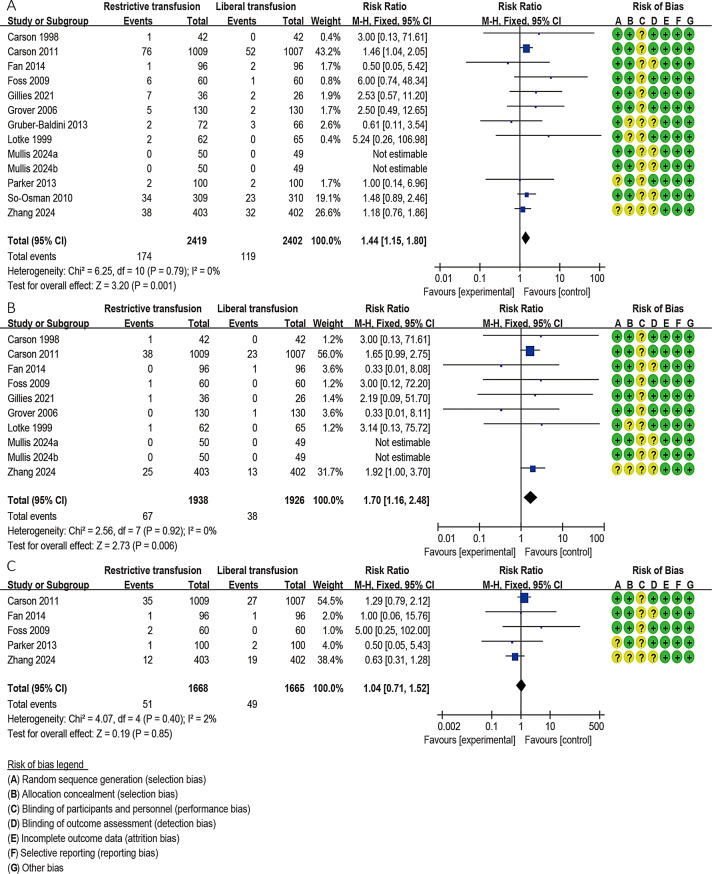 Figure 5
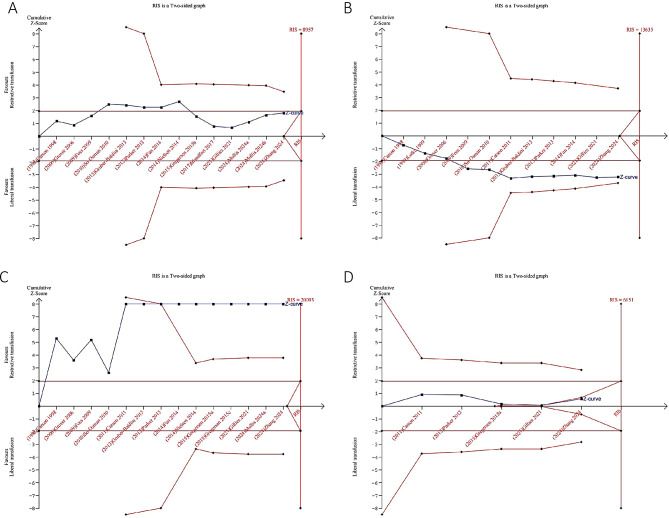 Figure 6
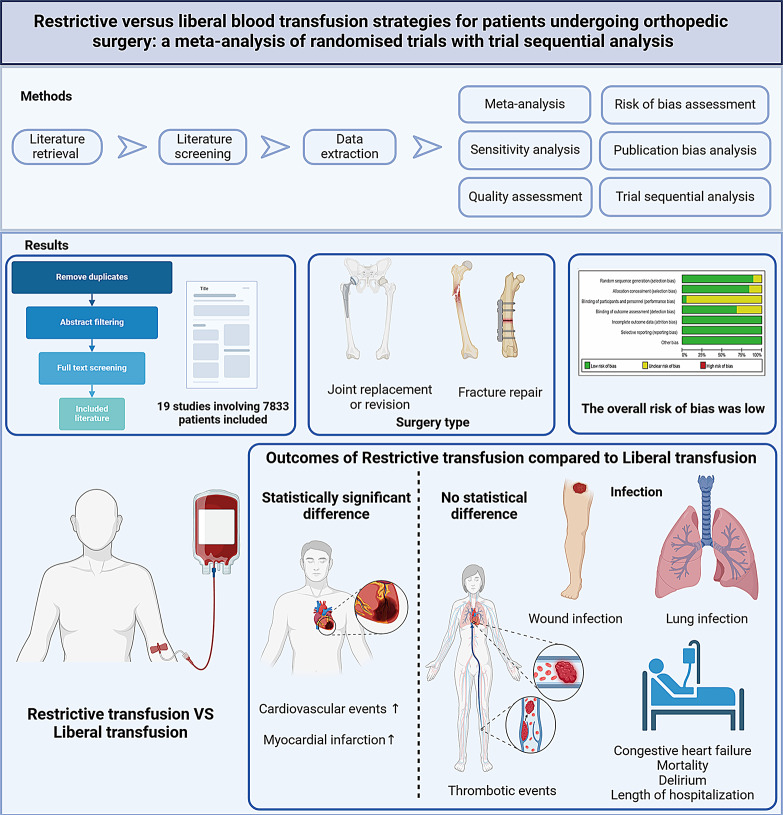 Figure 7
- —Hunan Provincial Health Commission Foundation
Peer Reviews
No public reviews on file for this paper yet. If you reviewed it on a platform where reviews are public (OpenReview, ICLR, NeurIPS, ICML), you can paste yours below so the community can read it here.
Videos
No videos yet. Explain this paper in a talk, walkthrough, or lecture? Add one.
Taxonomy
TopicsBlood transfusion and management · Venous Thromboembolism Diagnosis and Management · Trauma, Hemostasis, Coagulopathy, Resuscitation
Background
Red blood cell (RBC) transfusion is a common treatment used to rapidly enhance the oxygen-carrying capacity of the blood, with approximately 118 million units collected worldwide each year [1, 2]. Delayed blood transfusion can lead to ischemic tissue injuries in patients, thereby increasing mortality. Conversely, transfusion may also elevate the incidence of various adverse events and associated hospitalization costs [3]. Consequently, several published guidelines have discussed the appropriate threshold for RBC transfusion, generally recommending a restrictive threshold of 70–80 g/L [1, 4–8]. While RBT practices are primarily based on hemoglobin levels in most orthopedic surgeries, current blood transfusion strategies exhibit significant variability. The optimal approach to blood transfusion remains a subject of controversy, as there are no universally applicable standards, and transfusion-related adverse events still cannot be overlooked [9, 10]. Multiple systematic reviews and meta-analyses have evaluated the effectiveness of blood transfusion (RBT) (initiated mainly when hemoglobin level reach 8.0 g/dL or in cases of symptomatic anemia) versus liberal blood transfusion (LBT) (initiated mainly when hemoglobin level reach 10.0 g/dL) in orthopedic surgery patients [11–16]. However, results have been inconsistent and inconclusive across different patient features and clinical surgery types [11–16].
In recent years, several pertinent randomized controlled trials (RCTs) have been published [17–19], including a study by Quaranta et al. [20] showing that orthogeriatric multidisciplinary care in elderly hip fracture patients improved postoperative hemoglobin and reduced transfusions, especially after hemiarthroplasty and highlighting the need for comprehensive reviews and meta-analyses to elucidate the clinical outcomes associated with different transfusion strategies. This study aims to thoroughly evaluate the safety and prognostic differences between RBT and LBT practices in orthopedic patients. We conducted meta-analyses and subgroup analyses to identify patient characteristics and surgical approaches that may influence these prognostic differences. Notably, we employed trial sequential analysis (TSA) to assess both the adequacy and reliability of the accumulated published evidence, as well as to evaluate the heterogeneity of study results and the potential for publication bias.
Methods
Registration and protocol
This meta-analysis was based on the Cochrane Handbook, Preferred Reporting Items for Systematic Reviews and Meta-Analyses (PRISMA) guidelines [21] and assessment of multiple systematic reviews (AMSTAR) guidelines [22]. The protocol of this study has been prospectively registered and published in the PROSPERO, and there has been no deviation from the protocol.
Search strategy
PubMed, Web of Science, EMBASE, Cochrane Central Register of Controlled Trials and ClinicalTrials.gov (http://www.controlledtrials.com/) were searched up to 20 October 2024. We constructed search terms using appropriate combinations of the following combined search terms with MeSH terms and adjusted accordingly for different databases: (blood transfusion) AND (orthopedic surgery) AND (randomized controlled trials). Details of the search strategy are provided in the Supplementary materials.
Criteria for inclusion and exclusion
Inclusion criteria: [1] Randomized controlled trials; [2] Study participants were patients undergoing orthopedic surgery; [3] Study groups included at least a RBT group and a LBT group; [4] Studies reported at least one primary or secondary outcome of this meta-analysis.
Exclusion criteria: [1] Conference abstracts, cohort studies, meta-analyses, editorials, and reviews; [2] Duplicate publications; [3] No detailed extractable data reported; [5] Animal experiments.
Literature screen and data collection
After searching the literature, two authors independently screened the literature, first excluded duplicate literature, then read the abstracts to exclude irrelevant studies and finally reviewed the full text to determine the final included articles. Two authors then independently extracted data, including article characteristics and outcome data, from studies that met the inclusion criteria. When disagreements occurred, a third author joined the discussion to reach consensus.
Outcomes
Our primary outcomes were overall infection rates and cardiovascular event rates. For the overall infection, we considered all infections reported in the study. Cardiovascular events include myocardial infarction (MI), congestive heart failure (CHF) and arrhythmia (For relevant definitions, refer to the Supplementary Table 1. Secondary outcomes included lung infection, wound infection, MI, CHF, thromboembolic events, cerebrovascular accidents, overall mortality, transfusion rates, delirium and length of hospitalization. In the subgroup analysis, the definitions of patients at high risk for cardiovascular disease and ordinary patients are shown in the Supplementary Table 2.
Quality assessment and data synthesis and analysis
The risk of bias of included studies was assessed according to the Cochrane Collaboration tool. Following the GRADE manual, GRADEpro 3.6 was used to assess the quality of evidence for meta-analyses. Two authors independently assessed the risk of bias and quality of evidence, and in case of inconsistencies, a third author participated in a discussion to obtain the final results. Dichotomous variables and continuous variables were expressed as risk ratio (RR) and standard mean difference (SMD), respectively, with a confidence interval (CI) of 95%. I^2^ is a quantitative measure used to assess the degree of heterogeneity. I^2^ < 50% is considered to have insignificant heterogeneity, while I^2^ > 50% indicates that heterogeneity may be significant. I^2^ > 75% indicates high heterogeneity. When I^2^ < 50%, the fixed effects model is used for analysis; otherwise, the random effects model is used. Sensitivity analysis is used to evaluate the impact of each study on the final total effect. Publication bias was assessed using Egger’s test, and p < 0.05 was considered statistically significant. If p was ≥ 0.5 and there was sufficient data, the trim-and-fill method was used to adjust for this bias [23]. RevMan 5.4 software and Stata 14.0 software were used for analysis.
Trial sequential analysis
We performed TSA to assess whether the currently accumulated clinical data are sufficient to determine the conclusiveness of the results while assessing the risk of random error [24]. The relative risk reduction was predefined as 20%, the α value was set at 5%, the β value was set at 20% (80% power), and the control event rate was calculated based on the restricted RBC transfusion group. Based on the above information, we calculated the required information size (RIS) for each result using TSA Viewer 0.9 beta software.
Results
Literature retrieval and screening
The literature screening flow chart is shown in Fig. 1. After the database search, 10,121 potentially relevant publications were detected. Among them, 4665 duplicate documents were deleted. 5405 articles were excluded because they did not meet the title and abstract review. 32 articles were excluded due to ineligibility after reading the full text (see the supplementary materials for reasons of exclusion), and 19 studies were finally included in this meta-analysis [17–19, 25–40]. We also noticed that the search results of PubMed showed that the number of publications related to blood transfusion and orthopedic surgery has increased rapidly in recent years (Fig. 2A), indicating that it is currently a hot topic.
Fig. 1. Literature screening flow chart
Fig. 2. An overview of studies characteristics, including distribution of (A) PubMed timeline results by year (B) publications by year (C) region (D) types of orthopedic surgery (E) and patient characteristics
Study characteristics
Table 1 summarizes the characteristics of the included studies, and Table 2 summarizes the included participant characteristics and transfusion information. These 19 studies were conducted from 1998 to 2024 (Fig. 2B) and were carried out in the United States, Canada, Denmark, the United Kingdom, India and other places (Fig. 2C). The total number of patients was 7833, of which 3918 were in the RBT group and the rest were in the LBT group. Fourteen studies were fracture repair surgeries [17–19, 25, 28, 30–32, 35–40], four studies were joint replacement surgeries [26, 27, 29, 33], and one study was joint revision surgeries [34](Fig. 2D). Five studies included patients at high risk for cardiovascular disease [30–32, 35, 40], and the remainder were from the general population (Fig. 2E). In the included studies, hemoglobin thresholds ranged from 5.5 g/dl to 9.7 g/dl in the RBT group and from 7.0 g/dl to 10.0 g/dl in the LBT group. Of note, two study explored the relative safety of more conservative RBT (threshold 5.5 g/dL) versus more liberal LBT (threshold 7.0 g/dL) in asymptomatic orthopedic patients during the initial resuscitation period, which are extreme thresholds [18, 19]. Five studies used leukocyte-reduced blood components [27–30, 35]. The included trials all used perioperative blood transfusion, including before, during and after surgery.
Table 1. Characteristics of included studiesStudyRegionParticipants (n)Type of surgeryRestrictive blood transfusion strategiesLiberal blood transfusion strategiesFollow-upNumber of peopleTransfusion thresholdNumber of peopleTransfusion thresholdCarson 1998US and Scotland84Hip fracture repair42Hb < 8.0 g/dl or symptomatic anemia42Hb < 10.0 g/dlPostoperative 60 daysLotke 1999US152Total knee replacement62Hb < 9.0 g/dL65Beginning immediately after surgeryPostoperative 4 daysGrover 2006Southeast England260Total hip or knee replacement130Hb < 8.0 g/dl, maintenance range, 8.0–9.5 g/dl130Hb < 10.0 g/dl, mainte_x005f_x005f_x005f_x0002_nance range, 10.0–12.0 g/dlPostoperative 5 daysFoss 2009Denmark120Hip fracture repair60Hb < 8.0 g/dl60Hb < 10.0 g/dlPostoperative 3 daysSo-Osman 2010Dutch619Total hip or knee replacement309Threshold range,6.4–9.7 g/dl310Varied by hospital, age and condition of patients, symptoms and time14 days after surgery or at final dischargeCarson 2011US and Canada2016Hip fracture repair1009Symptomatic anemia or if Hb < 8.0 g/dL1007Hb < 10.0 g/dlPostoperative 60 daysCarson 2015US and Canada2016Hip fracture repair1009Symptomatic anemia or if Hb < 8.0 g/dL1007Hb < 10.0 g/dlMedian follow-up of 3 yearsZhang 2024US and Canada805Hip fracture repair403Symptomatic anemia or if Hb < 8.0 g/dL402Hb < 10.0 g/dlPostoperative 30 and 60 daysGruber-Baldini 2013US and Canada139Hip fracture repair72Symptoms or ≤ 8 g/dL66≤ 10 g/dLPostrandomization days 5Parker 2013Canada200Hip fracture repair1008.0–9.5 g/dl and symptomatic anemia1008.0–9.5 g/dlPostoperative 1 yearFan 2014China192Total hip replacement96Symptomatic anemia or Hb < 8.0 g/dl,96maintenance ≥ 10 g/dlPostoperative 7 daysNielsen 2014Denmark66Hip revision33Hb < 7.3 g/dL33Hb < 8.9 g/dLPostoperative 30 daysGregersen 2015aDenmark284Hip fracture repair144Hb < 9.7 g/dl140Hb < 11.3 g/dlPostoperative 90 daysGregersen 2015bDenmark284Hip fracture repair144Hb < 9.7 g/dl140Hb < 11.3 g/dlPostoperative 10 and 30 daysGregersen 2015cDenmark157Hip fracture repair80Hb < 9.7 g/dl77Hb < 11.3 g/dlPostoperative 30 days and 1 yearBlandfort 2017Denmark179Hip fracture repair89Hb < 9.7 g/dl90Hb < 11.3 g/dlPostoperative 10 daysGillies 2021UK62Neck of femur fracture repair36Hb ≤ 7.0 g/dl267.0–9.0 g/dlPostoperative 30 and 60 daysMullis 2024aIndia99Fracture repair50Hb < 5.5 g/dL49Hb < 7.0 g/dL2 weeks and 30 days after injuryMullis 2024bIndia99Fracture repair50Hb < 5.5 g/dL49Hb < 7.0 g/dL6 months and 1 yearAbbreviation: Hb: hemoglobin
Table 2. Characteristics and transfusion information of patients included in the studyStudyAgeNumber of males and females (M: F)Patient characteristicsRBCs (type/suspension/leucocyte reduced)Baseline HemoglobinRBC TransfusedTransfusion rate R F R F R F R F R FCarson 199883.3 ± 10.881.3 ± 8.19:3311:31Patients with primary hip fractureAllogen/NA/NA(9.1 ± 0.6) g/dl(9.1 ± 0.6) g/dl0 (Median) (IQR 0–2) units2 (median) (IQR 1–2)19 (45.2%)41 (97.6%)Lotke 199968.769.720:4220:45Total knee arthroplasty, osteoarthritis in 88% patientsAllogen/NA/NANANANANANANAGrover 200670.7 ± 7.171.5 ± 7.648:6155:45Elective total knee or hip arthroplastyAllogen/NA/leucocyte reduced(13.1 ± 1.22) g/dl(13.6 ± 1.22) g/dl0 (Median) (Range 0–5) units0 (Median) (Range 0–10) units37 (34%)46 (43%)Foss 200981 ± 7.381 ± 6.814:4614:46Patients with primary hip fractureAllogen/NA/leucocyte reducedNo available but graphedNo available but graphed1 (Median) (IQR 1–2) units2 (Median) (IQR 1–2) units22 (37%44 (74%)So-Osman 201070.7 ± 10.270.3 ± 9.784:215118:186Elective orthopaedic surgery patientsAllogen/NA/leucocyte reduced(13.7 ± 1.4) g/dl(13.7 ± 1.4) g/dl0.78 (Mean) ± 1.4 (SD)0.86 (Mean) ± 1.6 (SD)105 (35%)93 (31%)Carson 201181.5 ± 9.081.8 ± 8.8239:770250:757Hip fracture patients at high risk for cardiovascular diseaseNA/NA/leucocyte reduced(11.3 ± 1.5) g/dl(11.3 ± 1.5) g/dl0 (Median) (IQR 0–1) units2 (Median) (IQR 1–2) units413 (41%)970 (97%)Carson 201581.5 ± 9.081.8 ± 8.8239:770250:757Hip fracture patients at high risk for cardiovascular diseaseNA/NA/leucocyte reduced(11.3 ± 1.5) g/dl(11.3 ± 1.5) g/dl0 (Median) (IQR 0–1) units2 (Median) (IQR 1–2) units413 (41%)970 (97%)Zhang 202482.2 ± 8.282.4 ± 8.5120:283137:265Patients with coronary artery diseaseNA/NA/NA(11.2 ± 1.5) g/dl(11.3 ± 1.4) g/dl0 (Median) (IQR 0–1) units2 (Median) (IQR 1–2) units128 (31.8%)110 (27.4%)Gruber-Baldini 201380.6 ± 10.482.4 ± 7.425:4712:54Cardiovascular patients undergoing surgical hip fracture repairNA/NA/NA(11.9 ± 1.7) g/dl(11.9 ± 1.3) g/dl0 (Median) units2 (Median) units33(45.8%)63 (95.4%Parker 201384.284.415:8517:83Patients with primary hip fractureNA/NA/NA11.8 g/dl11.5 g/dlNo one received a blood transfusionAll patients received a blood transfusion with a mean of 1.9 units0 (0%)100 (100%)Fan 201475 ± 673 ± 730:6433:59Patients undergoing elective unilateral total hip replacementNA/NA/NA(12.0 ± 1.1) g/dl(11.8 ± 1.2) g/dlNANA41(43.6%)52 (56.5%)Nielsen 2014687216:1720:23Patients undergoing elective hip revision surgeryNA/NA/NA13.4 (10.2–15.0) g/dL13.8 (10.5–16.3) g/dLmedian with (5–95% range): 0 (0–245)median with (5–95% range): 0 (0–245)11 (33.3%)16 (48.4%)Gregersen 2015a85.7 ± 6.986.9 ± 9.836:10834:106Patients with hip fractureNA/NA/NA(10.4 ± 1.31) g/dl(10.3 ± 1.44) g/dl1 (IQR 1–2) units3 (IQR 2–5) units24 (16%)20 (14%)Gregersen 2015b85.7 ± 6.986.9 ± 9.836:10834:106Patients with hip fractureNA/NA/NA(10.4 ± 1.31) g/dl(10.3 ± 1.44) g/dl1 (IQR 1–2) units3 (IQR 2–5) units24 (16%)20 (14%)Gregersen 2015c85.5 ± 6.587.2 ± 7.318:6217:60Patients with hip fractureNA/NA/NA(11.3 ± 0.1) g/dl(12.3 ± 0.2) g/dl1.5 (IQR 1–2.5) units3 (IQR 2–4) units61 (76%)77 (100%)Blandfort 201786.5 ± 6.788.7 ± 6.322:6722:68Patients with hip fractureNA/NA/NANANANANANANAGillies 202182 ± 1182 ± 1110:268:16Patients with fractured neck of femurNA/NA/NA(12.0 ± 1.5) g/dl(11.5 ± 1.5) g/dlNANA24 (67%)24 (92%)Mullis 2024a35.53031:1933:16Patients with musculoskeletal traumaNA/NA/NANANANANA50 (100%)46 (93.8%)Mullis 2024b35.53031:1933:16Patients with musculoskeletal traumaNA/NA/NANANANANA50 (100%)46 (93.8%)R: restrictive blood transfution strategies; L: liberal blood transfution strategies; RBC: red blood cell; NA: not available; SD: standard deviation; IQR: inter-quartile range
Risk of bias in the eligible studies and quality of evidence
The risk of bias of the included studies is shown in Fig. 3. 17 articles provide explicit methods for randomized sequence generation [17–19, 25–31, 33–39]. 16 studies provided actual allocation concealment procedures [17–19, 25, 27–30, 32–39]. One article reported the actual blinding procedure [39]. All articles mentioned that the authors had no conflicts of interest. Although there are some unknown risks, the overall risk of bias in the included studies was low. The quality of the evidence was assessed according to the GRADE evidence profile (see Supplementary Materials). Among the analytical results of this study, the evidence level for 3 outcomes (pulmonary infection, wound infection, CHF) was judged to be high quality, the evidence quality for blood transfusion rate was low, and the evidence quality for the remaining outcomes was moderate. Common reasons for downgrading include publication bias and high heterogeneity. Overall, the level of evidence from this meta-analysis was moderate.
Fig. 3. Risk of bias summary
Results of meta-analysis
Infection
Fourteen studies including 3207 patients [17–19, 25, 27–29, 31–34, 38–40] reported overall infection. Pooled analysis with a random effects model showed that the association between transfusion strategy and infection was not statistically significant (RR = 0.81; 95% CI, 0.61–1.07, P = 0.14, I^2^ = 40%) (Fig. 4A). Of these studies, 7 studies [25, 27, 28, 32–34, 38] (including 1206 patients) and 6 studies [27, 28, 30, 32–34](including 2854 patients) reported lung infection and wound infection, respectively. Pooled analysis of fixed-effects models showed that transfusion strategy had no effect on lung infection (RR, 0.80; 95% CI, 0.54–1.18; P = 0.26) and wound infection (RR, 1.06; 95% CI, 0.64–1.19, P = 0.16) without heterogeneity (I^2^ = 0%) (Fig. 4B-C).
Fig. 4. Forest plots depicting the comparison between the restrictive blood transfusion (RBT) group and liberal blood transfusion (LBT) group: (A) Overall infection; (B) Lung infection; (C) Wound infection
Cardiovascular events
Thirteen studies involving 4821 patients reported cardiovascular events [17–19, 25–31, 33, 40]. The meta-analysis results of the fixed effects model showed that RBT can significantly increase cardiovascular events compared with the LBT group without heterogeneity (RR = 1.44; 95% CI: 1.15–1.80, P = 0.001; I^2^ = 0%) (Fig. 5A). Among these studies, 10 studies [17–19, 25–27, 30, 33, 40](including 4864 patients) and 5 studies [28, 30, 32, 33, 40](including 3333 patients) reported on MI and CHF, respectively. Pooled analysis of the fixed-effects model showed that compared with LBT, RBT increased the risk of MI (RR = 1.70; 95% CI: 1.16–2.48, P = 0.006; I^2^ = 0%), but had no statistical significance for CHF (RR = 1.04; 95% CI: 0.71–1.52, P = 0.85; I^2^ = 2%) (Fig. 5B-C).
Fig. 5. Forest plots depicting the comparison between the restrictive blood transfusion (RBT) group and liberal blood transfusion group: (A) Cardiovascular events; (B) Myocardial infarction; (C) Congestive heart failure
Thromboembolic events, cerebrovascular accidents, mortality, delirium, length of hospitalization, transfusion rates
Thromboembolic events (RR = 0.88; 95% CI: 0.33–2.31, P = 0.79; I^2^ = 0%), cerebrovascular accidents (RR = 0.50; 95% CI: 0.09–2.70, P = 0.42; I^2^ = 0%), mortality (≤ 30 days) (RR = 0.96; 95% CI: 0.87–1.06, P = 0.43; I^2^ = 14%), mortality (≥ 60 days) (RR = 0.94; 95% CI: 0.78–1.15, P = 0.57; I^2^ = 0%), delirium (RR = 1.33; 95% CI: 0.92–1.93, P = 0.13; I^2^ = 34%) and length of hospitalization (RR = -0.08; 95% CI: -0.22-0.06, P = 0.27; I^2^ = 57%) were not statistically different between the RBT and LBT groups (Supplementary Fig. 1–6). Analysis of data from 14 trials [17–19, 25, 27–34, 36, 37, 40]involving 5102 patients showed that transfusion rates in the RBT group were significantly lower than those in the LBT with high heterogeneity (RR = 0.70; 95% CI: 0.52–0.94, P = 0.02; I^2^ = 97%) (Supplementary Fig. 7).
RBT (Threshold 7 to 8 g/dL) VS LBT (Threshold 9 to 10 g/dL)
According to clinical practice, the RBT threshold is usually 7 to 8 g/dL and the LBT threshold is 9 to 10 g/dL [1], and the two threshold ranges overlapped in included studies. Therefore, we only included nine studies within this common threshold for additional meta-analysis [17, 25, 27, 28, 30, 31, 33, 35, 40], and the results were consistent with the above results without significant difference. (Supplementary Fig. 8–20).
Subgroup analysis results
Considering the characteristics of the included studies, the effect of transfusion strategy and the heterogeneity in the meta-analysis may be related to patient characteristics (patients at high risk for cardiovascular disease versus ordinary patients) and types of surgical procedures (total joint replacement or revision versus fracture repair). Therefore, we performed a subgroup analysis based on the above conditions and the results show that patient characteristics and types of surgical procedures do affect the meta-analysis results. The detailed results are shown in Table 3. Of note, in patients at high risk for cardiovascular disease, RBT increase the risk of MI and length of hospitalization compared with LBT. Additionally, for joint replacement or revision surgery, RBTs were associated with lower overall infections and shorter length of hospitalization compared with LBT groups. For fracture repair surgery, RBT increases the risk of MI.
Table 3. Subgroup analysis evaluating transfusion strategies in orthopedic patientsVariablesOutcomeSubgroupNumber of ExperimentsParticipantsStatistical MethodSMD [95% CI]/ RR [95% CI]P ValuePatient characteristics (patients at high risk for cardiovascular disease versus ordinary patients)Overall infection143207Risk Ratio (M-H, Random, 95% CI)0.82 [0.41, 1.64]0.14Patients at high risk for cardiovascular disease2943Risk Ratio (M-H, Random, 95% CI)0.71 [0.29, 1.75]0.46Ordinary patients122264Risk Ratio (M-H, Random, 95% CI)0.81 [0.61, 1.07]0.16Cardiovascular events134821Risk Ratio (M-H, Fixed, 95% CI)1.44 [1.15, 1.80]0.001Patients at high risk for cardiovascular disease32959Risk Ratio (M-H, Fixed, 95% CI)1.33 [1.02, 1.74]0.04Ordinary patients101862Risk Ratio (M-H, Fixed, 95% CI)1.74 [1.15, 2.63]0.008Myocardial infarction103864Risk Ratio (M-H, Fixed, 95% CI)1.70 [1.16, 2.48]0.006Patients at high risk for cardiovascular disease22821Risk Ratio (M-H, Fixed, 95% CI)1.75 [1.17, 2.61]0.007Ordinary patients81043Risk Ratio (M-H, Fixed, 95% CI)1.34 [0.43, 4.23]0.61Congestive heart failure53333Risk Ratio (M-H, Fixed, 95% CI)1.04 [0.71, 1.52]0.85Patients at high risk for cardiovascular disease22821Risk Ratio (M-H, Fixed, 95% CI)1.02 [0.68, 1.52]0.92Ordinary patients3512Risk Ratio (M-H, Fixed, 95% CI)1.29 [0.32, 5.15]0.72Overall mortality (≤ 30 days)116645Risk Ratio (M-H, Fixed, 95% CI)0.96 [0.87, 1.06]0.43Patients at high risk for cardiovascular disease22821Risk Ratio (M-H, Fixed, 95% CI)0.78 [0.57, 1.08]0.14Ordinary patients93824Risk Ratio (M-H, Fixed, 95% CI)0.99 [0.90, 1.10]0.88Overall mortality (≥ 60 days)53367Risk Ratio (M-H, Fixed, 95% CI)0.94 [0.78, 1.15]0.57Patients at high risk for cardiovascular disease22821Risk Ratio (M-H, Fixed, 95% CI)0.83 [0.64, 1.08]0.17Ordinary patients3546Risk Ratio (M-H, Fixed, 95% CI)1.16 [0.86, 1.56]0.34Transfusion rates145102Risk Ratio (M-H, Random, 95% CI)0.70 [0.52, 0.94]0.02Patients at high risk for cardiovascular disease32959Risk Ratio (M-H, Random, 95% CI)0.62 [0.33, 1.16]0.14Ordinary patients112143Risk Ratio (M-H, Random, 95% CI)0.78 [0.55, 0.99]0.04Length of hospitalization73296Std. Mean Difference (IV, Fixed, 95% CI)0.00 [-0.07, 0.07]0.96Patients at high risk for cardiovascular disease22154Std. Mean Difference (IV, Fixed, 95% CI)0.08 [-0.01, 0.16]0.07Ordinary patients51142Std. Mean Difference (IV, Fixed, 95% CI)-0.14 [-0.26, -0.03]0.02 Surgical procedures (total joint replacement or revision versus fracture repair) Overall infection143207Risk Ratio (M-H, Random, 95% CI)0.81 [0.61, 1.07]0.14Total joint replacement or revision41137Risk Ratio (M-H, Random, 95% CI)0.63 [0.40, 0.97]0.04Fracture repair102070Risk Ratio (M-H, Random, 95% CI)0.92 [0.70, 1.21]0.54Wound infection62854Risk Ratio (M-H, Fixed, 95% CI)0.64 [0.34, 1.19]0.16Total joint replacement or revision2258Risk Ratio (M-H, Fixed, 95% CI)0.56 [0.12, 2.56]0.45Fracture repair42596Risk Ratio (M-H, Fixed, 95% CI)0.66 [0.33, 1.30]0.23Lung infection71206Risk Ratio (M-H, Fixed, 95% CI)0.80 [0.54, 1.18]0.26Total joint replacement or revision2258Risk Ratio (M-H, Fixed, 95% CI)0.47 [0.13, 1.63]0.23Fracture repair5948Risk Ratio (M-H, Fixed, 95% CI)0.86 [0.57, 1.30]0.47Cardiovascular events134821Risk Ratio (M-H, Fixed, 95% CI)1.44 [1.15, 1.80]0.001Total joint replacement or revision31006Risk Ratio (M-H, Fixed, 95% CI)1.64 [1.02, 2.62]0.04Fracture repair103815Risk Ratio (M-H, Fixed, 95% CI)1.39 [1.08, 1.79]0.01Myocardial infarction103864Risk Ratio (M-H, Fixed, 95% CI)1.70 [1.16, 2.48]0.006Total joint replacement or revision3579Risk Ratio (M-H, Fixed, 95% CI)0.73 [0.15, 3.63]0.70Fracture repair73285Risk Ratio (M-H, Fixed, 95% CI)1.79 [1.21, 2.65]0.004Overall mortality (≤ 30 days)116645Risk Ratio (M-H, Fixed, 95% CI)0.96 [0.87, 1.06]0.43Total joint replacement or revision2879Risk Ratio (M-H, Fixed, 95% CI)0.43 [0.06, 2.89]0.39Fracture repair95766Risk Ratio (M-H, Fixed, 95% CI)0.96 [0.87, 1.06]0.47Transfusion rates145102Risk Ratio (M-H, Random, 95% CI)0.70 [0.52, 0.94]0.02Total joint replacement or revision41137Risk Ratio (M-H, Random, 95% CI)0.89 [0.70, 1.12]0.31Fracture repair103965Risk Ratio (M-H, Random, 95% CI)0.63 [0.43, 0.94]0.02Delirium5644Risk Ratio (M-H, Fixed, 95% CI)1.33 [0.92, 1.93]0.13Total joint replacement or revision2319Risk Ratio (M-H, Fixed, 95% CI)1.13 [0.69, 1.86]0.62Fracture repair3325Risk Ratio (M-H, Fixed, 95% CI)1.62 [0.92, 2.86]0.10Length of hospitalization73296Std. Mean Difference (IV, Fixed, 95% CI)0.00 [-0.07, 0.07]0.96Total joint replacement or revision3938Std. Mean Difference (IV, Fixed, 95% CI)-0.16 [-0.29, -0.03]0.01Fracture repair42358Std. Mean Difference (IV, Fixed, 95% CI)0.07 [-0.02, 0.15]0.11Abbreviation: RR, risk ratio; SMD, standardized mean difference
Sensitivity analysis and publication bias
The results of sensitivity analysis and publication bias are shown in Table 4. The results obtained by the sensitivity analysis were basically consistent with the results of all included studies, indicating that our results are stable (See Supplementary Fig. 21–24). However, only overall infection, lung infection and cerebrovascular accident did not show publication bias in Egger’s test (p < 0.05). The remaining results were analyzed using the trim and fill method (Supplementary Table 2). Wound infection, CHF, delirium, and length of hospitalization were not trimmed, and the data in the funnel plot remained unchanged, indicating that there was no significant publication bias for these outcomes.
Table 4. Sensitivity and publication bias analysisOutcomeSMD/RR fluctuation95% CI fluctuationPublication bias (P value)Pooling modelOverall infection0.69–0.890.47–1.150.001Random (I-V heterogeneity)Lung infection0.50–0.920.22–1.380.013Fixed Inverse VarianceWound infection0.57–0.780.29–2.120.96Fixed Inverse VarianceCardiovascular Events1.39–1.511.02–1.960.407Fixed Inverse VarianceMyocardial infarction1.61–1.801.00-3.220.652Fixed Inverse VarianceCongestive heart failure0.70–1.280.37–1.570.981Fixed Inverse VarianceThromboembolic Events0.76–1.180.22–3.790.518Fixed Inverse VarianceCerebrovascular Accidents0.33–0.630.04–5.020.019Fixed Inverse VarianceMortality (≤ 30 days)0.94-1.000.76–1.30.31Fixed Inverse VarianceMortality (≥ 60 days)0.87–1.020.70–1.310.574Fixed Inverse VarianceTransfusion rates0.67–0.730.51–0.970.883Random (I-V heterogeneity)Delirium1.05–1.800.67–3.10.758Fixed Inverse VarianceLength of hospitalization(-0.13)-(0.00)(-0.26)-(0.09)0.085Random (I-V heterogeneity)Abbreviation: RR, risk ratio; SMD, standardized mean difference
Trial sequential analysis
TSA can assess whether the cumulative effect of studies included in a meta-analysis is supported by sufficient data. TSA results indicate that there is sufficient data to draw definite conclusions about the impact of transfusion strategies on transfusion rates and overall mortality (≥ 60 days). However, the evidence for efficacy for the remaining outcomes analyzed (including infection, cardiovascular events, thromboembolic events, cerebrovascular accidents, mortality, delirium, length of hospitalization) was inconclusive. In other words, the currently accumulated number of clinical trial participants is too small, which may lead to insufficient conclusions in this meta-analysis. Therefore, more high-quality clinical trials with large populations can be conducted in the future to further verify these conclusions (Fig. 6 and Supplementary Fig. 25).
Fig. 6. Trial sequential analysis. A required information size was calculated based on using α = 0.05 (two-sided), β = 0.20 (power 80%), and an anticipated relative risk reduction (RRR) of 20%. (A) Overall infection; (B) Cardiovascular events; (C) Transfusion rates; (D) Mortality (≥ 60 days)
Discussion
Principal findings
This meta-analysis included 19 studies involving a total of 7833 patients. The risk of bias in the included studies was low, and the overall analysis results were of moderate quality of evidence. The results show that compared with the LBT strategy, the RBT strategy can increase the occurrence of cardiovascular events, which mainly increases MI rather than CHF. In addition, the blood transfusion rate in the RBT group was higher than that in the LBT group, but there was no difference in the impact of RBT strategies and LBT strategies on infection, thromboembolic events, cerebrovascular accidents, delirium, length of hospitalization and mortality. The results of the subgroup analysis showed that whether the patient was at risk for cardiovascular disease and the type of surgery were important factors affecting the adverse reactions of the blood transfusion strategy. The TSA results showed that except for the results of transfusion rates and overall mortality (≥ 60 days), which were supported by sufficient evidence, the other results were inconclusive due to the small sample size.
Blood transfusions are associated with numerous complications, such as transfusion-related lung injury, cardiac overload, immune responses, and infectious diseases [41–43]. Blood transfusions have been shown to be strongly associated with recurrent thrombosis and death in patients with acute coronary syndrome and/or MI [44, 45]. In the clinical studies we included, we found that most of the patients undergoing orthopedic surgery are elderly and cannot tolerate a hypoxic environment. Excessive blood transfusion or excessive fluid delivery can easily lead to fluid circulation overload and increase the burden on the heart. These may increase the probability of adverse transfusion reactions.
Transfusion-associated circulatory overload (TACO) is the most common pulmonary complication of transfusion and the leading cause of transfusion-related death [1]. Among our included studies, one study reported one case of TACO in the restricted group [17], and another reported five cases of TACO (but the transfusion method was unknown [29].
Comparison with existing literature
In 2015, Brunskill et al. [11] conducted a meta-analysis to evaluate the benefits and harms of RBC transfusion strategies in patients undergoing hip fracture surgery. They included six trials (2722 participants) that showed a reduced risk of MI but no difference in thromboembolism, wound infection, CHF and mortality in LBT groups compared with RBT groups, which were also consistent with our findings. Wang et al. [16] and Mitchell et al. [14] reported no statistically significant relationship between blood transfusion strategy and infections in orthopedic patients, but Teng’s study found that a RBT strategy could significantly reduce infections [15]. Mao et al. [13] found that the blood transfusion strategy did not affect the incidence of MI. These differences may be due to the small number of included studies and the different effect models used. Different from previously published meta-analyses on the same topic, our article systematically screened and updated the literature and included more RCTs. The most recent meta that has been published so far was searched in July 2019, and only studied the relationship between blood transfusion and infection rates [16]. Most existing studies have only searched for hip and knee surgeries. We searched for all orthopedic-related surgeries and also studied the relationship between transfusion strategies and various outcome measures. We also analyzed the relationship between different subgroups. Therefore, our research is a necessary update and improvement of previous research.
Strengths of this meta-analysis
First, this article is a comprehensive updated meta-analysis. It conducted a comprehensive and detailed literature search and screening, included a larger number of studies and participants, and covered studies published from 1998 to 2024 (4/19 of them were published in the last 3 years). Second, the low heterogeneity of the meta-analysis, the good consistency of the sensitivity analysis, the low risk of bias and the moderate quality of evidence all suggest that our analysis results are stable and reliable. Third, compared with the recently published meta-analysis on the same topic, we updated RCTs in the past 5 years and included multiple outcomes such as cardiovascular events, thromboembolic events, mortality, delirium, length of hospitalization, etc. This has important implications for updating the latest research results and comprehensively comparing the impact of transfusion strategies on orthopedic patients. Fourth, we used TSA to evaluate the adequacy of the results, which has not been used in previously published articles on the same topic. Fifth, the studies included in this article are of higher quality evidence from RCTs, and compared with cross-sectional studies and cohort studies, some confounding factors have been controlled.
Limitations
Our study has several limitations. Since the existing RCTs do not provide detailed individual patient data and blood transfusion conditions, we are unable to analyze the impact of blood transfusion strategies on different factors such as patient age, underlying diseases, gender, and disease type. The amount, type, suspension, and leucocyte information of RBCs used for transfusion were not clearly reported, and these differences in transfusion strategies may also be a source of part of the heterogeneity. Egger test and trim-and-fill analysis showed that some outcomes had a certain publication bias, which may be related to the small number of RCTs reporting this outcome. In addition, the blood transfusion process may be accompanied by the use of some drugs or interventions to reduce blood loss, RBC requirements and infection rates, such as perioperative iron and erythropoietin supplementation, which our article did not consider.
Implications for clinical practice and research
Our analysis found that RBT reduce transfusion rates but may increase the risk of cardiovascular events (mainly MI), especially in patients at high risk for cardiovascular disease. Furthermore, RBT have varying effects in different orthopedic surgeries. Therefore, we need to be cautious about blood transfusions in clinical practice, and comprehensively consider patient characteristics and surgery types when making decisions. TACO and transfusion-related acute lung injury (TRALI), the main cause of death among blood transfusion associated complications, refer to acute respiratory distress syndrome occurring within 6 h after blood transfusion [1]. These two are the dominant factors in weighing the risks of transfusion, but they are rarely reported in the included studies and deserve attention in future studies. In the future, we also hope that more research will be done to analyze the mechanism of adverse reactions caused by blood transfusion strategies in order to come up with countermeasures.
Conclusion
This meta-analysis compared the effects of blood transfusion strategies in orthopedic patients using outcome measures such as infection, cardiovascular events, cerebrovascular accidents, and mortality. The overall results indicate that the RBT strategy increases the risk of cardiovascular events (mainly MI) and reduces transfusion rates, but has no statistically significant effect on other outcome measures. The patient’s cardiovascular disease risk and type of surgery also influence the outcome of the transfusion strategy. Potential differences between RBT and LBT strategies remain to be explored in larger, higher-quality clinical trials.
Electronic supplementary material
Below is the link to the electronic supplementary material.
Supplementary Material 1
The reference list from the paper itself. Each links out to its DOI / PubMed record.
- 1Mueller MM, Van Remoortel H, Meybohm P, Aranko K, Aubron C, Burger R et al. Patient Blood Management: Recommendations From the 2018 Frankfurt Consensus Conference. JAMA. 2019;321(10):983– 97.10.1001/jama.2019.055430860564 · doi ↗ · pubmed ↗
- 2Nielsen K, Johansson PI, Dahl B, Wagner M, Frausing B, Børglum J et al. Perioperative transfusion threshold and ambulation after hip revision surgery - a randomized trial. BMC Anesthesiol. 2014;14(1).10.1186/1471-2253-14-89PMC 420391325337035 · doi ↗ · pubmed ↗
- 3Zhang J, Chen Z, He Y. Comparison of Liberal versus restrictive transfusion strategies after hip surgery in patients with coronary artery disease: a post hoc analysis of the FOCUS trial. BMC Cardiovasc Disord. 2024;24(1).10.1186/s 12872-024-04151-z PMC 1140976139294606 · doi ↗ · pubmed ↗