Correction: Hospital factors and metastatic surgery in colorectal cancer patients, a population-based cohort study
Malin Ljunggren, Caroline E. Dietrich, Emma Rosander, Gabriella Palmer, Bengt Glimelius, Anna Martling, Caroline Nordenvall

Abstract
Genes, proteins, chemicals, diseases, species, mutations and cell lines named across the full text — each resolved to its canonical identifier and authoritative record.
Click any figure to enlarge with its caption.
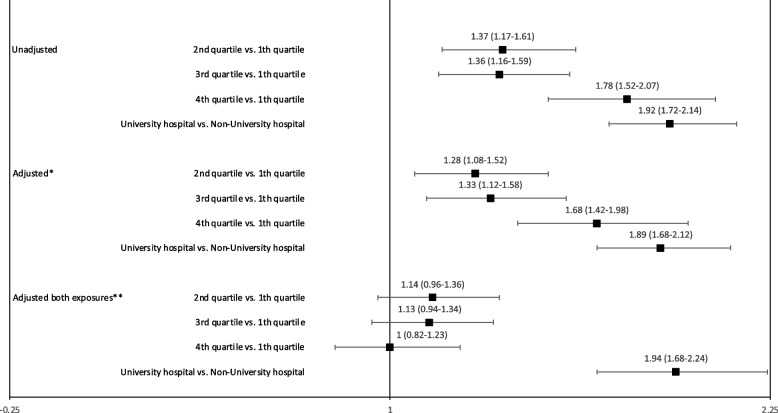 Figure 1
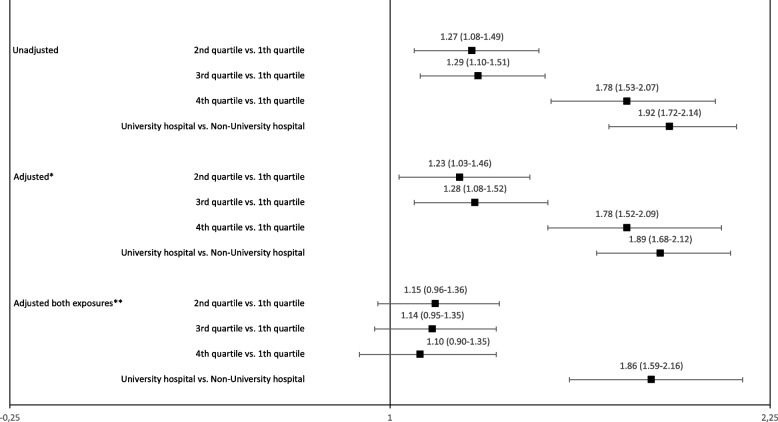 Figure 2
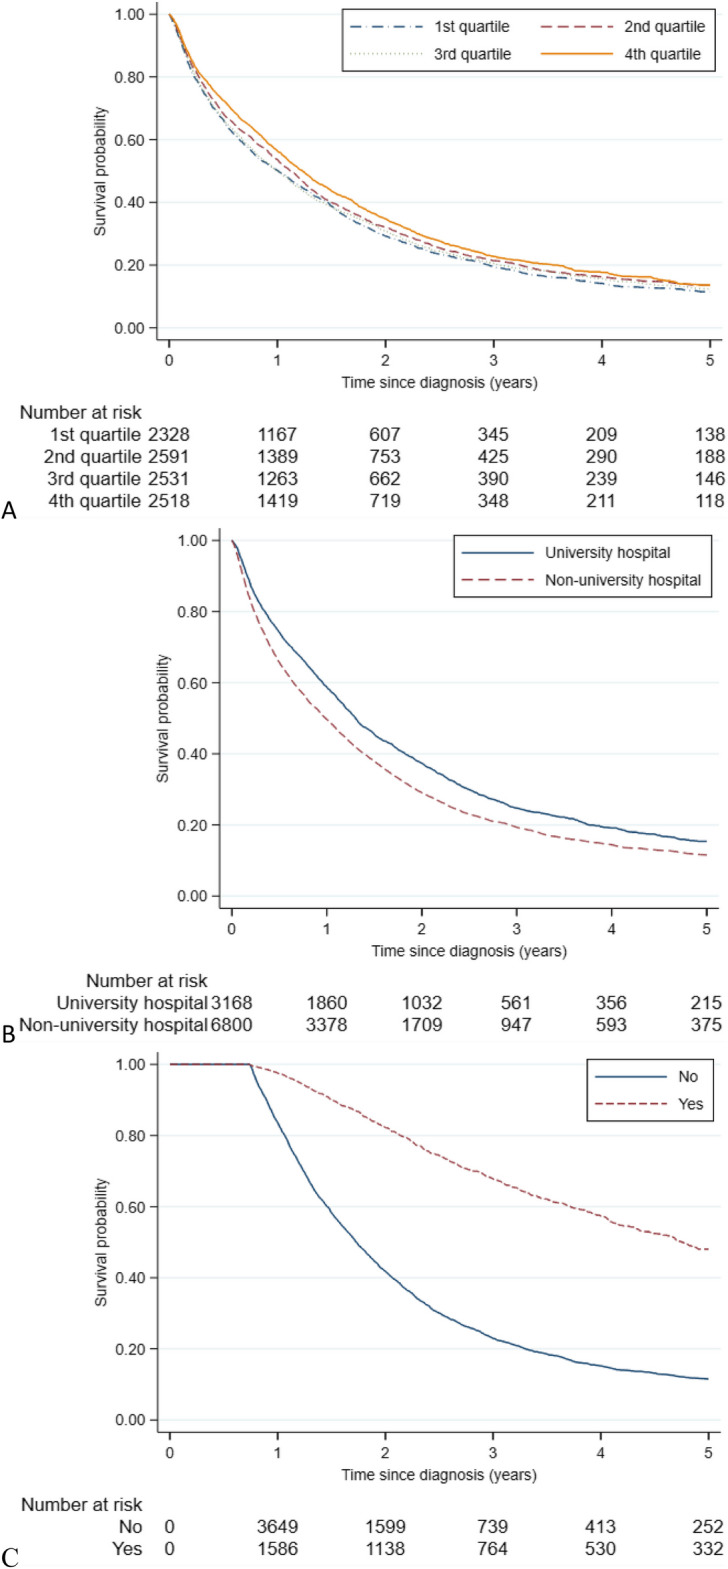 Figure 3
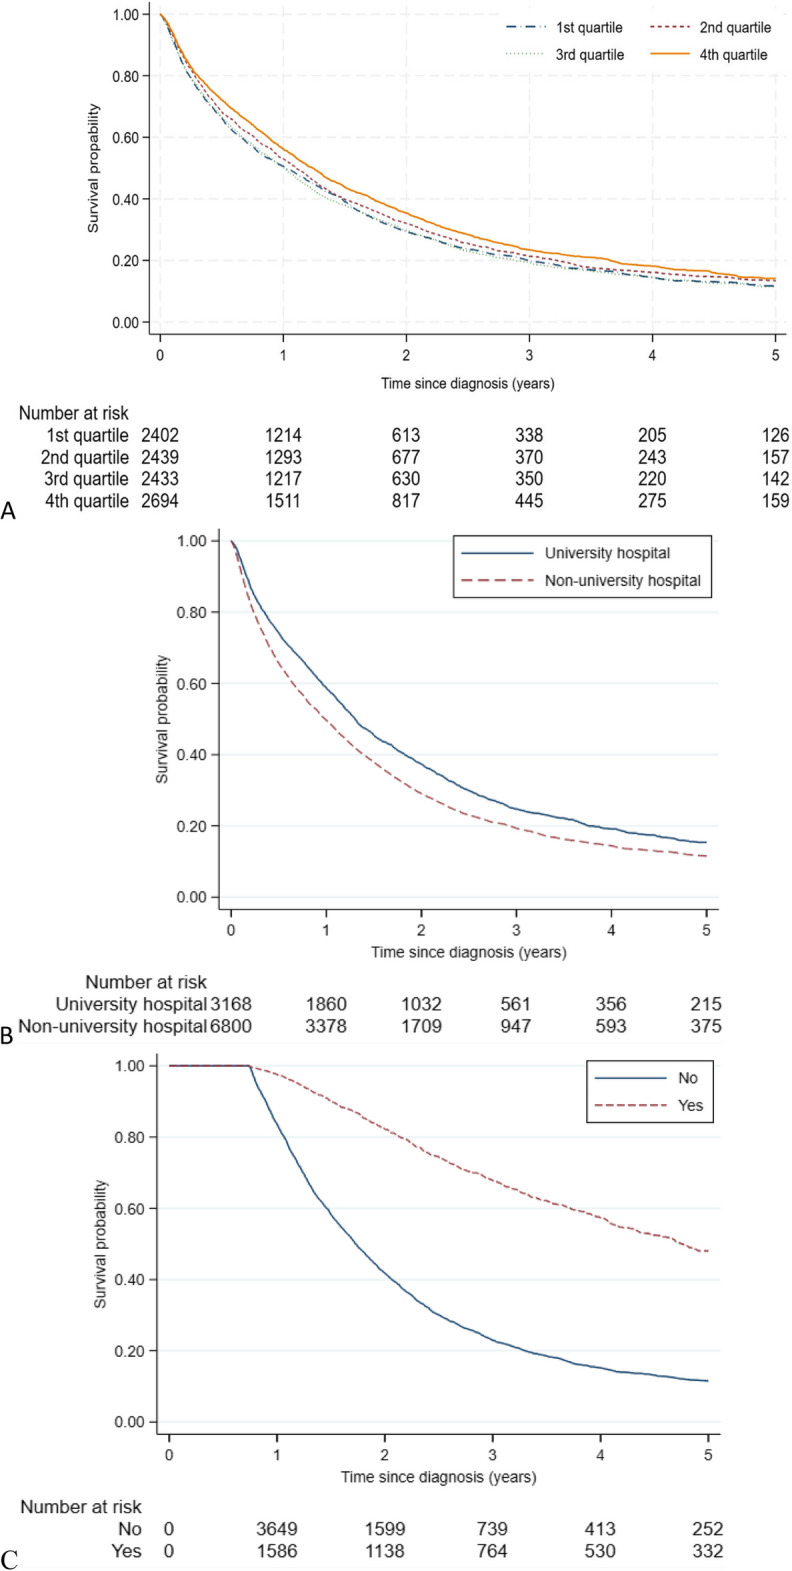 Figure 4
Peer Reviews
No public reviews on file for this paper yet. If you reviewed it on a platform where reviews are public (OpenReview, ICLR, NeurIPS, ICML), you can paste yours below so the community can read it here.
Videos
No videos yet. Explain this paper in a talk, walkthrough, or lecture? Add one.
Taxonomy
TopicsColorectal Cancer Treatments and Studies · Ferroptosis and cancer prognosis · Gastric Cancer Management and Outcomes
Correction: BMC Cancer 22, 907 (2022)
https://doi.org/10.1186/s12885-022–10005-8
Following publication of the original article [1], the authors identified an error in the original code to calculate the hospital volume quartiles. The error led to the effect that the quartiles were calculated based on the distribution of annual hospital volumes across the study period instead of calculations year by year. This led to ubiquitous but very slight changes throughout the manuscript. The effect size of the main results is essentially unchanged, and the statistical significance of the results is, thus, untouched. Two changes are noted. Firstly, the annual volumes of incident mCRC patients at hospitals in the 1st, 2nd, 3rd, and 4th quartiles now overlap with 1–26, 18–37, 28–53, 39–103 patients per year, respectively (previously 1–20, 21–31,32–46, 47–103). Secondly, in the patient characteristics table (Table 1) the annual hospital volume quartiles had significantly different proportions regarding the variable “year of diagnosis” (2009–2012/ 2013–2016). The p-value indicate that the proportion changed from statistically significantly different to non-significantly (p = 0.248) different. The affected Tables (Table 1, Table 2, Table 3), Figures (Fig. 3, Fig. 4) and Supplementary material (Supplementary Table 2 and Supplementary Table 3) were remade and all updated with the correct numbers per quartile, correct odds ratios or hazard ratios and confidence intervals. The authors regret their mistake.
Incorrect Fig. 3 is given below.Fig. 3. Forest plot of annual hospital volume, hospital level and the chance of receiving metastatic surgery
Correct Fig. 3 is given below.Fig. 3. Forest plot of annual hospital volume, hospital level and the chance of receiving metastatic surgery
Incorrect Fig. 4 is given below.Fig. 4. Cumulative overall survival (OS) estimates by A) hospital volume, B) hospital level, C) metastatic surgery. Kaplan-Meier estimates of OS including 9,968 patients followed from diagnosis of synchronous metastatic colorectal cancer. The stratification by metastatic surgery was based on a delayed entry of patients in model to 270 days post diagnosis (n=5,993). P-value from log-rank test was p=0.001 for A and p<0.001 for B and C
Correct Fig. 4 is given below.Fig. 4. Cumulative overall survival (OS) estimates by A) hospital volume, B) hospital level, C) metastatic surgery. Kaplan-Meier estimates of OS including 9,968 patients followed from diagnosis of synchronous metastatic colorectal cancer. The stratification by metastatic surgery was based on a delayed entry of patients in model to 270 days post diagnosis (n=5,993). P-values from log-rank test were p<0.001 for A, B and C
The incorrect Table 1 is given below.Table 1. Patient characteristics according to annual hospital volume of patients with metastatic colorectal cancerFirst quartilen = 2,328Second quartilen = 2,591Third quartilen = 2,531Fourth quartilen = 2,518Alln = 9,968P-valueSexMale1,325 (57%)1,455 (56%)1,386 (55%)1,400 (56%)5,566 (56%)0.466Female1,003 (43%)1,136 (44%)1,145 (45%)1,118 (44%)4,402 (44%)AgeMedian (years)717071697018–64 years631 (27%)784 (30%)757 (30%)889 (35%)3,061 (31%) < 0.00165–79 years1,182 (51%)1,265 (49%)1,221 (48%)1,169 (46%)4,837 (49%) ≥ 80 years515 (22%)542 (21%)553 (22%)460 (18%)2,070 (21%)Charlson comorbidity index01,469 (63%)1,600 (62%)1,523 (60%)1,543 (61%)6,135 (62%)0.3781229 (10%)287 (11%)290 (11%)264 (10%)1,070 (11%) ≥ 2630 (27%)704 (27%)718 (28%)711 (28%)2,763 (28%)Year of diagnosis2009–20121,228 (55%)1,359 (52%)1,198 (47%)980 (39%)4,825 (48%) < 0.0012013–20161,040 (45%)1,232 (48%)1,333 (53%)1,538 (61%)5,143 (52%)Civil status **Married/registered partner1,258 (54%)1,416 (55%)1,329 (53%)1,309 (52%)4,654 (47%)0.348Not married: never married, divorced, widowed1,070 (46%)1,175 (45%)1,201 (47%)1,208 (48%)5,312 (53%)Missing0 (0%)0 (0%)1 (0%)1 (0%)2 (0%)Highest level of commenced education Primary school (maximum 9 years)909 (39%)1,011 (39%)965 (38%)775 (31%)3,660 (37%) < 0.001Secondary school(3–4 additional years)945 (41%)1,011 (39%)993 (39%)1,039 (41%)3,988 (40%)Higher education459 (20%)531 (20%)550 (22%)680 (27%)2,220 (22%)Missing14 (1%)38 (1%)24 (1%)24 (1%)100 (1%)Disposable income per family unit divided into annual quartiles. 1st quartile676 (29%)653 (25%)624 (25%)543 (22%)2,496 (25%) < 0.0012nd quartile609 (26%)646 (25%)648 (26%)584 (23%)2,487 (25%)3rd quartile569 (24%)685 (26%)633 (25%)605 (24%)2,492 (25%)4th quartile474 (20%)607 (23%)625 (25%)785 (31%)2,491 (25%)Missing0 (0%)0 (0%)1 (0%)1 (0%)2 (0%)Includes 9,968 patients diagnosed with metastatic colorectal cancer in 2009–2016 in SwedenFrom chi square testYear of/up to 3 years before if missingYear before diagnosis or up to 3 years before or year of if missing
The correct Table 1 is given below.Table 1. Patient characteristics according to annual hospital volume of patients with metastatic colorectal cancerFirst quartilen = 2,402Second quartilen = 2,439Third quartilen = 2,433Fourth quartilen = 2,694Alln = 9,968P-valueSexMale1,352 (56%)1,377 (56%)1,347 (55%)1,490 (55%)5,566 (56%)0.776Female1,050 (44%)1,062 (44%)1,086 (45%)1,204 (45%)4,402 (44%)AgeMedian (years)717071697018–64 years646 (27%)738 (30%)719 (30%)958 (36%)3,061 (31%) < 0.00165–79 years1,221 (51%)1,180 (48%)1,178 (48%)1,258 (47%)4,837 (49%) ≥ 80 years535 (22%)521 (21%)536 (22%)478 (18%)2,070 (21%)Charlson comorbidity index01,507 (63%)1,517(62%)1,454 (60%)1,657 (62%)6,135 (62%)0.1571238 (10%)266 (11%)292 (12%)274 (10%)1,070 (11%) ≥ 2657 (27%)656 (27%)687 (28%)763 (28%)2,763 (28%)Year of diagnosis2009–20121,157 (48%)1,173 (48%)1,219 (50%)1276(47%)4,825 (48%)0.2482013–20161,245 (52%)1,266 (52%)1,214 (50%)1,418 (53%)5,143 (52%)Civil status **Married/registered partner1,304 (54%)1,320 (54%)1,275 (52%)1,413 (52%)4,654 (47%)0.545Not married: never married, divorced, widowed1,098 (46%)1,119 (46%)1,157 (48%)1,280 (48%)5,312 (53%)Missing0 (0%)0 (0%)1 (0%)1 (0%)2 (0%)Highest level of commenced education Primary school (maximum 9 years)921 (38%)960 (39%)940 (39%)839 (31%)3,660 (37%) < 0.001Secondary school(3–4 additional years)979 (41%)958 (39%)959 (39%)1,092 (41%)3,988 (40%)Higher education487 (20%)490 (20%)502 (21%)741 (28%)2,220 (22%)Missing15 (1%)31 (1%)32 (1%)22 (1%)100 (1%)Disposable income per family unit divided into annual quartiles. 1st quartile677 (28%)590 (24%)616 (25%)613 (22%)2,496 (25%) < 0.0012nd quartile635 (26%)629 (26%)602 (25%)621 (23%)2,487 (25%)3rd quartile579 (24%)654 (27%)603 (25%)656 (24%)2,492 (25%)4th quartile511 (21%)566 (23%)611 (25%)803 (30%)2,491 (25%)Missing0 (0%)0 (0%)1 (0%)1 (0%)2 (0%)Includes 9,968 patients diagnosed with metastatic colorectal cancer in 2009–2016 in SwedenFrom chi square testYear of/up to 3 years before if missingYear before diagnosis or up to 3 years before or year of if missing
The incorrect Table 2 is given below.Table 2. Hospital and tumour characteristics according to annual hospital volume of patients with metastatic colorectal cancerFirst quartilen = 2,328Second quartilen = 2,591Third quartilen = 2,531Fourth quartilen = 2,518All n = 9,968P-valueHospital levelUniversity79 (3%)492 (19%)669 (26%)1,928 (77%)3,168 (32%) < 0.001Non-university2,249 (97%)2,099 (81%)1,862 (74%)590 (23%)6,800 (68%)Hospital region1221 (9%)370 (14%)635 (25%)741 (29%)1,967 (20%) < 0.0012505 (22%)608 (23%)869 (34%)273 (11%)2,255 (23%)3370 (16%)449 (17%)231 (9%)0 (0%)1,050 (11%)4390 (17%)459 (18%)407 (16%)763 (30%)2,019 (20%)5390 (17%)401 (15%)288 (11%)741 (29%)1,820 (18%)6452 (19%)304 (12%)101 (4%)0 (0%)857 (9%)Primary tumour locationRight colon615 (26%)637 (25%)643 (25%)676 (27%)2,568 (26%) < 0.001Transverse colon314 (13%)292 (11%)316 (12%)306 (12%)1,227 (12%)Left colon743 (32%)761 (29%)732 (29%)673 (27%)2,912 (29%)Unknown location in colon21 (1%)19 (1%)9 (0%)19 (1%)68 (1%)Rectum625 (27%)882 (34%)831 (33%)844 (34%)3,193 (32%)Pretherapeutic multidisciplinary team conferenceYes1,507 (65%)1,967 (76%)1,950 (77%)2,011 (80%)7,435 (75%) < 0.001No812 (35%)621 (24%)570 (23%)498 (20%)2,510 (25%)Missing8 (0%)3 (0%)3 (0%)9 (0%)23 (0%)Resection of primary tumourNo1,128 (48%)1,349 (52%)1,397 (55%)1,322 (53%)5,196 (52%) < 0.001Yes1,199 (52%)1,242 (48%)1,135 (45%)1,196 (47%)4,772 (48%)cT1–3659 (28%)959 (37%)824 (33%)824 (34%)3,264 (33%) < 0.0014564 (24%)757 (29%)735 (29%)795 (32%)2,849 (29%)X619 (27%)485 (19%)500 (20%)611 (24%)2,218 (22%)Missing486 (21%)290 (15%)472 (19%)288 (11%)1,637 (16%)cN0450 (19%)531 (20%)413 (16%)401 (16%)1,795 (18%) < 0.0011–21,099 (47%)1,434 (55%)1,521 (60%)1,362 (54%)5,414 (54%)X660 (28%)543 (21%)540 (21%)702 (28%)2,447 (25%)Missing119 (5%)83 (3%)57 (2%)53 (2%)312 (3%)Metastatic locationLiver744 (32%)913 (35%)908 (36%)805 (32%)3,370 (34%) < 0.001Lung205 (9%)176 (7%)170 (7%)128 (5%)679 (7%)Peritoneum62 (3%)70 (3%)85 (3%)111 (4%)328 (3%)Other73 (3%)93 (4%)83 (3%)105 (4%)354 (4%)Multiple locations1,244 (53%)1,339 (52%)1,285 (51%)1,369 (54%)5,237 (53%)Includes 9,968 patients diagnosed with metastatic colorectal cancer in 2009–2016 in SwedenFrom chi square testAbbreviations: cN clinical nodal status, CT clinical tumour status
The correct Table 2 is given below Table 2. Hospital and tumour characteristics according to annual hospital volume of patients with metastatic colorectal cancerFirst quartilen = 2,402Second quartilen = 2,439Third quartilen = 2,433Fourth quartilen = 2,694All n = 9,968P-valueHospital levelUniversity105 (4%)356 (15%)537 22%)2,170 81%)3,168 (32%) < 0.001Non-university2,297 (96%)2,083 (85%)1,896 (78%)524 (19%)6,800 (68%)Hospital region1221 (9%)281 (12%)592 (24%)873 (32%)1,967 (20%) < 0.0012453 (19%)706 (29%)762 (31%)334 (12%)2,255 (23%)3373 (16%)489 (20%)101 (4%)87(3%)1,050 (11%)4395 (16%)368 (15%)543 (22%)713 (26%)2,019 (20%)5439 (18%)357 (15%)337 (14%)687 (26%)1,820 (18%)6439 (18%)238 (10%)98 (4%)0 (0%)857 (9%)Primary tumour locationRight colon647 (27%)577 (24%)630 (26%)717 (27%)2,568 (26%) < 0.001Transverse colon314 (13%)274 (11%)317 (13%)323 (12%)1,227 (12%)Left colon770 (32%)711 (29%)705 (29%)723 (27%)2,912 (29%)Unknown location in colon21 (1%)19 (1%)9 (0%)19 (1%)68 (1%)Rectum650 (27%)858 (35%)772 (32%)912 (34%)3,193 (32%)Pretherapeutic multidisciplinary team conferenceYes1,607 (67%)1,852 (76%)1,859 (76%)2,117 (79%)7,435 (75%) < 0.001No787 (33%)584 (24%)572 (24%)567 (21%)2,510 (25%)Missing8 (0%)3 (0%)2 (0%)10(0%)23 (0%)Resection of primary tumourNo1,174 (48%)1,297 (53%)1,360 (56%)1,365 (51%)5,196 (52%) < 0.001Yes1,228 (51%)1,142 (47%)1,073 (44%)1,329 (49%)4,772 (48%)cT1–3696 (29%)912 (37%)812 (33%)846 (34%)3,266 (33%) < 0.0014598 (25%)713 (29%)721 (30%)819 (31%)2,851 (29%)X637 (27%)445 (18%)481 (20%)652 (24%)2,218 (22%)Missing471 (20%)369 (15%)419 (17%)377 (14%)1,637 (16%)cN0475 (20%)469 (19%)447 (18%)404 (15%)1,795 (18%) < 0.0011–21,170 (49%)1,372 (56%)1,433 (59%)1,441 (53%)5,414 (54%)X641 (27%)520 (21%)502 (21%)782 (29%)2,447 (25%)Missing116 (5%)78 (3%)51 (2%)67 (2%)312 (3%)Metastatic locationLiver772 (32%)826 (34%)879 (36%)893 (33%)3,370 (34%) < 0.001Lung210 (9%)177 (7%)159 (7%)133 (5%)679 (7%)Peritoneum68 (3%)55 (2%)86 (4%)119 (4%)328 (3%)Other77 (3%)91 (4%)72 (3%)114 (4%)354 (4%)Multiple locations1,275 (53%)1,290 (53%)1,237 (51%)1,435 (53%)5,237 (53%)Includes 9,968 patients diagnosed with metastatic colorectal cancer in 2009–2016 in SwedenFrom chi square testAbbreviations: cN clinical nodal status, CT clinical tumour status
The incorrect Table 3 is given below Table 3. Cox regression model estimates of all-cause mortality hazard ratios (HRs) with 95% confidence intervals (CIs)Univariable****First model.^1^Second model.^2^HR* (95% CI)HR* (95% CI)HR* (95% CI)Hospital mCRC case load1^st^ quartile1112^nd^ quartile**0.93 (0.87–0.99)**1.01 (0.95–1.07)1.04 (0.98–1.11)3^rd^ quartile0.97 (0.92–1.04)1.02 (0.96–1.09)**1.07 (1.00–1.14)4^th^ quartile0.87 (0.82–0.93)****0.92 (0.86–0.98)1.06 (0.98–1.14)Hospital levelNon-university111University0.81 (0.78–0.85)****0.85 (0.81–0.89)***0.83 (0.78–0.88)**Model includes 9,968 patients with synchronous colorectal cancer metastasesAdjusted for time since diagnosis^1^One exposure (hospital volume/ hospital level) and adjusted for sex (male, female), age (categorized: 18–64,65–79, ≥ 80 years), Charlson comorbidity index (0,1, ≥ 2), Primary tumour location (right colon, transverse colon, left colon, colon unknown location in colon, rectum), cT (1–3, 4, X) cN, (0, 1–2, X), metastases (single, multiple), civil status (married, not married), education (primary, secondary, higher education), annual income (quartiles), year of diagnosis. Missing data handled using missing indicator method^2^Model of both exposures, adjusted as above
The correct Table 3 is given below.Table 3. Cox regression model estimates of all-cause mortality hazard ratios (HRs) with 95% confidence intervals (CIs)**Univariable*First model ^1^Second model^2^HR (95% CI)HR (95% CI)HR (95% CI)Hospital mCRC case load1^st^ quartile1112^nd^ quartile0.94 (0.88–1.00)**1.00 (0.94–1.07)1.02 (0.96–1.09)3^rd^ quartile1.00 (0.95–1.07)1.06 (0.99–1.12)**1.09 (1.02–1.16)4^th^ quartile0.87 (0.82–0.93)****0.90 (0.85–0.96)1.04 (0.96–1.12)Hospital levelNon-university111University0.81 (0.78–0.85)****0.85 (0.81–0.89)***0.84 (0.79–0.89)**Model includes 9,968 patients with synchronous colorectal cancer metastasesAdjusted for time since diagnosis^1^One exposure (hospital volume/ hospital level) and adjusted for sex (male, female), age (categorized: 18–64,65–79, ≥ 80 years), Charlson comorbidity index (0,1, ≥ 2), Primary tumour location (right colon, transverse colon, left colon, colon unknown location in colon, rectum), cT (1–3, 4, X) cN, (0, 1–2, X), metastases (single, multiple), civil status (married, not married), education (primary, secondary, higher education), annual income (quartiles), year of diagnosis. Missing data handled using missing indicator method^2^Model of both exposures, adjusted as above
The incorrect Supplementary Table 2 is given below.
Supplementary Table 2. Additional treatment-associated patient characteristics for 9,968 patients with synchronous metastatic colorectal cancer (mCRC) according to the managing hospitals’ annual incident number of patients with mCRC divided into 4 quartiles. 1st quartilen = 2,3282nd quartilen = 2,5913rd quartilen = 2,5314th quartilen = 2,518All n = 9,968P-valueASA class1159 (7%)148 (6%)165 (7%)117 (5%)589 (6%) < 0.0012622 (27%)668 (26%)607 (24%)619 (25%)2,516 (25%)3386 (17%)386 (15%)395 (16%)493 (20%)1,660 (17%)4–559 (3%)30 (1%)51 (2%)61 (2%)201 (2%)Missing1,102 (47%)1,359 (52%)1,313 (52%)1,228 (49%)5,002 (50%)Neoadjuvant treatment for metastatic colon cancerNo1,476 (87%)1 431 (84%)1 457 (86%)1 303 (78%)5,667 (84%) < 0.001Yes200 (12%)266 (16%)233 (14%)254 (15%)952 (14%)Missing17 (1%)12 (1%)10 (1%)117 (7%)156 (2%)Neoadjuvant treatment for metastatic rectal cancerNo387 (61%)458 (52%)453 (55%)411 (49%)411 (49%) < 0.001Chemotherapy77 (12%)76 (9%)69 (8%)45 (5%)267 (8%)Radiotherapy63 (10%)119 (14%)107 (13%)96 (11%)385 (12%)Combination95 (15%)220 (25%)194 (23%)240 (28%)750 (23%)Missing13 (2%)9 (1%)8 (1%)52 (6%)82 (3%)pT (if resected)1–3630 (53%)672 (54%)606 (53%)502 (42%)2,410 (51%) < 0.0014452 (38%)425 (34%)397 (35%)539 (45%)1,813 (38%)X/Missing117 (10%)145 (12%)132 (12%)155 (13%)549 (12%)pN (if resected)0234 (20%)249 (20%)268 (24%)242 (20%)993 (21%)0.0031334 (28%)382 (31%)332 (29%)383 (32%)1,431 (30%)2507 (42%)462 (37%)404 (36%)414 (35%)1,787 (37%)X/missing124 (10%)149 (12%)131 (12%)157 (13%)561 (12%)Surgery of metastases (with or without primary tumour resection)Liver263 (11%)412 (16%)375 (15%)366 (15%)1,416 (14%) < 0.001Lung23 (1%)29 (1%)34 (1%)42 (2%)128 (1%)Peritoneal30 (1%)17 (1%)28 (1%)125 (5%)200 (2%)Combination9 (0%)10 (0%)9 (0%)25 (1%)53 (1%)No2,002 (86%)2,123 (82%)2,086 (82%)1,960 (78%)8,171 (82%)*Data unspecified on whether the neoadjuvant treatment was given for the primary tumour or the metastases or bothA total of 46 patients who underwent surgery for liver metastases (of which one had combination metastatic surgery) received solely non-surgical locally ablative therapy (percutaneous destruction or embolisation treatment) and four patients with lung metastases had solely non-surgical treatment (stereotactic body radiation, SBRT). The solely non-surgical locally ablative treatments constituted 3% (n = 50/1797) of the patients treated with metastatic surgeryAbbreviations: ASA (American Society of Anaesthesiologists), pN (pathological nodal status), pT (pathological tumour status).
The correct Supplementary Table 2 is given below.
Supplementary Table 2. Additional treatment-associated patient characteristics for 9,968 patients with synchronous metastatic colorectal cancer (mCRC) according to the managing hospitals’ annual incident number of patients with mCRC divided into 4 quartiles. 1st quartilen = 2,4022nd quartilen = 2,4393rd quartilen = 2,4334th quartilen = 2,694All n = 9,968P-valueASA class1153 (6%)135 (6%)156 (6%)145 (5%)589 (6%) < 0.0012627 (26%)624 (26%)584 (24%)681 (25%)2,516 (25%)3398 (17%)349 (14%)375 (15%)538 (20%)1,660 (17%)4–554 (2%)33 (1%)45 (2%)69 (3%)201 (2%)Missing1,179 (49%)1,359 (52%)1,273 (52%)1,228 (49%)5,002 (50%)Neoadjuvant treatment for metastatic colon cancerNo1,476 (87%)1 431 (84%)1 457 (86%)1 303 (78%)5,667 (84%) < 0.001Yes200 (12%)266 (16%)233 (14%)254 (15%)952 (14%)Missing17 (1%)12 (1%)10 (1%)117 (7%)156 (2%)Neoadjuvant treatment for metastatic rectal cancerNo400 (62%)445 (52%)448 (58%)416 (46%)1709 (54%) < 0.001Chemotherapy76 (12%)67 (8%)62 (8%)62 (7%)267 (8%)Radiotherapy61 (9%)115 (13%)93 (12%)116 (13%)385 (12%)Combination103 (16%)220 (26%)160 (21%)266 (29%)749 (23%)Missing10 (2%)11 (1%)9 (1%)52 (6%)82 (3%)pT (if resected)1–3641 (52%)638 (56%)544 (51%)588 (44%)2,411 (51%) < 0.0014458 (37%)365 (32%)413 (38%)576 (43%)1,812 (38%)X/Missing129 (11%)139 (12%)116 (11%)165 (12%)549 (12%)pN (if resected)0234 (19%)240 (21%)240 (22%)282 (21%)996 (21%)0.1411358 (29%)341 (30%)309 (29%)421 (32%)1,429 (30%)2501 (41%)420 (37%)404 (38%)461 (35%)1,786 (37%)X/missing135 (11%)141 (12%)120 (11%)165 (12%)561 (12%)Surgery of metastases (with or without primary tumour resection)Liver273 (11%)377 (15%)348 (14%)418 (16%)1,416 (14%) < 0.001Lung24 (1%)28 (1%)39 (2%)37 (1%)128 (1%)Peritoneal31 (1%)17 (1%)25 (1%)127 (5%)200 (2%)Combination10 (0%)7 (0%)10 (0%)26 (1%)53 (1%)No2,064 (86%)2,010 (82%)2,011 (83%)2,086 (77%)8,171 (82%)*Data unspecified on whether the neoadjuvant treatment was given for the primary tumour or the metastases or bothA total of 46 patients who underwent surgery for liver metastases (of which one had combination metastatic surgery) received solely non-surgical locally ablative therapy (percutaneous destruction or embolisation treatment) and four patients with lung metastases had solely non-surgical treatment (stereotactic body radiation, SBRT). The solely non-surgical locally ablative treatments constituted 3% (n = 50/1797) of the patients treated with metastatic surgeryAbbreviations: ASA (American Society of Anaesthesiologists), pN (pathological nodal status), pT (pathological tumour status)
The incorrect Supplementary Table 3 is given below.
Supplementary Table 3. Summary table of results. AnalysisOutcomeExposureResultsMultivariable logistic regression adjustedMetastatic surgeryHospital volume in quartiles (qts)2nd qt vs 1st qtOR (95% CI): **1.28 (1.08–1.52)3rd qt vs 1st qtOR (95% CI): 1.33 (1.12–1.58)4th qt vs 1st qtOR (95% CI): 1.68 (1.42–1.98)**Multivariable logistic regression adjustedMetastatic surgeryHospital levelUniversity vs non-universityOR (95% CI): **1.89 (1.68–2.12)Multivariable logistic regression adjusted for both exposuresMetastatic surgeryHospital volume in quartiles (qts) Hospital level2nd qt vs 1st qtOR (95% CI): 1.14 (0.96–1.36)3rd qt vs 1st qtOR (95% CI): 1.13(0.94–1.34)4th qt vs 1st qtOR (95% CI): 1 (0.82–1.23)University vs non-universityOR (95% CI): 1.94 (1.68–2.24)InteractionHospital volume and hospital levelWald test p < 0.001Multivariable logistic regression adjusted for both exposures and mediator MDTMetastatic surgeryHospital volume in quartiles (qts) Hospital level mediator MDT2nd qt vs 1st qtOR (95% CI): 1.13 (0.95–1.34)3rd qt vs 1st qtOR (95% CI): 1.10 (0.92–1.32)4th qt vs 1st qtOR (95% CI): 1 (0.81–1.22)University vs non-universityOR (95% CI): 1.90 (1.64–2.19)Yes vs noOR (95% CI): 1.54 (1.30–1.82)**InteractionMDT and hospital levelWald test p < 0.001Multivariable Cox regression model adjustedAll-cause mortalityHospital volume in qts2nd qt vs 1st qtHR (95% CI): 1.01 (0.95–1.07)3rd qt vs 1st qtHR (95% CI): 1.02 (0.96–1.09)4th qt vs 1st qtHR (95% CI): **0.92 (0.86–0.98)**Multivariable Cox regression model adjustedAll-cause mortalityHospital levelUniversity vs non-universityHR (95% CI): **0.85 (0.81–0.89)**Multivariable Cox regression model adjusted for both exposuresAll-cause mortalityHospital volume in quartiles (qts) Hospital level2nd qt vs 1st qtHR (95% CI): 1.04 (0.98–1.11)3rd qt vs 1st qtHR (95% CI): **1.07 (1.00–1.14)**4th qt vs 1st qtHR (95% CI): 1.06 (0.98–1.14)University vs non-universityHR (95% CI): **0.83 (0.78- 0.88)**All multivariable models were adjusted for sex (male, female), age (18–64,65–79, ≥ 80 years), Charlson comorbidity index (0,1, ≥ 2), Primary tumour location (right colon, transverse colon, left colon, colon unknown location in colon, rectum), cT-stage (1–3, 4, X), cN-stage (0, 1–2, X), metastases (single, multiple), civil status (married, not married), education (primary, secondary, higher education), income (4 annual quartiles), diagnosis year (continuous 2009–2016). Missing data handled using missing indicator method. Multivariable logistic regression models included 9,966 patients. Multivariable cox regression models included 9,968 patientsAbbreviations: CI: confidence interval, HR: hazard ratio, MDT: multidisciplinary team conference, OR: odds ratio, qt: quartile
The correct Supplementary Table 3 is given below.
Supplementary Table 3. Summary table of results. AnalysisOutcomeExposureResultsMultivariable logistic regression adjusted Metastatic surgeryHospital volume in quartiles (qts)2nd qt vs 1st qtOR (95% CI): **1.23 (1.03–1.46)**3rd qt vs 1st qtOR (95% CI): **1.28 (1.08–1.52)**4th qt vs 1st qtOR (95% CI): **1.78 (1.52–2.09)**Multivariable logistic regression adjustedMetastatic surgeryHospital levelUniversity vs non-universityOR (95% CI): **1.89 (1.68–2.12)**Multivariable logistic regression adjusted for both exposuresMetastatic surgeryHospital volume in quartiles (qts) Hospital level2nd qt vs 1st qtOR (95% CI): 1.15 (0.96–1.36)3rd qt vs 1st qtOR (95% CI): 1.14(0.95–1.35)4th qt vs 1st qtOR (95% CI): 1.10 (0.90–1.35)University vs non-universityOR (95% CI): **1.86 (1.59–2.16)**InteractionHospital volume and hospital levelWald test p < 0.001Multivariable logistic regression adjusted for both exposures and mediator MDTMetastatic surgeryHospital volume in quartiles (qts) Hospital level mediator MDT2nd qt vs 1st qtOR (95% CI): 1.13 (0.95–1.34)3rd qt vs 1st qtOR (95% CI): 1.12 (0.94–1.33)4th qt vs 1st qtOR (95% CI): 1.09 (0.89–1.33)University vs non-universityOR (95% CI): **1.82 (1.56–2.12)Yes vs noOR (95% CI): 1.54 (1.30–1.82)**InteractionMDT and hospital levelWald test p < 0.001Multivariable Cox regression model adjustedAll-cause mortalityHospital volume in qts2nd qt vs 1st qtHR (95% CI): 1.00 (0.94–1.07)3rd qt vs 1st qtHR (95% CI): 1.06 (0.99–1.12)4th qt vs 1st qtHR (95% CI): **0.90 (0.85–0.96)**Multivariable Cox regression model adjustedAll-cause mortalityHospital levelUniversity vs non-universityHR (95% CI): **0.85 (0.81–0.89)**Multivariable Cox regression model adjusted for both exposuresAll-cause mortalityHospital volume in quartiles (qts) Hospital level2nd qt vs 1st qtHR (95% CI): 1.02 (0.96–1.09)3rd qt vs 1st qtHR (95% CI): **1.09 (1.02–1.16)**4th qt vs 1st qtHR (95% CI): 1.04 (0.96–1.12)University vs non-universityHR (95% CI): **0.84 (0.79- 0.89)**All multivariable models were adjusted for sex (male, female), age (18–64,65–79, ≥ 80 years), Charlson comorbidity index (0,1, ≥ 2), Primary tumour location (right colon, transverse colon, left colon, colon unknown location in colon, rectum), cT-stage (1–3, 4, X), cN-stage (0, 1–2, X), metastases (single, multiple), civil status (married, not married), education (primary, secondary, higher education), income (4 annual quartiles), diagnosis year (continuous 2009–2016). Missing data handled using missing indicator method. Multivariable logistic regression models included 9,966 patients. Multivariable cox regression models included 9,968 patientsAbbreviations: CI: confidence interval, HR: hazard ratio, MDT: multidisciplinary team conference, OR: odds ratio, qt: quartile