Bidirectional predictors between baseline and recovery sleep measures and cardiovascular measures during sleep deprivation and psychological stress
Lauren N. Pasetes, Kathleen M. Rosendahl‐Garcia, Namni Goel

TL;DR
This study shows how baseline sleep patterns predict cardiovascular responses during sleep deprivation and stress, and how these responses affect recovery sleep.
Contribution
The study is the first to investigate bidirectional predictors between baseline sleep and cardiovascular measures during sleep deprivation and psychological stress.
Findings
Higher baseline sleep efficiency predicted lower stroke volume and higher vascular resistance during sleep deprivation and stress.
Cardiovascular indices during sleep deprivation explained up to 24.9% of recovery sleep variance.
Females showed significant bidirectional relationships between baseline sleep and cardiovascular measures.
Abstract
For the first time, we investigated bidirectional predictors between baseline and recovery sleep and cardiovascular (CV) measures during total sleep deprivation (TSD) and psychological stress in a five‐day experiment with 32 healthy adults (27‐53y; 14 females). CV measures were collected in the morning after two baseline nights (B1, B2) and during TSD morning (TSD AM) and evening following psychological stress (TSD PM). Actigraphy assessed sleep during B2 before TSD and the first recovery night (R1) after TSD. Higher B2 wake after sleep onset (WASO) predicted lower TSD PM stroke volume and higher TSD PM systemic vascular resistance index (SVRI), with greater B2 percent sleep predicting inverse relationships, explaining 12.8%–15.9% of the TSD CV variance. Also, higher B2 WASO predicted higher B2 AM SVRI. Furthermore, longer TSD left ventricular ejection time predicted later R1 sleep…
Genes, proteins, chemicals, diseases, species, mutations and cell lines named across the full text — each resolved to its canonical identifier and authoritative record.
Click any figure to enlarge with its caption.
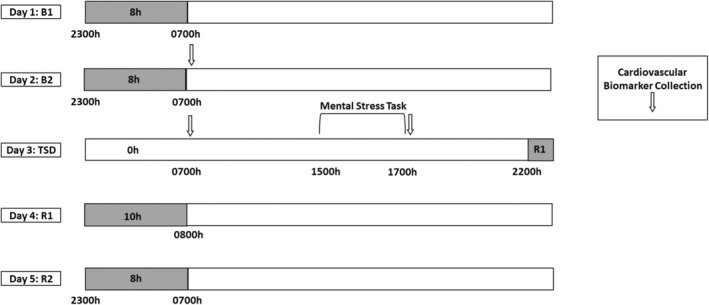 FIGURE 1
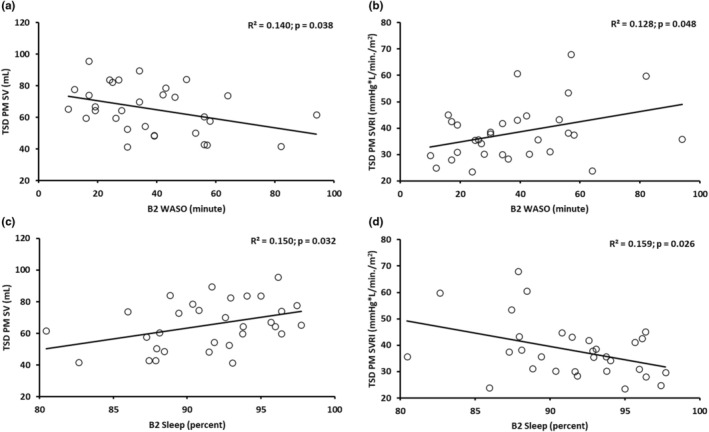 FIGURE 2
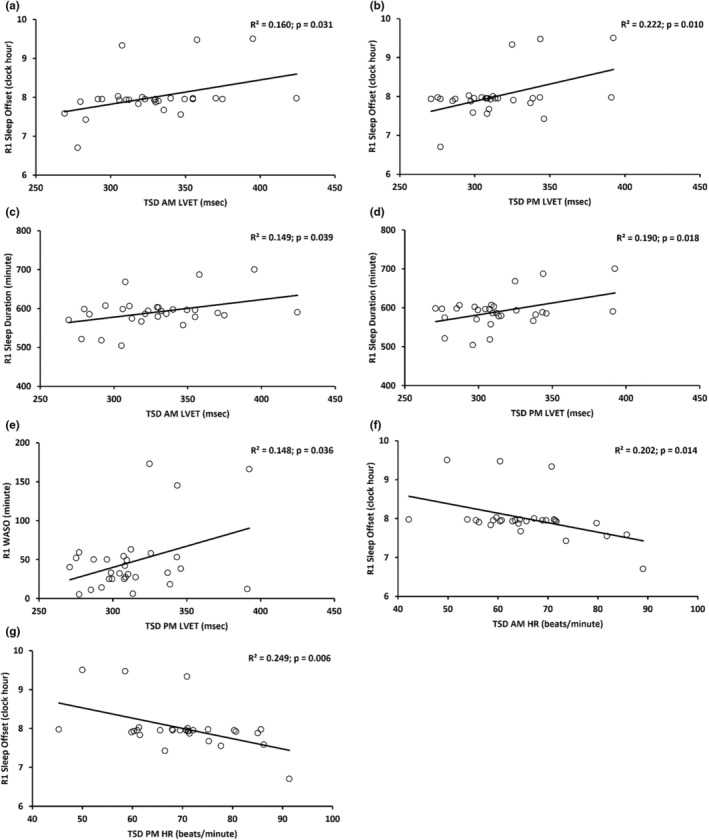 FIGURE 3
| Sleep measure | Pre‐experimental phase | B1 | B2 | TSD | R1 |
|---|---|---|---|---|---|
| Sleep duration (min) | 430.515 ± 19.083 | 444.760 ± 28.961 | 443.258 ± 31.620 | ‐ | 590.660 ± 41.732 |
| Sleep onset (clock hour) | 23.607 ± 0.341 | 23.398 ± 0.388 | 23.415 ± 0.534 | ‐ | 22.155 ± 0.410 |
| Sleep offset (clock hour) | 6.783 ± 0.133 | 6.820 ± 0.249 | 6.803 ± 0.214 | ‐ | 7.999 ± 0.561 |
| Sleep midpoint (clock hour) | 3.195 ± 0.204 | 3.112 ± 0.221 | 3.118 ± 0.311 | ‐ | 3.096 ± 0.320 |
| Sleep efficiency (%) | 87.552 ± 4.224 | 88.160 ± 6.271 | 88.557 ± 4.711 | ‐ | 90.840 ± 6.249 |
| WASO (min) | 39.302 ± 17.460 | 37.430 ± 20.520 | 38.161 ± 20.062 | ‐ | 47.200 ± 42.128 |
| Sleep onset latency (min) | 8.766 ± 7.419 | 11.290 ± 18.199 | 7.678 ± 8.444 | ‐ | 1.870 ± 3.401 |
| Percent sleep (%) | 90.877 ± 3.957 | 91.640 ± 4.468 | 91.424 ± 4.248 | ‐ | 92.130 ± 6.049 |
| Cardiovascular measure | TSD AM | TSD PM |
|---|---|---|
| Systemic vascular resistance index (mmHg·L/min/m2) | 40.201 ± 14.697 | 38.186 ± 10.768 |
| Stroke volume (mL) | 68.009 ± 15.848 | 65.309 ± 15.113 |
| Left ventricular ejection time (msec) | 329.330 ± 35.304 | 313.806 ± 29.362 |
| Heart rate (beats/min) | 65.167 ± 10.206 | 70.272 ± 11.058 |
| Cardiac index (L/min/m2) | 2.418 ± 0.643 | 2.501 ± 0.697 |
| Systolic blood pressure (mmHg) | 114.767 ± 10.950 | 114.533 ± 8.939 |
| Diastolic blood pressure (mmHg) | 77.733 ± 7.428 | 77.300 ± 6.374 |
| Mean arterial blood pressure (mmHg) | 90.067 ± 8.077 | 89.800 ± 6.609 |
| B2 sleep predictor and TSD CV measure ( | Unstandardized | Standardized beta |
| 95% CI |
|
|---|---|---|---|---|---|
| B2 WASO and TSD PM SV | −0.281 ± 0.130 | −0.374 | −2.169 | −0.547, −0.016 |
|
| B2 WASO and TSD PM SVRI | 0.192 ± 0.093 | 0.358 | 2.065 | 0.002, 0.382 |
|
| B2 % Sleep and TSD PM SV | 1.376 ± 0.609 | 0.387 | 2.258 | 0.130, 2.622 |
|
| B2 % Sleep and TSD PM SVRI | −1.010 ± 0.432 | −0.398 | −2.340 | −1.893, −0.127 |
|
| B2 sleep predictor and TSD CV measure | Unstandardized | Standardized beta |
| 95% CI |
|
|---|---|---|---|---|---|
| B2 WASO and TSD PM SV | |||||
| Females | −0.443 ± 0.235 | −0.495 | −1.888 | −0.960, 0.073 | 0.086 |
| Males | −0.246 ± 0.165 | −0.349 | −1.489 | −0.596, 0.104 | 0.156 |
| B2 WASO and TSD PM SVRI | |||||
| Females | 0.478 ± 0.164 | 0.659 | 2.909 | 0.116, 0.840 |
|
| Males | 0.090 ± 0.112 | 0.196 | 0.799 | −0.148, 0.327 | 0.436 |
| B2 % Sleep and TSD PM SV | |||||
| Females | 1.955 ± 1.119 | 0.466 | 1.747 | −0.508, 4.417 | 0.108 |
| Males | 1.265 ± 0.773 | 0.379 | 1.637 | −0.373, 2.903 | 0.121 |
| B2 % Sleep and TSD PM SVRI | |||||
| Females | −2.213 ± 0.777 | −0.652 | −2.850 | −3.922, −0.504 |
|
| Males | −0.568 ± 0.522 | −0.262 | −1.087 | −1.674, 0.539 | 0.293 |
| TSD CV predictor and R1 sleep measure ( | Unstandardized | Standardized beta |
| 95% CI |
|
|---|---|---|---|---|---|
| TSD AM LVET and R1 sleep offset | 0.006 ± 0.003 | 0.401 | 2.272 | 0.001, 0.012 |
|
| TSD PM LVET and R1 sleep offset | 0.009 ± 0.003 | 0.471 | 2.776 | 0.002, 0.015 |
|
| TSD AM LVET and R1 sleep duration | 0.449 ± 0.207 | 0.386 | 2.173 | 0.025, 0.872 |
|
| TSD PM LVET and R1 sleep duration | 0.607 ± 0.241 | 0.436 | 2.517 | 0.112, 1.101 |
|
| TSD PM LVET and R1 WASO | 0.545 ± 0.247 | 0.385 | 2.207 | 0.039, 1.051 |
|
| TSD AM HR and R1 sleep offset | −0.024 ± 0.009 | −0.449 | −2.614 | −0.044, −0.005 |
|
| TSD PM HR and R1 sleep offset | −0.026 ± 0.009 | −0.499 | −2.992 | −0.045, −0.008 |
|
| TSD CV predictor and R1 sleep measure | Unstandardized | Standardized beta |
| 95% CI |
|
|---|---|---|---|---|---|
| TSD AM LVET and R1 sleep offset | |||||
| Females | 0.013 ± 0.005 | 0.638 | 2.620 | 0.002, 0.024 |
|
| Males | 0.002 ± 0.003 | 0.198 | 0.781 | −0.004, 0.009 | 0.447 |
| TSD PM LVET and R1 sleep offset | |||||
| Females | 0.015 ± 0.006 | 0.626 | 2.538 | 0.002, 0.027 |
|
| Males | 0.005 ± 0.004 | 0.295 | 1.197 | −0.004, 0.013 | 0.250 |
| TSD AM LVET and R1 sleep duration | |||||
| Females | 0.941 ± 0.388 | 0.609 | 2.427 | 0.077, 1.804 |
|
| Males | 0.176 ± 0.230 | 0.193 | 0.762 | −0.315, 0.666 | 0.458 |
| TSD PM LVET and R1 sleep duration | |||||
| Females | 1.075 ± 0.451 | 0.602 | 2.385 | 0.071, 2.079 |
|
| Males | 0.300 ± 0.294 | 0.255 | 1.021 | −0.326, 0.926 | 0.324 |
| TSD PM LVET and R1 WASO | |||||
| Females | 1.182 ± 0.410 | 0.673 | 2.881 | 0.268, 2.097 |
|
| Males | 0.140 ± 0.318 | 0.110 | 0.441 | −0.533, 0.813 | 0.665 |
| TSD AM HR and R1 sleep offset | |||||
| Females | −0.053 ± 0.019 | −0.674 | −2.886 | −0.095, −0.012 |
|
| Males | −0.014 ± 0.010 | −0.339 | −1.396 | −0.035, 0.007 | 0.183 |
| TSD PM HR and R1 sleep offset | |||||
| Females | −0.059 ± 0.017 | −0.735 | −3.429 | −0.097, −0.021 |
|
| Males | −0.015 ± 0.010 | −0.362 | −1.502 | −0.035, 0.006 | 0.154 |
| Sleep measure | Sleep duration | Sleep onset | Sleep offset | Sleep midpoint | Sleep efficiency | Wake after sleep onset | Sleep onset latency |
|---|---|---|---|---|---|---|---|
| Sleep onset | −0.919 | ||||||
| Sleep offset | 0.166 | 0.237 | |||||
| Sleep midpoint | −0.696 | 0.917 | 0.577 | ||||
| Sleep efficiency | 0.031 | 0.014 | 0.091 | −0.014 | |||
| Wake after sleep onset | 0.255 | −0.176 | 0.186 | −0.008 | −0.848 | ||
| Sleep onset latency | −0.338 | 0.371 | 0.035 | 0.282 | −0.257 | −0.133 | |
| Percent sleep | −0.109 | 0.038 | −0.172 | −0.100 | 0.881 | −0.988 | 0.096 |
| Sleep measure | Sleep duration | Sleep onset | Sleep offset | Sleep midpoint | Sleep efficiency | Wake after sleep onset | Sleep onset latency |
|---|---|---|---|---|---|---|---|
| Sleep onset | −0.592 | ||||||
| Sleep offset | 0.809 | −0.005 | |||||
| Sleep midpoint | 0.225 | 0.616 | 0.729 | ||||
| Sleep efficiency | −0.525 | 0.087 | −0.588 | −0.512 | |||
| Wake after sleep onset | 0.688 | −0.122 | 0.764 | 0.608 | −0.945 | ||
| Sleep onset latency | −0.175 | 0.455 | 0.117 | 0.439 | −0.297 | 0.142 | |
| Percent sleep | −0.613 | 0.076 | −0.705 | −0.604 | 0.973 | −0.989 | −0.215 |
- —National Aeronautics and Space Administration (NASA) 10.13039/100000104
- —HHS | National Institutes of Health (NIH) 10.13039/100000002
Peer Reviews
No public reviews on file for this paper yet. If you reviewed it on a platform where reviews are public (OpenReview, ICLR, NeurIPS, ICML), you can paste yours below so the community can read it here.
Videos
No videos yet. Explain this paper in a talk, walkthrough, or lecture? Add one.
Taxonomy
TopicsSleep and related disorders · Heart Rate Variability and Autonomic Control · Sleep and Work-Related Fatigue
INTRODUCTION
1
According to the American Heart Association, sleep duration is one of the essential eight elements for evaluating cardiovascular (CV) health (Lloyd‐Jones et al., 2022). Moreover, chronic sleep loss is a critical public health concern related to CV disease (Cappuccio et al., 2011; Liew & Aung, 2021; Liu & Chen, 2019; Mullington et al., 2009; Tobaldini et al., 2017). Past studies have shown short‐term and long‐term trait‐like stability of CV and actigraphic sleep measures across repeated exposures to total sleep deprivation (TSD) and recovery conditions (Pasetes et al., 2023a; Pasetes & Goel, 2024). Prior research has also shown changes in CV indices after one night of TSD (Kato et al., 2000; Kuetting et al., 2019; Mikulski et al., 2006; Pasetes et al., 2023b; Yamazaki, Rosendahl‐Garcia, et al., 2022) and after one night of TSD and psychological stress (Yamazaki, Rosendahl‐Garcia, et al., 2022). Furthermore, both short‐term and long‐term stress affect CV indices and increase the risk for CV disease (Turner et al., 2020). A well‐validated acute psychological stressor, the Trier Social Stress Test (Kirschbaum et al., 1993), increases blood pressure, heart rate (HR), vascular resistance, and cardiac output and decreases left ventricular ejection time (LVET) and stroke volume (SV) (Allen et al., 2014; Jayasinghe et al., 2017). Of note, TSD and various stress conditions combined also increase blood pressure (Bozer et al., 2021; Kato et al., 2000).
Previous studies have examined relationships between sleep and blood pressure and/or HR measures in conditions without sleep loss (Abbott et al., 2019; Bigalke et al., 2024; Chang & Kang, 2021; Doyle et al., 2019; Ekstedt et al., 2004; Fujikawa et al., 2009; Jansen et al., 2020; Liang et al., 2024; Mezick et al., 2012; Sekiguchi et al., 2019; Springall De Pablo & Lauderdale, 2024; Yiallourou et al., 2021), and a few studies have examined these relationships after psychological stress (Eiman et al., 2019; Massar et al., 2017; Mezick et al., 2014). Only one study found an association between self‐rated sleep quality and blood pressure after a night of sleep restriction (Bommarito & Millar, 2024). No studies, however, have examined predictors between baseline sleep and CV metrics including novel echocardiographic measures during acute TSD and psychological stress. Furthermore, it is important to examine these CV predictors during TSD to identify biomarkers and highlight critical relationships between metrics of sleep health and cardiovascular health.
For the first time, we examined whether baseline actigraphic sleep measures the night before TSD acutely predicted blood pressure and echocardiographic CV measures during TSD and psychological stress in healthy adults under controlled conditions. Furthermore, in order to determine if those predictors that were significant were unique to TSD in the morning and/or TSD and psychological stress in the evening, we also evaluated the extent to which baseline actigraphic sleep measures predicted CV indices during the baseline morning before exposure to TSD. In addition, this is the first assessment of whether CV indices during TSD and psychological stress acutely predicted sleep measures during that night's recovery. We hypothesized that (1) better sleep health metrics the night before TSD would significantly predict better CV health metrics during TSD in the morning and during TSD and psychological stress in the evening but not during baseline; and (2) better CV health metrics during TSD in the morning and during TSD and psychological stress in the evening would significantly predict better subsequent recovery sleep health metrics.
MATERIALS AND METHODS
2
Participants
2.1
The Human Research Program Human Exploration Research Analog (HERA), located in Johnson Space Center in Houston, TX, is a high‐fidelity space analog isolation facility. In this highly controlled facility, we studied 32 healthy adults (ages 27–53; mean age ± standard deviation [SD], 35.1 ± 7.1 years, 14 females: 35.8 ± 7.6 years; 18 males: 34.6 ± 7.0 years). Four participants at a time took part in one of four HERA 14‐day studies or one of four HERA 30‐day studies. Participants were screened extensively by the National Aeronautics and Space Administration (NASA) and had human‐support skills and technical and/or scientific backgrounds relevant for space exploration. Inclusion/exclusion criteria included enrolling both males and females; all participants were in excellent health—they passed a physical exam, a psychological assessment, and a drug screen, and had no history of CV, musculoskeletal, neurological, integumentary, or gastrointestinal problems (Abeln et al., 2022; Pasetes et al., 2023a, 2023b; Saveko et al., 2022; Yamazaki, Antler, Casale, et al., 2021; Yamazaki, Rosendahl‐Garcia, et al., 2022). The study was approved by the Institutional Review Boards of NASA, who had primary oversight, and by the University of Pennsylvania, and all protocol methods were carried out in accordance with approved guidelines and regulations. Prior to inclusion in the study, participants provided written informed consent, which was in accordance with the Declaration of Helsinki. Participants were compensated for their participation in the protocol.
Procedures
2.2
During each HERA study, participants took part in a 5‐day experiment that induced total sleep deprivation and psychological stress (Figure 1). The 5‐day experiment occurred during study days 9–13 within the 14‐day study and during study days 23–27 within the 30‐day study and consisted of 2 baseline nights [B1 and B2; 8‐h time‐in‐bed, 2300–0700 h], followed by 39‐h acute TSD during which participants remained awake. A mental stress task was conducted between approximately 1500–1700 h on the day after the TSD night to produce psychological stress (described below). TSD was followed by a 10‐h time‐in‐bed recovery night (R1; 2200–0800 h), and a second 8‐h time‐in‐bed recovery night (R2; 2300–0700 h). Of note, due to the homeostatic pressure to sleep following TSD, participants were allowed flexibility in bedtimes and waketimes on the R1 night (Table 1). Fitness levels were not specifically measured; however, all participants experienced similar amounts of activity during the study, were confined to engaging in prescribed activities at specific times, and were prohibited from napping or consuming caffeine during the experiment. Participants were monitored continuously by wrist actigraphy and by outside observers to ensure adherence.
Consecutive 5‐day experimental protocol. Actigraphic nighttime sleep data were collected during the pre‐experimental phase, which occurred 8–10 days prior to the first baseline night of the consecutive 5‐day experiment (not shown in the figure). During the consecutive 5‐day experiment, participants received two nights of baseline with an 8‐h time‐in‐bed sleep opportunity (B1, B2; 2300–0700 h). Baseline cardiovascular (CV) measure collection occurred at approximately 0700 h (white arrow) after the B2 night. Following B2 daytime, participants experienced continued wakefulness for approximately 39 h of total sleep deprivation (TSD). CV morning measure collection occurred at approximately 0700 h after approximately 25 h of TSD (white arrow). A mental stress task (bracket) was administered between 1500 and 1700 h during the TSD day, with CV measure collection after mental stress task completion at approximately 1700 h following approximately 34 h of TSD (white arrow). Recovery sleep opportunities, which followed approximately 39 h of TSD, were 10‐h time‐in‐bed (recovery 1 [R1]; 2200–0800 h) and 8‐h time‐in‐bed (recovery 2 [R2]; 2300–0700 h). Actigraphic sleep data were collected during the nighttime time‐in‐bed opportunities (shaded gray bars).
Actigraphy sleep measure collections
2.3
A wrist accelerometer (Actiwatch Spectrum, Philips Respironics Healthcare, Bend, OR, USA) measured sleep–wake metrics related to quantity, timing, and quality including sleep duration (the amount of time elapsed between sleep onset and sleep offset), sleep onset (clock time at the start of each sleep period), sleep offset (clock time at the end of each sleep period), sleep midpoint (clock time of the half‐way point between sleep onset and sleep offset; a proxy of circadian phase), sleep efficiency (the percentage of time spent asleep out of the total sleep time), wake after sleep onset (WASO; amount of time awake after initially falling asleep), sleep onset latency (the amount of time it takes to fall asleep), and percent sleep (the percentage of time spent asleep during the sleep period) during the pre‐experimental phase (the average across 8–10 days before the start of the 5‐day experiment), and the B1, B2, and R1 nights (Pasetes et al., 2023a, 2023b; Pasetes & Goel, 2024). Notably, the pre‐experimental phase, and B1 and B2 nights had comparable actigraphic sleep data (Table 1). Actiwatches were worn on the non‐dominant wrist and data were collected in 1‐min intervals (using firmware version 01.01.0015, medium wake threshold) and processed using the Actiware software (version 6.1.0). Actigraphic sleep data during the nighttime intervals were analyzed similar to our prior research (e.g., Dennis et al., 2017; Moreno‐Villanueva et al., 2018; Pasetes et al., 2023a, 2023b; Pasetes & Goel, 2024; Yamazaki, Antler, Lasek, et al., 2021; Yamazaki, Casale, et al., 2022; Yamazaki & Goel, 2020; Yamazaki, Rosendahl‐Garcia, et al., 2022). Of note, actigraphic data from past studies with a similar experimental design using the same Actiwatch had sleep measures within similar ranges (Pasetes et al., 2023a, 2023b; Pasetes & Goel, 2024).
Cardiovascular measure collections
2.4
During these experiments, CV indices including systemic vascular resistance (SVRI), SV, LVET, HR, and cardiac index were collected via echocardiography. Systolic and diastolic blood pressure and mean arterial pressure were collected via blood pressure monitor. CV measures were collected in a seated position during the B2 morning (B2 AM), TSD morning (TSD AM; after approximately 25 h of TSD) and TSD evening after a mental stress task (TSD PM; after approximately 34 h of TSD and psychological stress). The B2 AM and TSD AM collections were completed at approximately 0700 h before eating, and the TSD PM collection was completed at approximately 1700 h under highly controlled conditions (Figure 1). All participants fasted for approximately 10 h prior to the AM collections and for approximately 5 h prior to the PM collection to maintain consistency across the study and among participants. Exercise did not occur before the B2 AM, TSD AM, or TSD PM CV measure collections. Of note, all CV measures were within the ranges reported for healthy adults (Table 2) (Cattermole et al., 2017; Klabunde, 2012; Lü et al., 2018; Pasetes et al., 2023a, 2023b; Shaffer & Ginsberg, 2017; Yamazaki, Rosendahl‐Garcia, et al., 2022).
Echocardiogram procedures
2.5
Due to strict isolation conditions in the facility, one participant collected all cardiac ultrasound images on the other participants during each study, and a second participant collected all cardiac ultrasound images on the primary collector during each study. All ultrasound operators were extensively trained to obtain ultrasound images and Doppler prior to the study and repeated collection procedures uniformly across each time point (Pasetes et al., 2023a, 2023b; Yamazaki, Rosendahl‐Garcia, et al., 2022). Notably, we have demonstrated robust consistency of CV measures across time based on this collection method in our prior research (Pasetes et al., 2023a).
SV was collected via ultrasound imaging (GE Vivid q ultrasound system [General Electric Medical Systems, Milwaukee]) in a seated posture across all time points (Arbeille & Herault, 1998; Ihlen et al., 1984; McLennan et al., 1986; Yamazaki, Rosendahl‐Garcia, et al., 2022). Two‐dimensional images of the left ventricular outflow tract were collected from each participant using a 5S‐RS transducer (Pasetes et al., 2023a, 2023b; Yamazaki, Rosendahl‐Garcia, et al., 2022). The left ventricular outflow tract was imaged from the parasternal long‐axis view while the participants were semi‐supine in a left lateral decubitus posture (Pasetes et al., 2023a, 2023b; Yamazaki, Rosendahl‐Garcia, et al., 2022). Three to four, two‐second cine‐loops of dynamic motion of the left ventricular outflow tract were digitally saved. SV was collected utilizing a continuous wave pencil (Pedof) probe for Doppler interrogation (Pasetes et al., 2023a, 2023b; Yamazaki, Rosendahl‐Garcia, et al., 2022). Continuous wave Doppler signals were taken from the ascending aorta at the suprasternal notch in a seated posture (Pasetes et al., 2023a, 2023b; Yamazaki, Rosendahl‐Garcia, et al., 2022). Three five‐second cine‐loop sweeps of continuous wave Doppler data were collected and digitally stored as proprietary raw data (Pasetes et al., 2023a, 2023b; Yamazaki, Rosendahl‐Garcia, et al., 2022).
A professional sonographer (K.M.R‐G) conducted formal analyses of the echocardiography data. Analysis of the digital data was performed using Echo PAC PC (BT12) software (General Electric Medical Systems, Milwaukee, WI, United States). Left ventricular outflow tract diameters were measured just proximal to the aortic valve leaflet insertion from three consecutive cine‐loops at the maximum opening of the aortic valve. Five consecutive continuous wave Doppler waveform profiles were traced to calculate the velocity time integral. The interval between each maximum peak on the Doppler spectral from the ascending aorta was used to calculate HR. The duration of each beat was measured to determine LVET for each SV. The velocity time integral and LVET were then transferred from the Echo PAC software to Excel to calculate SV and cardiac index using the following formulas:
Any further continuous wave Doppler waveforms not included in the consecutive SV analysis were analyzed for HR in a seated posture where available.
Blood pressure and systemic vascular resistance index
2.6
Brachial systolic blood pressure and diastolic blood pressure were recorded using an Omron BP791IT 10 series Plus Automatic Blood Pressure Monitor with ComFit™ Cuff (Lake Forest, IL, United States) in a seated position on the non‐dominant arm (Pasetes et al., 2023a, 2023b; Yamazaki, Rosendahl‐Garcia, et al., 2022). Participants were seated for 3 min before blood pressure collection. The average value of three consecutive readings, taken 1 min apart, was used for analyses. SVRI was calculated by assuming that central venous pressure was zero and by using the following equation, whereby mean arterial pressure = (systolic blood pressure + 2 × diastolic blood pressure)/3 (Klabunde, 2012; Norsk et al., 2015; Pasetes et al., 2023a, 2023b; Yamazaki, Rosendahl‐Garcia, et al., 2022):
Mental stress task
2.7
The mental stress task implemented was similar to the Trier Social Stress Test, a commonly used and validated test to experimentally induce psychological stress (Allen et al., 2014; Kirschbaum et al., 1993; Yamazaki, Antler, Casale, et al., 2021; Yamazaki, Rosendahl‐Garcia, et al., 2022), which has been successfully validated and modified using a virtual, rather than a physical audience (Helminen et al., 2021; Kelly et al., 2007; Ruiz et al., 2010; Yamazaki, Antler, Casale, et al., 2021; Yamazaki, Rosendahl‐Garcia, et al., 2022). Participants individually received the 30‐min mental stress task. Participants were given time to prepare their thoughts about how they responded to and felt about the TSD, and then they were interviewed by the research team, including one of the authors (N.G.). The interview involved numerous difficult questions regarding responses to TSD, including those related to motivation, performance, aptitude, and interactions with others. These questions were followed by multiple challenging cognitive tests, which included a 5‐min calculation task involving counting backward aloud in 13‐step sequences and a 3‐min Stroop task; all these tests were added to induce high cognitive performance stress and workload. The mental stress task was conducted with participants remotely via audio and a one‐way video camera due to the isolation conditions (Moreno‐Villanueva et al., 2018; Yamazaki, Antler, Casale, et al., 2021; Yamazaki, Rosendahl‐Garcia, et al., 2022).
Statistical analyses
2.8
All statistical analyses were performed using SPSS v29 (SPSS Inc., Chicago, IL, USA), with p < 0.05 considered statistically significant. Prior studies have found normal distributions for the CV and sleep measures examined in these studies (Orme et al., 1999; Pasetes et al., 2023a, 2023b; Pasetes & Goel, 2024; Yamazaki, Rosendahl‐Garcia, et al., 2022).
For this paper, we analyzed the bidirectional predictors and relationships between B2 and R1 actigraphic night sleep measures and CV measures during TSD (TSD AM) and TSD and psychological stress (TSD PM). Pearson's correlation coefficient (r) and Pearson's R‐squared (R ^2^; coefficient of determination) assessed relationships between B2 actigraphic night sleep metrics (the last sleep opportunity prior to TSD) and TSD AM and TSD PM CV measures and between TSD AM and TSD PM CV measures and R1 actigraphic night sleep indices. For significant associations determined via Pearson's correlations, simple linear regression analyses were conducted (Fonseca et al., 2024). In the results section and in the tables, we present the unstandardized beta (β), which represents the regression slope, and which was used to interpret our findings. The standardized beta represents the “unit‐free” measure of effect size, which is equivalent to Pearson's correlation.
Simple linear regression analyses evaluated the extent to which each specific B2 actigraphic night sleep measure (independent variable) predicted each CV measure during TSD AM and TSD PM (dependent variable) and evaluated the extent to which each CV measure during TSD AM and TSD PM (independent variable) predicted each R1 actigraphic night sleep measure (dependent variable). In addition, given the well‐established sex differences in objective sleep measures (Forshaw et al., 2024; Johnson et al., 2024; Lok et al., 2024; Mulè et al., 2021; Roberts et al., 2022; Wright et al., 2023) and in blood pressure and echocardiographic CV measures (Drury et al., 2024; Hoopes et al., 2021; Liang et al., 2024; Lin et al., 2023; Quer et al., 2020; Wooten et al., 2021), we conducted exploratory simple linear regression analyses on the significant main simple linear regression analyses in males and females separately to determine if these predictors remained significant. Furthermore, in order to determine if the significant results were exclusive to TSD AM and/or TSD PM CV measures, simple linear regression analyses evaluated whether B2 actigraphic sleep measures predicted CV indices during the B2 morning (B2 AM) before exposure to TSD.
Pearson's correlation coefficient (r) also assessed relationships between B2 night sleep metrics and between R1 night sleep metrics. Repeated Measures (RM) ANOVA assessed potential differences in sleep metrics across the pre‐experimental phase and the B1 and B2 nights (Table 1). Sphericity Assumed corrections for degrees of freedom were applied for all RM ANOVAs since Mauchly's test was never violated for significant within‐subject effects. Post hoc analyses with Bonferroni corrections compared the pre‐experimental phase and the B1 and B2 nights when there was a significant effect across all three phases. Bonferroni‐corrected p values are reported.
For N = 1 participant, B2 sleep onset latency and B2 sleep efficiency measures were outliers (±3 SD from the mean) and therefore were excluded from all B2 analyses. For N = 1 participant, R1 sleep duration, R1 sleep offset, and R1 sleep midpoint were outliers (±3 SD from the mean) and therefore were excluded from all R1 analyses (in addition, since sleep offset and sleep midpoint were both outliers, sleep onset was excluded). N = 1 participant was removed from all B2 and R1 analyses due to four actigraphic sleep measure outliers (±3 SD from the mean) and N = 1 participant did not wear the Actiwatch during R1 and was therefore excluded from all R1 analyses. N = 1 participant was removed from TSD AM and TSD PM systolic blood pressure, diastolic blood pressure, and mean arterial pressure analyses due to outliers (±3 SD from the mean).
RESULTS
3
B2 actigraphic night sleep measures as predictors of cardiovascular indices during TSD and TSD and psychological stress
3.1
Simple linear regression analyses evaluated the extent to which B2 actigraphic night sleep measures predicted CV indices during TSD in the morning (TSD AM) and during TSD and psychological stress in the evening (TSD PM). Higher B2 WASO significantly predicted lower TSD PM SV (r = −0.374) and higher TSD PM SVRI (r = 0.358): each 1‐min increase in B2 WASO significantly predicted a 0.281 mL decrease in TSD PM SV and a 0.192 mmHg·L/min/m^2^ increase in TSD PM SVRI (Table 3 and Figure 2a,b). B2 WASO predicted 14.0% of the variance in TSD PM SV and 12.8% of the variance in TSD PM SVRI. In contrast to the WASO findings, greater B2 percent sleep significantly predicted higher SV (r = 0.387) and lower SVRI (r = −0.398) during TSD PM: each 1% increase in B2 percent sleep significantly predicted a 1.376 mL increase in TSD PM SV and a 1.010 mmHg·L/min/m^2^ decrease in TSD PM SVRI (Table 3 and Figure 2c,d). B2 percent sleep predicted 15.0% of the variance in TSD PM SV and 15.9% of the variance in TSD PM SVRI. We also found in females each 1‐min increase in B2 WASO significantly predicted a 0.478 mmHg·L/min/m^2^ increase in TSD PM SVRI (r = 0.659; R ^2^ = 0.435; Table 4) and each 1% increase in B2 percent sleep significantly predicted a 2.213 mmHg·L/min/m^2^ decrease in TSD PM SVRI (r = −0.652; R ^2^ = 0.425; Table 4).
Scatter plots displaying baseline night 2 (B2) actigraphic sleep measures as significant predictors of cardiovascular (CV) measures derived from echocardiography after 34 h of total sleep deprivation and psychological stress (TSD PM). Simple linear regression found that higher B2 wake after sleep onset (WASO) significantly predicted (a) lower TSD PM stroke volume (SV) and (b) higher TSD PM systemic vascular resistance index (SVRI). Greater B2 percent sleep significantly predicted (c) higher TSD PM SV and (d) lower TSD PM SVRI. The regression line, R 2 and p value for each plot are shown. p < 0.05 was significant. N = 31 for a–d.
There were no other significant B2 actigraphic night sleep measures as predictors of CV indices during TSD and TSD and psychological stress, and no other significant predictors in females and males.
B2 actigraphic night sleep measures as predictors of B2 morning cardiovascular indices
3.2
In order to determine if the aforementioned significant predictors were unique to TSD AM and/or TSD PM CV indices, simple linear regression analyses evaluated the extent to which B2 actigraphic night sleep measures predicted CV indices during the B2 morning (B2 AM) before exposure to TSD. We found one significant result in which higher B2 WASO significantly predicted higher B2 AM SVRI: each 1‐min increase in B2 WASO significantly predicted a 0.309 mmHg·L/min/m^2^ increase in B2 AM SVRI (r = 0.414; R ^2^ = 0.171; β ± SE = 0.309 ± 0.126; t = 2.450; p = 0.021). There were no other significant B2 actigraphic night sleep measures as predictors of B2 AM CV indices.
Cardiovascular indices during TSD and TSD and psychological stress as predictors of R1 actigraphic sleep measures
3.3
Simple linear regression analyses evaluated the extent to which CV indices during TSD in the morning (TSD AM) and TSD and psychological stress in the evening (TSD PM) predicted R1 actigraphic night sleep measures. Longer TSD AM and TSD PM LVET significantly predicted later R1 sleep offset and longer R1 sleep duration (r: 0.386–0.471): each 1 msec increase in TSD AM and TSD PM LVET predicted a 0.006–0.009 h (0.36–0.54 min) delay in R1 sleep offset, respectively (Table 5 and Figure 3a,b) and a 0.449–0.607 min increase in R1 sleep duration, respectively (Table 5 and Figure 3c,d). TSD AM and TSD PM LVET predicted 16.0%–22.2% of the variance in R1 sleep offset and 14.9%–19.0% of the variance in R1 sleep duration. Moreover, in females, each 1 msec increase in TSD AM and TSD PM LVET significantly predicted a 0.013–0.015 h (0.78–0.90 min) delay in R1 sleep offset (r = 0.638; R ^2^ = 0.407), respectively (r = 0.626; R ^2^ = 0.392; Table 6) and a 0.941 min (r = 0.609; R ^2^ = 0.371) to 1.075 min increase in R1 sleep duration, respectively (r = 0.602; R ^2^ = 0.362; Table 6).
Scatter plots displaying cardiovascular (CV) measures derived from echocardiography after 25 h of total sleep deprivation (TSD AM) and after 34 h of TSD and psychological stress (TSD PM) as significant predictors of recovery night 1 (R1) actigraphic sleep measures. Simple linear regression found that longer TSD AM and TSD PM left ventricular ejection time (LVET) predicted (a, b) later R1 sleep offset and (c, d) longer R1 sleep duration; and longer TSD PM LVET predicted (e) higher R1 wake after sleep onset (WASO). Higher TSD AM and TSD PM heart rate (HR) predicted (f, g) earlier R1 sleep offset. The regression line, R 2 and p value for each plot are shown. p < 0.05 was significant. N = 29 for a–d, f, g. N = 30 for e.
In addition, longer LVET during TSD PM significantly predicted higher R1 WASO (r = 0.385): each 1 msec increase in TSD PM LVET significantly predicted a 0.545 min increase in R1 WASO (Table 5 and Figure 3e). TSD PM LVET predicted 14.8% of the variance in R1 WASO. In addition, in females, each 1 msec increase in TSD PM LVET significantly predicted a 1.182 min increase in R1 WASO (r = 0.673; R ^2^ = 0.454; Table 6).
In contrast to the LVET findings, higher HR during TSD AM (r = −0.449) and TSD PM (r = −0.499) significantly predicted an earlier R1 sleep offset: each 1 beat/min increase in TSD AM and TSD PM HR significantly predicted a 0.024 h to 0.026 h (1.44–1.56 min) advance in R1 sleep offset, respectively (Table 5 and Figure 3f,g). TSD AM and TSD PM HR predicted 20.2%–24.9% of the variance in R1 sleep offset. We also found in females, each 1 msec increase in TSD AM and TSD PM HR significantly predicted a 0.053 h (3.18 min; r = −0.674; R ^2^ = 0.454) to 0.059 h (3.54 min; r = −0.735; R ^2^ = 0.540) advance in R1 sleep offset, respectively (Table 6).
There were no other significant CV indices during TSD and TSD and psychological stress as predictors of R1 actigraphic night sleep measures, and no other significant predictors in females and males.
Correlations between B2 actigraphic night sleep metrics and between R1 actigraphic night sleep metrics
3.4
Pearson's correlation analyses found significant correlations between B2 actigraphic night sleep measures (Table 7) and between R1 actigraphic night sleep measures (Table 8).
DISCUSSION
4
We demonstrated novel bidirectional predictors and mechanisms between baseline and recovery sleep measures and CV measures during TSD and psychological stress. We found that higher B2 WASO predicted lower TSD PM SV and higher TSD PM SVRI, with greater B2 percent sleep predicting inverse relationships. Overall, B2 sleep measures predicted 12.8–15.9% of the variance in TSD PM CV indices. Of note, we found one significant B2 sleep predictor of baseline CV metrics, whereby higher B2 WASO predicted higher B2 AM SVRI. In addition, longer TSD LVET predicted later R1 sleep offset, longer sleep duration, and higher WASO; by contrast, higher TSD AM and TSD PM HR predicted earlier R1 sleep offset. Overall, TSD CV indices predicted 14.8%–24.9% of the variance in R1 sleep measures. Notably, females showed significant predictive bidirectional relationships . In summary, we demonstrate that baseline sleep measures predict CV metrics during TSD and psychological stress, and that these CV metrics predict subsequent recovery sleep measures. Our results highlight critical mechanisms and biomarkers between sleep health and cardiovascular health.
Our results showed that higher B2 WASO predicted lower TSD PM SV and higher TSD PM SVRI, while greater B2 percent sleep predicted higher TSD PM SV and lower TSD PM SVRI. Consistent with these results, we previously found that SV and SVRI showed opposite changes during TSD in a separate dataset with a similar experimental design (Pasetes et al., 2023b), and furthermore, that TSD AM and TSD PM SV, and TSD AM and TSD PM SVRI did not show significant differences (Yamazaki, Rosendahl‐Garcia, et al., 2022). Notably, our results demonstrate that B2 sleep predicted SV and SVRI during the TSD evening, after exposure to the mental stress task, but not during the morning of TSD. Our TSD SV results may be due to a myocardial mechanism that is invoked in response to stressors that require active coping (James et al., 2012; Lü et al., 2018), such as TSD and psychological stress. Indeed, in an earlier study, we showed that cognitively vulnerable individuals had lower SV and higher SVRI during TSD (Yamazaki, Rosendahl‐Garcia, et al., 2022), thus suggesting these CV responses are adverse rather than adaptive. Importantly, our findings demonstrate that higher WASO and lower percent sleep the night before sleep loss can uniquely predict higher TSD PM SVRI. Our results also show that lower TSD PM SV can be predicted a priori in those individuals who have higher WASO and lower percent sleep the night before sleep loss and during the pre‐experimental (habitual) sleep phase. In addition, higher B2 WASO also significantly predicted higher B2 AM SVRI, which may indicate that sleep continuity the night before is related to the next morning's vascular resistance. B2 night sleep indices did not significantly predict blood pressure metrics consistent with some prior studies (Bigalke et al., 2024; Mezick et al., 2012), but in contrast with others (Abbott et al., 2019; Bommarito & Millar, 2024; Chang & Kang, 2021; Eiman et al., 2019; Fujikawa et al., 2009; Jansen et al., 2020; Liang et al., 2024; Massar et al., 2017; Mezick et al., 2014; Springall De Pablo & Lauderdale, 2024).
Our findings demonstrated that longer TSD AM and TSD PM LVET predicted later R1 sleep offset and longer R1 sleep duration, and longer TSD PM LVET predicted higher R1 WASO. In contrast, higher TSD AM and TSD PM HR predicted earlier R1 sleep offset. Similar to these results, we previously found a significant negative association between LVET and HR during TSD (Pasetes et al., 2023a). In a prior study, we found that individuals with cognitive vulnerability during TSD and psychological stress had longer LVET (Yamazaki, Rosendahl‐Garcia, et al., 2022) and that TSD increased LVET, indicating that longer LVET may be a harmful rather than an adaptive response (Pasetes et al., 2023b; Yamazaki, Rosendahl‐Garcia, et al., 2022). Therefore, longer LVET may be indicative of hyperarousal, which is reflected in higher WASO during the subsequent recovery night. Similarly, higher TSD AM and TSD PM HR may signify more stress (Bloomfield et al., 2024), which is reflected in earlier awakening during recovery sleep. Notably, we previously found that TSD AM and TSD PM LVET did not significantly differ; however, TSD AM HR was significantly lower than TSD PM HR (Yamazaki, Rosendahl‐Garcia, et al., 2022). Notably, the R1 sleep timing and duration data following TSD are representative of and similar to those in our prior studies using unrelated samples (Pasetes et al., 2023a, 2023b; Yamazaki, Antler, Lasek, et al., 2021). Little is known about the factors that influence recovery sleep after TSD; thus, future research should further examine the predictive relationships between CV measures during TSD and psychological stress and sleep metrics during recovery.
We found that B2 percent sleep was significantly and negatively correlated with B2 WASO, which likely explains why we found B2 percent sleep and B2 WASO yielded opposite predictive relationships with TSD PM SVRI and TSD PM SV. In addition, B2 sleep efficiency, which was positively related to B2 percent sleep, showed the same predictive relationships with TSD PM SVRI and TSD PM SV, but these did not reach statistical significance (p = 0.053–0.055). In addition, R1 sleep duration, R1 sleep offset, and R1 WASO were all significantly and positively correlated with each other, reflected in their similar predictive relationships with TSD AM and TSD PM LVET. Hence, R1 sleep efficiency and R1 percent sleep, which are negatively correlated with these R1 sleep measures, may show significant negative predictive relationships with TSD AM and TSD PM LVET in a larger sample. Future studies should investigate these relationships further to inform biomarker research in this area.
There are established sex differences in sleep measures (Johnson et al., 2024; Lok et al., 2024; Mulè et al., 2021; Roberts et al., 2022) as well as in CV measures (Drury et al., 2024; Lin et al., 2023; Quer et al., 2020; Wooten et al., 2021). We found that the predictive bidirectional relationships between sleep and CV metrics were significant and explained more of the variance in females. While this is the first examination of bidirectional relationships between baseline and recovery sleep and CV measures during TSD and psychological stress in females and males, other studies generally also found that females showed stronger associations between sleep metrics and CV measures in conditions without sleep loss or psychological stress (Forshaw et al., 2024; Hoopes et al., 2021; Killick et al., 2023; Liang et al., 2024; Makarem et al., 2019). Stronger bidirectional predictions in females are in line with the more robust association between poorer sleep health metrics and higher risk for cardiovascular disease and dysfunction in females (Nikbakhtian et al., 2021; Wright et al., 2023), and the well‐established relationship between female reproductive hormones and sleep (Baker et al., 2012; Wright et al., 2023).
We have previously shown that both actigraphic sleep and CV indices are stable across time during sleep loss (Pasetes et al., 2023a; Pasetes & Goel, 2024); thus, we assume that the predictive bidirectional relationships between these metrics would be maintained and remain significant with repeated exposures to TSD. Therefore, our results have implications for populations who are at risk for or have a CV event or disease such as hypertension, coronary heart disease, congestive heart failure, heart attack, or myocardial infarction (Diao et al., 2023; Fan et al., 2021; Haghayegh et al., 2023; Killick et al., 2023; Kogon et al., 2024; Nikbakhtian et al., 2021; Ujma & Bódizs, 2024; Yan, Li, et al., 2021; Yan, Wu, et al., 2021; Yeung et al., 2023).
Our study has a few limitations. Since we had a smaller sample size, we did not add age or other factors into our linear regression analyses, and we did not correct for multiple comparisons for our main findings. Therefore, future studies should verify the results of this study using larger sample sizes. Since the mental stress task was only conducted in the afternoon, it is unclear whether our significant TSD PM results were due to a time‐of‐day effect or due to psychological stress. Moreover, we did not collect B2 PM SV and SVRI measures; thus, there is no appropriate comparison to subtract TSD PM SV and SVRI measures from B2 AM SV and SVRI measures to determine whether B2 sleep is predictive of TSD PM‐evoked changes. Furthermore, since our study was conducted in isolation and in highly controlled conditions in order to simulate a long‐duration space flight environment, our results may not be generalizable to situations that do not involve such settings (Le Roy et al., 2023). In addition, we used sleep midpoint as a proxy of circadian phase, but we do not have any other measures of circadian phase. Of note, in these studies, we could not examine or control for the menstrual cycle. Finally, the velocity time integral of the continuous wave form of the ascending aorta was used as a surrogate measure for left ventricular outflow tract velocity time integral in our study.
Our novel results found that actigraphic sleep metrics the night before TSD uniquely predicted SV and SVRI during TSD and psychological stress (TSD PM) in healthy adults. Moreover, this is the first demonstration that CV indices during TSD and psychological stress are reflected in the duration, quality, and timing of actigraphic sleep during the subsequent recovery night. Thus, WASO and percent sleep during fully rested conditions may serve as biomarkers to predict individual differences in CV measures during TSD and psychological stress, and similarly, LVET and HR during TSD may be biomarkers for determining individual differences in recovery sleep. Notably, the echocardiographic CV measures assessed in this study have been rarely used in sleep loss studies; thus, our results add important information to the literature on these biomarkers and predictors. Overall, the predictive bidirectional relationships between sleep metrics and CV measures were significant and explained more of the variance in females. Our results underscore the critical relationships and mechanisms between metrics of sleep health and cardiovascular health.
AUTHOR CONTRIBUTIONS
Conceptualization, N.G.; methodology, N.G.; validation, N.G., L.N.P., and K.M.R‐G.; formal analysis, L.N.P. and K.M.R‐G.; investigation, N.G.; resources, N.G.; data curation, N.G.; writing—original draft preparation, L.N.P., N.G., and K.M.R‐G.; writing—review and editing, N.G., L.N.P., and K.M.R‐G.; visualization, L.N.P. and N.G.; supervision, N.G.; project administration, N.G.; funding acquisition, N.G. All authors have read and agreed to the submitted version of the manuscript.
FUNDING INFORMATION
This research was funded by the National Aeronautics and Space Administration (NASA) [grant numbers NNX14AN49G and 80NSSC20K0243 (to N.G.)]. This work was also partially supported by the National Institutes of Health [grant number NIH R01DK117488 (to N.G.)].
CONFLICT OF INTEREST STATEMENT
The authors declare that the research was conducted in the absence of any commercial or financial relationships that could be construed as a potential conflict of interest.
ETHICS STATEMENT
The study was approved by the Institutional Review Boards of NASA, who had primary oversight, and by the University of Pennsylvania, and all protocol methods were carried out in accordance with approved guidelines and regulations. Prior to inclusion in the study, participants provided written informed consent, which was in accordance with the Declaration of Helsinki.
The reference list from the paper itself. Each links out to its DOI / PubMed record.
- 1Abbott, S. M. , Weng, J. , Reid, K. J. , Daviglus, M. L. , Gallo, L. C. , Loredo, J. S. , Nyenhuis, S. M. , Ramos, A. R. , Shah, N. A. , Sotres‐Alvarez, D. , Patel, S. R. , & Zee, P. C. (2019). Sleep timing, stability, and BP in the Sueño ancillary study of the Hispanic community health study/study of Latinos. Chest, 155, 60–68. 10.1016/j.chest.2018.09.018 30300651 PMC 6344384 · doi ↗ · pubmed ↗
- 2Abeln, V. , Fomina, E. , Popova, J. , Braunsmann, L. , Koschate, J. , Möller, F. , Fedyay, S. O. , Vassilieva, G. Y. , Schneider, S. , Strüder, H. K. , & Klein, T. (2022). Chronic, acute and protocol‐dependent effects of exercise on psycho‐physiological health during long‐term isolation and confinement. BMC Neuroscience, 23, 41. 10.1186/s 12868-022-00723-x 35773633 PMC 9244384 · doi ↗ · pubmed ↗
- 3Allen, A. P. , Kennedy, P. J. , Cryan, J. F. , Dinan, T. G. , & Clarke, G. (2014). Biological and psychological markers of stress in humans: Focus on the Trier Social Stress Test. Neuroscience and Biobehavioral Reviews, 38, 94–124. 10.1016/j.neubiorev.2013.11.005 24239854 · doi ↗ · pubmed ↗
- 4Arbeille, P. , & Herault, S. (1998). Cardiovascular echographic and Doppler parameters for the assessment of orthostatic intolerance. European Journal of Ultrasound, 7, 53–71. 10.1016/s 0929-8266(98)00019-6 9614291 · doi ↗ · pubmed ↗
- 5Baker, F. C. , Sassoon, S. A. , Kahan, T. , Palaniappan, L. , Nicholas, C. L. , Trinder, J. , & Colrain, I. M. (2012). Perceived poor sleep quality in the absence of polysomnographic sleep disturbance in women with severe premenstrual syndrome. Journal of Sleep Research, 21, 535–545. 10.1111/j.1365-2869.2012.01007.x 22417163 PMC 3376683 · doi ↗ · pubmed ↗
- 6Bigalke, J. A. , Greenlund, I. M. , Bigalke, J. R. , & Carter, J. R. (2024). Actigraphy‐based sleep and muscle sympathetic nerve activity in humans. American Journal of Physiology. Regulatory, Integrative and Comparative Physiology, 327, R 145–R 151. 10.1152/ajpregu.00113.2024 38842513 PMC 11444507 · doi ↗ · pubmed ↗
- 7Bloomfield, L. S. P. , Fudolig, M. I. , Kim, J. , Llorin, J. , Lovato, J. L. , Mc Ginnis, E. W. , Mc Ginnis, R. S. , Price, M. , Ricketts, T. H. , Dodds, P. S. , Stanton, K. , & Danforth, C. M. (2024). Predicting stress in first‐year college students using sleep data from wearable devices. PLOS Digital Health, 3, e 0000473. 10.1371/journal.pdig.0000473 38602898 PMC 11008774 · doi ↗ · pubmed ↗
- 8Bommarito, J. C. , & Millar, P. J. (2024). Effects of aerobic exercise on ambulatory blood pressure responses to acute partial sleep deprivation: Impact of chronotype and sleep quality. American Journal of Physiology. Heart and Circulatory Physiology, 326, H 291–H 301. 10.1152/ajpheart.00441.2023 38038716 · doi ↗ · pubmed ↗