Enhanced prognostic value of a composite nutritional-inflammatory index (P-CONUT) for predicting mortality risk in patients initiating peritoneal dialysis
Xing Li, Xueli Zhou, Kuo Li, Li Pu, Xueqin He, Xia Liu, Hui Zhong, Dengyan Ma

TL;DR
A new composite score called P-CONUT improves mortality risk prediction in patients starting peritoneal dialysis by combining nutritional and inflammatory indicators.
Contribution
The novel P-CONUT score integrates nutritional and inflammatory status to enhance mortality risk prediction in peritoneal dialysis patients.
Findings
P-CONUT was an independent predictor of all-cause mortality in PD patients.
P-CONUT outperformed CONUT and PNI in prognostic accuracy with higher AUC values.
P-CONUT provided greater net benefit across risk thresholds compared to existing scores.
Abstract
Nutritional and inflammatory indicators are key to predicting outcomes in peritoneal dialysis (PD) patients. This study evaluates the prognostic value of the Prognostic Nutritional Index (PNI), Controlling Nutritional Status (CONUT) score, and a novel composite score, P-CONUT, which integrates both nutritional and inflammatory status, to improve risk prediction and management in PD patients. This retrospective study included 810 PD patients. The primary outcome was all-cause mortality. Kaplan-Meier survival curves compared outcomes across groups, and log-rank tests assessed differences. Univariate and multivariate cox regression analyses identified independent mortality predictors. The prognostic performance of CONUT, PNI, and P-CONUT was evaluated using the area under the curve (AUC) and integrated AUC comparisons. Net reclassification improvement (NRI) and integrated discrimination…
Genes, proteins, chemicals, diseases, species, mutations and cell lines named across the full text — each resolved to its canonical identifier and authoritative record.
Click any figure to enlarge with its caption.
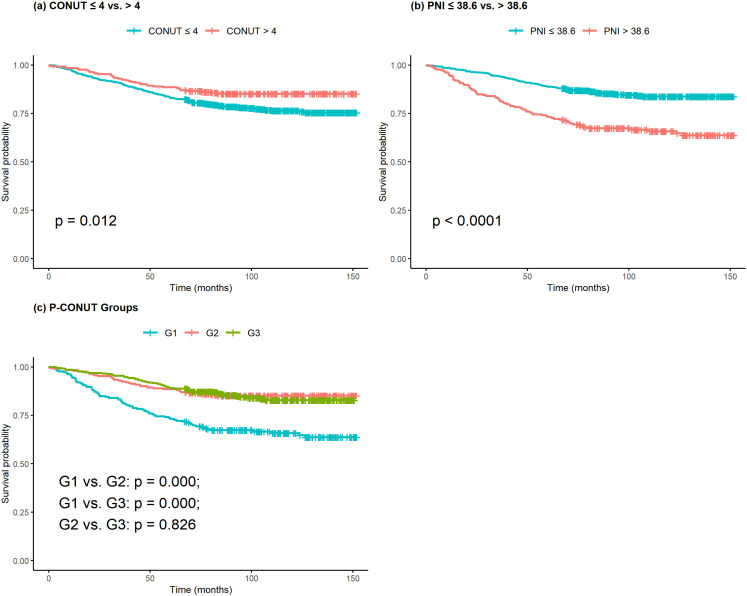 Fig 1
Fig 1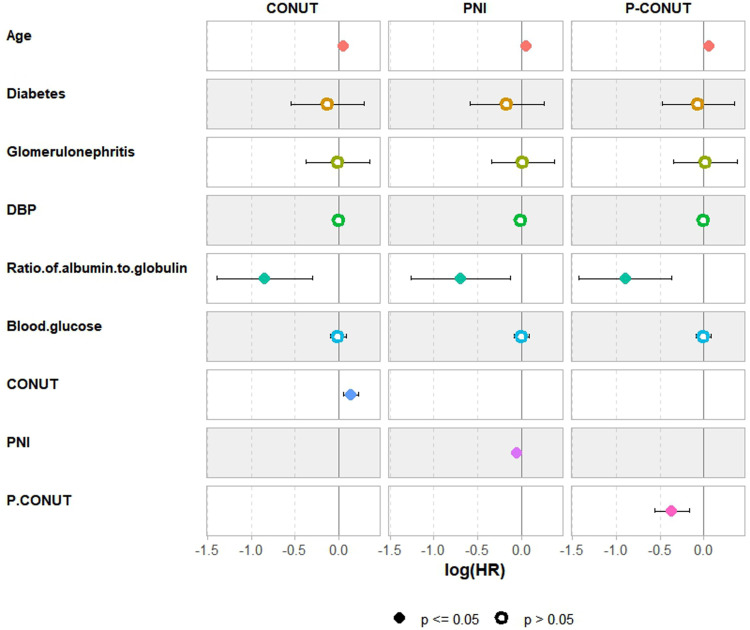 Fig 2
Fig 2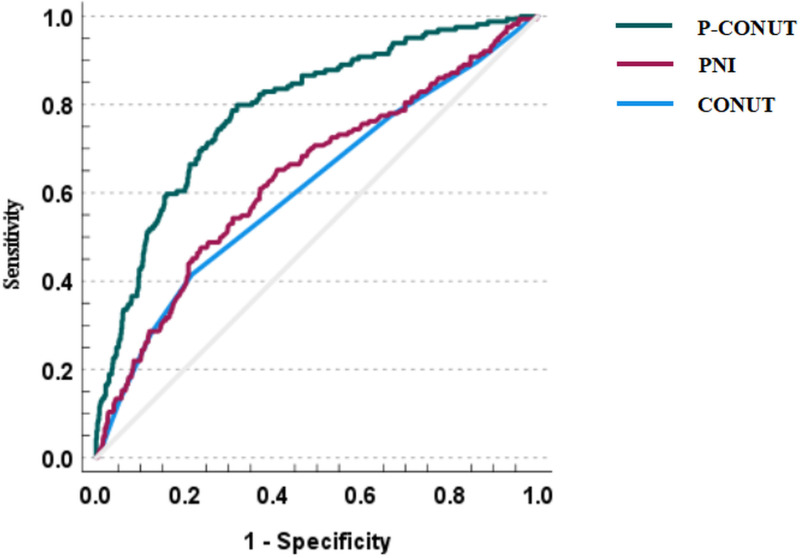 Fig 3
Fig 3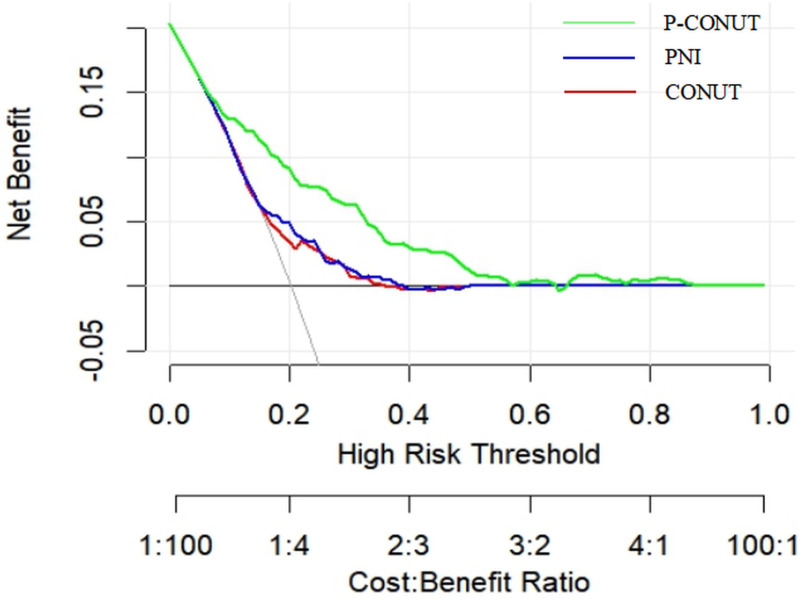 Fig 4
Fig 4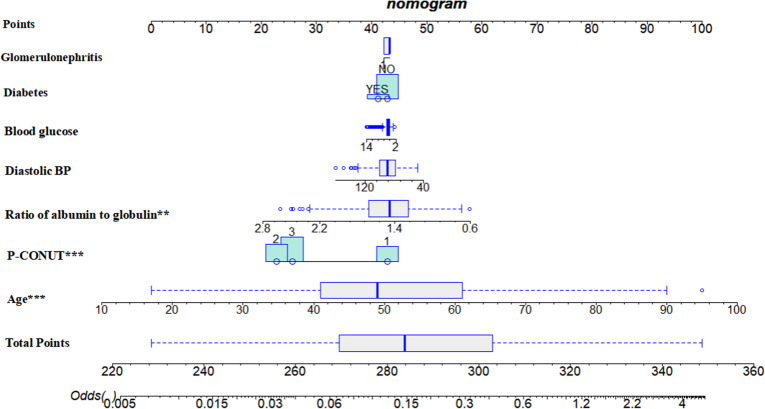 Fig 5
Fig 5Peer Reviews
No public reviews on file for this paper yet. If you reviewed it on a platform where reviews are public (OpenReview, ICLR, NeurIPS, ICML), you can paste yours below so the community can read it here.
Videos
No videos yet. Explain this paper in a talk, walkthrough, or lecture? Add one.
Taxonomy
TopicsDialysis and Renal Disease Management · Nutrition and Health in Aging · Inflammatory Biomarkers in Disease Prognosis
Introduction
Peritoneal dialysis (PD) is an essential renal replacement therapy for patients with end-stage renal disease (ESRD), with around 11% of ESRD patients worldwide receiving PD, particularly in areas with limited access to hemodialysis [1,2]. PD offers advantages such as greater patient autonomy and a lower risk of cardiovascular complications compared to hemodialysis [3]. However, despite these benefits, the long-term survival rate for PD patients remains suboptimal, with 5-year survival rates ranging from 40% to 70% [4,5]. Several factors hinder long-term survival in PD patients, with malnutrition and chronic inflammation being particularly significant [6]. Both of these conditions are strongly linked to increased mortality.
Studies have shown that between 25% and 40% of PD patients suffer from malnutrition, with these individuals facing a two- to three-fold increased risk of mortality compared to those with normal nutritional status [7,8]. In addition to malnutrition, chronic low-grade inflammation is a common and persistent issue in PD patients. This inflammation contributes to complications such as cardiovascular disease, infections, and poor prognosis [9,10]. The coexistence and interrelationship between protein-energy malnutrition and chronic low-grade inflammation in PD patients further exacerbate the risk of mortality in this population [11]. Therefore, a comprehensive and accurate early assessment of nutritional and inflammatory status, aimed at screening and identifying high-risk individuals, is crucial for optimizing interventions and improving prognostic management.
To assess these factors, several tools have been developed. Among them, the controlled nutritional risk (CONUT) score and the prognostic nutritional index (PNI) are widely used [12]. The CONUT score evaluates nutritional status based on serum albumin, total cholesterol, and lymphocyte count, while the PNI combines serum albumin and peripheral blood lymphocyte count to assess immune function and inflammation levels [13,14]. Despite considering similar serum-based markers, the prognostic effects of CONUT score and PNI in PD patients show some inconsistent results, and a more reliable indicator is needed for widespread adoption of these nutritional indicators.
In recent years, the Nutritional-Inflammatory Complex Score (NICS) method has emerged as a promising tool for prognostic evaluation by combining nutritional and inflammatory markers to assess patient outcomes [15,16]. Building on this concept, our study introduces the P-CONUT score, a composite measure that integrates the CONUT and PNI scores, specifically designed for PD patients. This study aims to evaluate the prognostic value of the P-CONUT score, particularly in predicting all-cause mortality in PD patients, through a retrospective analysis.
In conclusion, this study seeks to enhance the predictive accuracy of mortality risk in PD patients by introducing the P-CONUT score, a novel composite measure that integrates nutritional and inflammatory markers. By focusing on both nutritional and inflammatory status, this score provides a more comprehensive tool for risk stratification in PD patients, addressing the limitations of existing scoring systems. The findings of this study could contribute to improved clinical decision-making, enabling early identification of high-risk individuals and more targeted interventions, ultimately aiming to improve long-term survival and quality of life for PD patients.
Materials and methods
1. Study population and design
This retrospective observational cohort study was conducted at West China Hospital, Sichuan University. We enrolled patients who had initial peritoneal dialysis (PD) between June 2, 2010, and December 31, 2017. These patients were monitored from the initiation of dialysis until June 30, 2023, or their last recorded clinical visit. Exclusion criteria included patients under 18 years of age, those diagnosed with breast, lung, gastrointestinal, or hematologic cancers, and those with incomplete data. After applying these criteria, a total of 810 patients were included in the final analysis.
The study was conducted in accordance with the ethical principles outlined in the Declaration of Helsinki and its subsequent amendments. Approval was obtained from the Biomedical Ethics Review Committee of West China Hospital, Sichuan University (protocol code: 2019–793), and all participants provided written informed consent. The authors did not have access to identifiable information about individual participants before or after data collection.
2. Data collection and measurements
2.1. Data collection.
Clinical and laboratory data were collected from individual medical records at the initiation of dialysis. These included demographic information (age, sex), the cause of end-stage renal disease (ESRD), systolic and diastolic blood pressure, hemoglobin, uric acid, total cholesterol, LDL/HDL cholesterol, triglycerides, glutamic oxaloacetic transaminase (AST), alanine transaminase (ALT), total protein, blood glucose, blood urea, serum potassium, calcium, albumin, total lymphocyte count, and globulin levels. Blood tests were conducted to calculate the CONUT score and PNI within one month prior to the initiation of dialysis.
2.2. Calculations of CONUT score, PNI and P-CONUT
The CONUT score was calculated based on serum albumin (g/dL), total lymphocyte count (count/mm³), and total cholesterol (mg/dL), as detailed in Supplementary S1 Table. The PNI was calculated using the following formula: 10 × serum albumin (g/dL) + 0.005 × total peripheral lymphocyte count (µL). Cutoff values for both CONUT and PNI were determined using the X-tile program, a tool designed to identify optimal cutoff points through statistical tests. The results are presented in S1 Fig. The program evaluated all possible divisions of the marker data, calculating associations at each division. The log-rank test was used for survival analysis, and the mean test assessed relationships with other markers. Optimal cutoff values were identified by maximizing the chi-squared value across potential divisions, enabling the stratification of patients into low or high CONUT and PNI groups.
“P-CONUT” was defined by integrating the CONUT score and PNI, based on previously established criteria. Patients were classified into three P-CONUT groups: G1 (high CONUT [5–12] and low PNI [≤38.6]), G2 (low CONUT [0–4] and high PNI [>38.6]), and G3 (high CONUT [5–12] and high PNI [>38.6]). Notably, no patients were classified as low CONUT (0–4) and low PNI (≤38.6).
2.3. Follow up
Follow-up was conducted through phone interviews and a review of medical records, with the study concluding in June 2023. Patients who transferred from West China Hospital were censored at their last known contact date. For overall survival (OS) analysis, patients who were still alive as of June 30, 2023, were censored. OS was defined as the time from dialysis initiation to death from any cause. The primary endpoint of the study was all-cause mortality. Follow-up continued for all patients until either June 2023 or the time of death.
3. Statistical analyses
Statistical analyses were performed using SPSS version 27.0 and R version 4.4.0. The Kolmogorov-Smirnov test was used to assess the normality of continuous variables. Normally distributed data are presented as mean ± standard deviation, while non-normally distributed data are expressed as median (interquartile range). Continuous variables were compared using the Independent Samples t-test or the Mann-Whitney U test, as appropriate. Categorical variables were analyzed using the chi-square test or Fisher’s exact test.
Kaplan-Meier survival curves were generated to estimate overall survival (OS) rates, with differences assessed using the log-rank test. Cox proportional hazards regression models were used to identify independent predictors of all-cause mortality. Variables with p-values < 0.05 in univariate analysis were included in multivariable models, which were constructed using backward stepwise selection to identify independent risk factors for OS. Given potential interactions among the CONUT score, PNI, and P-CONUT, three separate multivariable models were developed, each including one of these variables.
The predictive performance of CONUT, PNI, and P-CONUT for OS was compared using the integrated area under the curve (iAUC) to assess time-dependent discriminatory ability. Additionally, net reclassification improvement (NRI) and integrated discrimination improvement (IDI) were used to evaluate the incremental predictive value of P-CONUT over CONUT and PNI.
Decision Curve Analysis (DCA) was performed to assess the clinical utility of CONUT, PNI, and P-CONUT. DCA compares the net benefit (NB) of using each model at various risk thresholds, considering the trade-off between true positives and false positives. NB was calculated across a range of threshold probabilities, with higher net benefits indicating better clinical decision-making performance. DCA provides insight into the clinical value of each model by evaluating its impact on patient outcomes.
A p-value < 0.05 was considered statistically significant. A nomogram was constructed based on significant prognostic factors, including P-CONUT, to aid in predicting PD patient outcomes.
Results
1. Clinical characteristics
The median follow-up period was 9.05 years (range, 5.52–13.08 years). A total of 810 patients were included (see Supplementary S2 Fig). Patient characteristics are summarized in Table 1. Based on CONUT score classification, 252 patients (31.1%) were in the low-CONUT group and 558 (68.9%) into the high-CONUT group. For the PNI scores, 212 patients (26.2%) were classified into the low-PNI group, while 598 patients (73.8%) were classified into the high-PNI group. Detailed characteristics of the patients across the CONUT and PNI groups are provided in Tables 2 and 3.
Table 1: Demographic and baseline characteristic of peritoneal dialysis patients (n = 810).
Table 2: Characteristic in patients with different CONUT score.
Table 3: Characteristic in patients with different PNI score.
2 Kaplan–Meier survival curves according to the CONUT, PNI, and P-CONUT
Kaplan–Meier survival curves for CONUT, PNI, and P-CONUT are shown in Fig 1. For CONUT (Fig 1a), the 5-year overall survival (OS) rates were 88.5% for the low-CONUT group and 83.0% for the high-CONUT group (p = 0.012). For PNI (Fig 1b), the 5-year OS rates were 73.1% for the low-PNI group and 88.8% for the high-PNI group (p < 0.001). The P-CONUT survival curves (Fig 1c) demonstrated significant differences, with 5-year OS rates of 73.1%, 88.1%, and 89.0% for groups G1, G2, and G3, respectively (p < 0.001).
Kaplan–Meier survival curves based on the CONUT scores, PNI, and P-CONUT.Figure 1a shows the Kaplan-Meier survival curve according to CONUT. Figure 1b shows the Kaplan-Meier survival curves based on the PNI. Figure 1c shows the Kaplan-Meier survival curve according to P-CONUT.
3. Cox regression modeling process
Univariable analysis identified several factors significantly associated with OS, including age (p < 0.001), diabetes (p < 0.001), glomerulonephritis (p = 0.001), diastolic blood pressure (p < 0.001), albumin-to-globulin ratio (p < 0.001), and blood glucose (p = 0.027). CONUT, PNI, and P-CONUT scores were also significant prognostic indicators, with G2 vs. G1 and G3 vs. G1 groups showing strong significance (both p < 0.001) (Table 4). After multivariable adjustment using backward selection, independent predictors of OS included age, albumin-to-globulin ratio, CONUT (HR = 1.478, 95% CI: 1.012–2.159, p = 0.043), PNI (HR = 2.688, 95% CI: 1.972–3.666, p < 0.001), and P-CONUT [G2 vs. G1: HR = 0.354, 95% CI: 0.238–0.528, p < 0.001; G3 vs. G1: HR = 0.385, 95% CI: 0.270–0.549, p < 0.001] (Table 5, Fig 2). Although diabetes did not reach statistical significance, it was included in the model due to its clinical relevance in predicting mortality risk.
Table 4: Univariable analysis associated with the overall survival (n = 810).
Table 5: Multivariable analysis associated with the overall survival (n = 810).
Cox regression forest plots associated with overall survival (n = 810). The figure presents forest plots of Cox regression models assessing factors associated with overall survival in peritoneal dialysis (PD) patients. Three models are shown: Model 1 (CONUT), Model 2 (PNI), and Model 3 (P-CONUT). Each plot displays the beta coefficients with corresponding confidence intervals for variables including age, diabetes, glomerulonephritis, diastolic blood pressure, albumin-to-globulin ratio, blood glucose, and nutritional-inflammatory indices (CONUT, PNI, and P-CONUT). Colored dots represent individual variables, with black dots indicating statistically significant associations (p ≤ 0.05) and open circles denoting non-significant results (p > 0.05). Negative beta values suggest a protective effect, while positive beta values indicate an increased risk of mortality.
4. Comparison of integrated AUC and Incremental predictive value of P-CONUT
The AUC for CONUT in predicting all-cause mortality was 0.611 (95% CI: 0.561–0.661), with a sensitivity of 41.5% and specificity of 78.3%. The AUC for PNI was 0.636 (95% CI: 0.587–0.686), with a sensitivity of 65.2% and specificity of 59.0%. The P-CONUT model demonstrated the highest predictive performance, with an AUC of 0.790 (95% CI: 0.751–0.829), sensitivity of 79.9%, and specificity of 68.1%. The time-dependent ROC curve for P-CONUT outperformed both CONUT (bootstrap iAUC mean difference = 0.000; 95% CI: 0.127–0.231) and PNI (bootstrap iAUC mean difference = 0.000; 95% CI: 0.103–0.205) over the follow-up period (Fig 3).
The time-dependent receiver operating characteristic curve of P-CONUT, CONUT score and PNI.This figure presents the time-dependent ROC curves for P-CONUT (green line), PNI (red line), and CONUT (blue line), illustrating their ability to predict overall survival in peritoneal dialysis (PD) patients. The x-axis represents 1 - specificity, and the y-axis represents sensitivity. The diagonal gray line represents the reference line (AUC = 0.5), indicating no discriminatory ability. P-CONUT demonstrates the highest area under the curve (AUC), suggesting superior prognostic performance compared to PNI and CONUT.
The enhancement effect of P-CONUT was further evaluated using the NRI and IDI. Compared to the CONUT score, the NRI value for P-CONUT was 0.331 (95% CI: 0.156–0.408) and the IDI value was 0.111 (95% CI: 0.011–0.145). Compared to the PNI score, the NRI for P-CONUT was 0.357 (95% CI: 0.221–0.428) and the IDI was 0.112 (95% CI: 0.018–0.149) (Table 6). These results suggest that the P-CONUT model has superior ability in predicting survival outcomes in PD patients.
Table 6: Comparison of NRI and IDI among three models.
5. DCA for CONUT, PNI, and P-CONUT
DCA was conducted to assess the clinical utility of the CONUT, PNI, and P-CONUT scores (Fig 4). The results demonstrated that, for patients with a high-risk threshold ranging from 9% to 66%, P-CONUT consistently provided a greater net benefit (NB) compared to the strategies of treating all patients or treating none. Notably, P-CONUT, as a composite score integrating both CONUT and PNI, outperformed both individual scores (CONUT and PNI) across all risk thresholds, highlighting its superior prognostic value for predicting mortality risk in PD patients.
Decision Curve Analysis (DCA) Comparing the Clinical Utility of P-CONUT, CONUT, and PNI for Predicting Mortality in Peritoneal Dialysis Patients.This figure presents the decision curve analysis (DCA) comparing the net clinical benefit of P-CONUT (green line), PNI (blue line), and CONUT (red line) in predicting mortality risk in peritoneal dialysis (PD) patients. The x-axis represents the high-risk threshold, while the y-axis represents the net benefit. The analysis demonstrates that P-CONUT consistently provides a higher net benefit across a wide range of risk thresholds compared to PNI and CONUT, suggesting its superior clinical utility in risk stratification and decision-making.
6. Predictive nomogram for P-CONUT
A nomogram was constructed using significant prognostic factors for predicting adverse outcomes in PD patients (Fig 5). The included predictors were glomerulonephritis, diabetes, blood glucose, diastolic blood pressure, albumin-to-globulin ratio, P-CONUT, and age. Each predictor was assigned a score on the nomogram scale, and the total score correlated with the predicted odds of adverse outcomes. Glomerulonephritis and diabetes were binary variables, while blood glucose, diastolic blood pressure, and albumin-to-globulin ratio were continuous variables. Lower P-CONUT values reflected better nutritional status. Age was a significant risk factor, with older patients having a higher risk. The total score provided an estimate of the likelihood of an adverse event.
Nomogram for Predicting Prognosis in Initial Dialysis Patients with Chronic Kidney Disease Based on P-CONUT and Clinical Variables.This nomogram was developed to predict prognosis in peritoneal dialysis (PD) patients using P-CONUT and other significant clinical variables. The included predictors are glomerulonephritis, diabetes, blood glucose, diastolic blood pressure, albumin-to-globulin ratio, P-CONUT, and age. Each variable is assigned a corresponding score on the Points scale, and the total score is calculated by summing the individual scores. The total points correspond to the predicted odds of adverse outcomes, as indicated on the Odds scale at the bottom. The nomogram provides a visual tool for individualized risk assessment, facilitating clinical decision-making and early intervention strategies in PD patients.
Discussion
This study aimed to evaluate and compare the prognostic value of three nutritional-inflammatory indicators—CONUT, PNI, and P-CONUT—in predicting all-cause mortality in PD patients. The mortality risk in PD patients is strongly influenced by their nutritional and inflammatory status. While CONUT and PNI are widely used in clinical practice, their individual predictive accuracy is limited. To address this limitation, we developed the P-CONUT score, a composite index that integrates CONUT and PNI to provide a more comprehensive assessment of nutritional and inflammatory status. Our findings demonstrated that P-CONUT outperformed CONUT and PNI, with significantly higher AUC, NRI, and IDI values. Furthermore, the development of a nomogram based on P-CONUT offers an effective clinical tool for individualized risk stratification and decision-making.
Previous studies have underscored the importance of nutritional and inflammatory status in predicting outcomes among PD patients [17–19]. The CONUT score, which incorporates serum albumin, total lymphocyte count, and cholesterol levels, has been associated with adverse outcomes in both CKD and PD populations [20]. Similarly, the PNI, derived from serum albumin and lymphocyte count, reflects inflammatory status and has been reported to predict survival in PD patients [21,22]. In our study, the PNI demonstrated a stronger association with overall survival than the CONUT score, aligning with prior research that identified PNI as a critical prognostic factor in PD patients [23]. However, our results stand in contrast to the findings of Yang Y et al., who reported that the CONUT score was a better predictor of outcomes than PNI in PD patients [24]. The discrepancy between our results and theirs may be attributable to several factors, including differences in the cutoff values used for each variable, variations in sample sizes, and the inclusion of patients at different stages of disease progression [25,26]. These differences underscore the need for further research to explore how these factors impact the predictive value of nutritional indices in PD patients.
While both CONUT and PNI provide valuable prognostic information, they independently assess either nutritional depletion or inflammatory response but fail to comprehensively integrate both aspects. The P-CONUT score addresses this gap by combining the strengths of CONUT and PNI into a unified index, offering a more holistic assessment of MICS.
Statistical evaluation of P-CONUT confirmed its robustness. For instance, P-CONUT achieved an AUC of 0.790 (95% CI: 0.751–0.829), significantly higher than CONUT (0.611; 95% CI: 0.561–0.661) and PNI (0.636; 95% CI: 0.587–0.686).These findings are consistent with previous studies showing that composite scores combining nutritional and inflammatory parameters, such as the comprehensive systemic inflammatory response index and nutritional parameters such as albumin and height, are superior to individual markers in predicting patient outcomes [27,28]. However, the P-CONUT score uniquely integrates CONUT and PNI, offering a tailored tool specifically for PD populations. Alongside superior AUC values, P-CONUT showed significant improvements in NRI and IDI, indicating better reclassification and discrimination of mortality risk compared to CONUT and PNI. For example, the NRI for P-CONUT relative to CONUT was 0.331 (95% CI: 0.156–0.408) and 0.357 (95% CI: 0.221–0.428) relative to PNI, while the corresponding IDI values were 0.111 (95% CI: 0.011–0.145) and 0.112 (95% CI: 0.018–0.149), respectively.
In this study, high P-CONUT scores were strongly associated with increased mortality risk, underscoring its potential clinical value. By capturing both nutritional depletion and inflammatory response, P-CONUT provides a more holistic assessment of patients’ overall health status, which is particularly relevant in PD care. Patients with high P-CONUT scores demonstrated worse 5-year survival rates compared to those with lower scores, highlighting its ability to stratify patients based on mortality risk. DCA further demonstrated that P-CONUT provided greater net clinical benefit across a range of risk thresholds, emphasizing its practical applicability in optimizing treatment decisions.
The clinical utility of P-CONUT lies in its ability to guide targeted interventions. High-risk patients identified by P-CONUT could benefit from early nutritional support, such as dietary adjustments or supplementation, and strategies to reduce inflammation, including optimizing dialysis prescriptions or using anti-inflammatory therapies [29–31]. Moreover, P-CONUT can inform broader care strategies, such as adjusting dialysis modalities, managing comorbidities, or increasing the frequency of patient monitoring [32,33]. These interventions could lead to improved survival outcomes and better resource allocation in clinical practice.
To support clinical application, we developed a nomogram that incorporates the P-CONUT score along with other significant prognostic factors, such as age, diabetes, and blood pressure. This nomogram provides a user-friendly tool for risk assessment, enabling clinicians to predict patient outcomes and customize treatment plans accordingly. By integrating evidence-based data into clinical decision-making, the nomogram enhances communication with patients and their families, supporting discussions on prognosis and treatment options. This approach ensures that care plans are tailored to align with individual patient values and preferences.
Despite its promising findings, this study has several limitations. First, this was a single-center retrospective study, and the patients in our study were generally younger and had fewer coexisting conditions, such as diabetes, which may limit the generalizability of our findings to other patient populations. Second, we only evaluated patient data at the initiation of dialysis and did not analyze how changes in nutritional status post-dialysis might affect prognosis. Future prospective studies are needed to assess the longitudinal impact of PNI and CONUT scores on patient outcomes. Lastly, while P-CONUT demonstrated improved predictive accuracy, further research is required to compare its utility with other emerging prognostic tools and validate its implementation in diverse clinical settings.
Conclusions
In conclusion, this study highlights the critical role of nutritional and inflammatory status in predicting mortality risk among PD patients. The P-CONUT score, as a composite indicator of these factors, provides superior prognostic value compared to individual markers, offering a practical tool for risk stratification and personalized care. By integrating P-CONUT into clinical workflows, healthcare providers can better identify high-risk patients, implement timely interventions, and ultimately improve long-term outcomes for PD populations.
Supporting information
S1 FigDefining optimal cut-off value for PNI and CONUT using X-tile program.(A) PNI: X-tile plots (left) and histogram (right) demonstrating the optimal cutoff value for Prognostic Nutritional Index (PNI). The left panel visualizes the population distribution, where green and red areas represent high and low subpopulations, respectively. The right panel displays the frequency distribution of PNI scores, with the optimal cutoff point marked.(B) CONUT: Similar X-tile plots (left) and histogram (right) illustrating the optimal cutoff determination for Controlling Nutritional Status (CONUT) score. The left panel shows the stratification of patients into low- and high-risk groups, while the right panel presents the corresponding frequency distribution. These cutoff values were determined to maximize prognostic discrimination for survival analysis in peritoneal dialysis patients.(TIF)
S2 FigFlowchart of patient selection for the study cohort.The diagram illustrates the inclusion and exclusion process for peritoneal dialysis (PD) patients enrolled in the study. A total of 861 patients initiated PD between June 2010 and December 2017. After excluding 30 patients who transferred to other PD centers or were lost to follow-up and 14 patients diagnosed with tumors, 817 patients remained. Subsequently, 7 patients without available CONUT or PNI data were further excluded, resulting in a final study cohort of 810 patients included in the analysis.(TIF)
S1 TableCONUT scoring system.The Controlling Nutritional Status (CONUT) score is calculated based on serum albumin level, total cholesterol level, and total lymphocyte count. Each component is assigned a score according to predefined ranges. The total CONUT score ranges from 0 to 12 and reflects the degree of nutritional impairment: 0–1 = normal, 2–4 = mild, 5–8 = moderate, and 9–12 = severe malnutrition.(DOCX)
The reference list from the paper itself. Each links out to its DOI / PubMed record.
- 1Ye H, Liu R, Cao P, Guo Q, Chen W, Mao H, et al. Peritoneal protein clearance, fluid overload, and cardiovascular events in patients undergoing peritoneal dialysis: a prospective cohort study. Ren Fail. 2025;47(1):2461676. doi: 10.1080/0886022 X.2025.2461676 39962729 PMC 11837914 · doi ↗ · pubmed ↗
- 2Pecoits-Filho R, Okpechi IG, Donner J-A, Harris DCH, Aljubori HM, Bello AK, et al. Capturing and monitoring global differences in untreated and treated end-stage kidney disease, kidney replacement therapy modality, and outcomes. Kidney Int Suppl (2011). 2020;10(1):e 3–9. doi: 10.1016/j.kisu.2019.11.001 32149004 PMC 7031690 · doi ↗ · pubmed ↗
- 3Hu Y-H, Liu Y-L, Meng L-F, Zhang Y-X, Cui W-P. Selection of dialysis methods for end-stage kidney disease patients with diabetes. World J Diabetes. 2024;15(9):1862–73. doi: 10.4239/wjd.v 15.i 9.1862 39280188 PMC 11372645 · doi ↗ · pubmed ↗
- 4Flythe JE, Watnick S. Dialysis for Chronic Kidney Failure: A Review. JAMA. 2024;332(18):1559–73. doi: 10.1001/jama.2024.16338 39356511 · doi ↗ · pubmed ↗
- 5Sikhipha TB, Barrett C, van Zyl N, van Rooyen C, Bisiwe FB. Continuous ambulatory peritoneal dialysis technique failure in adult patients treated at a tertiary hospital in central South Africa: a retrospective analytical study. BMC Nephrol. 2025;26(1):4. doi: 10.1186/s 12882-024-03927-x 39748288 PMC 11697809 · doi ↗ · pubmed ↗
- 6Markaki A, Gkouskou K, Ganotakis E, Margioris A, Daphnis E. A longitudinal study of nutritional and inflammatory status in patients on dialysis. J Ren Care. 2014;40(1):14–22. doi: 10.1111/jorc.12048 24467473 · doi ↗ · pubmed ↗
- 7Wang D, Yin J, Liao W, Feng X, Zhang F. GLIM criteria for definition of malnutrition in peritoneal dialysis: a new aspect of nutritional assessment. Ren Fail. 2024;46(1):2337290. doi: 10.1080/0886022 X.2024.2337290 38575339 PMC 10997366 · doi ↗ · pubmed ↗
- 8Rashid I, Sahu G, Tiwari P, Willis C, Asche CV, Bagga TK, et al. Malnutrition as a potential predictor of mortality in chronic kidney disease patients on dialysis: A systematic review and meta-analysis. Clin Nutr. 2024;43(7):1760–9. doi: 10.1016/j.clnu.2024.05.037 38852509 · doi ↗ · pubmed ↗