Commercial price variation for common imaging studies
Alexander P Philips, Christopher Whaley

TL;DR
The study finds large price differences for imaging studies under commercial insurance, with facility fees showing much more variation than professional fees.
Contribution
The study leverages newly available insurer data to quantify price variation in imaging reimbursement across major commercial insurers.
Findings
Facility fees showed 3 to 6 times more variation than professional fees.
Price variation was inconsistent across different insurers.
Geographic differences in facility fees were significant at the state level.
Abstract
Commercial insurance payment rates for imaging studies have significant price variation, yet understanding this variation has been limited by lack of transparency and data limitations. Using newly available Transparency-in-Coverage insurer-posted data on negotiated rates, we analyzed price variation for the 2023 contract year across four major commercial insurers (Blue Cross Blue Shield, United, Cigna, and Aetna) for 30 imaging studies. Our analysis encompassed 12.7 million professional fee price points and 239 969 facility fee price points. Our analysis revealed substantial variation in reimbursement rates. Key findings include greater variation in facility fees compared to professional fees, with facility coefficients of variation often 3 to 6 times higher than professional components. There was also substantial and inconsistent variation by payer. Geographic analysis revealed…
Genes, proteins, chemicals, diseases, species, mutations and cell lines named across the full text — each resolved to its canonical identifier and authoritative record.
Click any figure to enlarge with its caption.
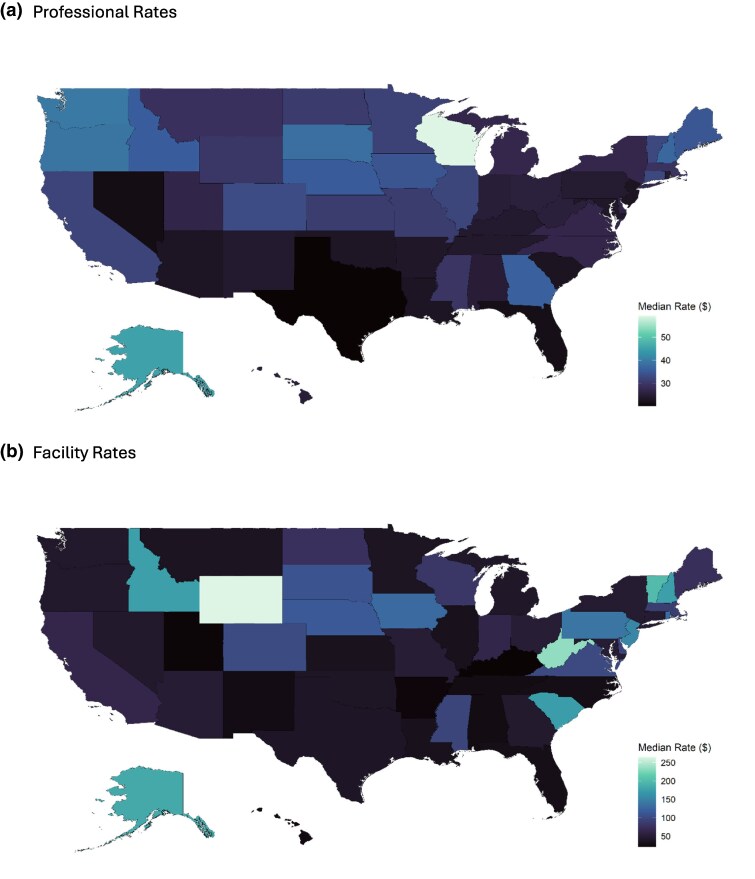 Figure 1
| Procedure category | CPT code description | CPT code | Professional fees | Facility fees | ||||
|---|---|---|---|---|---|---|---|---|
| Mean (SD) | Median (IQR) | Coef of variation | Mean (SD) | Median (IQR) | Coef of variation | |||
| CT scan | Head/brain scan without contrast | 70 450 | 190 (164) | 144 (100–225) | 0.86 | 574 (1148) | 292 (178–670) | 2 |
| Chest scan without contrast | 71 250 | 244 (205) | 183 (129–288) | 0.84 | 624 (1209) | 334 (205–704) | 1.94 | |
| Chest scan with contrast | 71 260 | 303 (261) | 226 (162–345) | 0.86 | 705 (1096) | 468 (280–832) | 1.56 | |
| Chest blood vessel scan (angiography) | 71 275 | 434 (373) | 319 (237–480) | 0.86 | 854 (1162) | 569 (356–1084) | 1.36 | |
| Abdomen and pelvis scan without contrast | 74 176 | 283 (224) | 212 (162–324) | 0.79 | 785 (1330) | 496 (282–914) | 1.69 | |
| Abdomen and pelvis scan with contrast | 74 177 | 445 (382) | 336 (245–508) | 0.86 | 1042 (1329) | 730 (458–1245) | 1.28 | |
| Mammogram | 3D breast imaging (tomosynthesis), both breasts | 77 063 | 69 (47) | 55 (42–76) | 0.68 | 237 (1573) | 63 (40–109) | 6.63 |
| Diagnostic mammogram with computer analysis, one breast | 77 065 | 160 (115) | 127 (96–179) | 0.72 | 374 (1415) | 195 (124–307) | 3.79 | |
| Diagnostic mammogram with computer analysis, both breasts | 77 066 | 202 (146) | 159 (121–227) | 0.72 | 435 (1453) | 236 (150–371) | 3.34 | |
| Screening mammogram with computer analysis, both breasts | 77 067 | 167 (125) | 131 (98–184) | 0.75 | 361 (1387) | 192 (123–305) | 3.84 | |
| MRI scan | Brain MRI with and without contrast | 70 553 | 619 (561) | 447 (299–697) | 0.91 | 1210 (1557) | 792 (515–1487) | 1.29 |
| Lower back (lumbar spine) MRI without contrast | 72 148 | 380 (330) | 278 (191–451) | 0.87 | 920 (1283) | 570 (348–1107) | 1.4 | |
| Lower extremity joint MRI without contrast | 73 721 | 375 (306) | 283 (196–442) | 0.82 | 940 (1356) | 582 (367–1126) | 1.44 | |
| Ultrasound | Head and neck ultrasound | 76 536 | 139 (113) | 108 (78–153) | 0.82 | 341 (1342) | 167 (111–286) | 3.94 |
| Complete breast ultrasound | 76 641 | 128 (90) | 101 (78–147) | 0.7 | 391 (1580) | 195 (120–304) | 4.04 | |
| Limited breast ultrasound | 76 642 | 115 (83) | 89 (68–132) | 0.73 | 352 (1601) | 158 (90–260) | 4.55 | |
| Complete abdominal ultrasound | 76 700 | 156 (125) | 120 (92–172) | 0.8 | 348 (1311) | 176 (116–301) | 3.76 | |
| Limited abdominal ultrasound | 76 705 | 117 (92) | 90 (70–129) | 0.79 | 294 (1208) | 141 (91–266) | 4.11 | |
| Transvaginal ultrasound (nonobstetric) | 76 830 | 145 (121) | 112 (83–160) | 0.84 | 336 (1314) | 174 (110–304) | 3.91 | |
| Complete pelvic ultrasound | 76 856 | 138 (114) | 106 (79–151) | 0.83 | 312 (1124) | 165 (105–292) | 3.6 | |
| X-ray | Chest X-ray, single view | 71 045 | 32 (28) | 24 (17–35) | 0.87 | 160 (1029) | 48 (25–119) | 6.41 |
| Chest X-ray, two views | 71 046 | 43 (36) | 32 (25–50) | 0.83 | 197 (1253) | 66 (36–142) | 6.36 | |
| Lower spine X-ray, 2–3 views | 72 100 | 49 (44) | 37 (28–54) | 0.9 | 217 (1584) | 66 (40–153) | 7.31 | |
| Shoulder X-ray | 73 030 | 42 (35) | 32 (24–47) | 0.84 | 162 (1044) | 56 (36–120) | 6.44 | |
| Hand X-ray | 73 130 | 43 (35) | 33 (24–49) | 0.81 | 211 (1332) | 61 (38–123) | 6.31 | |
| Knee X-ray, three views | 73 562 | 48 (41) | 37 (27–55) | 0.85 | 204 (1192) | 75 (38–140) | 5.85 | |
| Ankle X-ray | 73 610 | 44 (40) | 33 (25–49) | 0.92 | 193 (1257) | 61 (38–123) | 6.53 | |
| Foot X-ray | 73 630 | 42 (36) | 32 (24–46) | 0.86 | 153 (949) | 58 (36–119) | 6.21 | |
| Abdominal X-ray, single view | 74 018 | 38 (31) | 29 (22–42) | 0.82 | 207 (1337) | 61 (34–129) | 6.45 | |
| Bone density scan (DXA), spine/hips | 77 080 | 70 (63) | 53 (32–86) | 0.9 | 299 (1455) | 105 (54–226) | 4.86 | |
| Payer | Professional Price Indices | |||||
|---|---|---|---|---|---|---|
| CT scan | MRI scan | Mammogram | Ultrasound | X-ray | Overall | |
| All Four Payers | 1 | 1 | 1 | 1 | 1 | 1 |
| Aetna | 0.76 | 0.68 | 0.78 | 0.71 | 0.74 | 0.75 |
| Blue Cross Blue Shield | 1.12 | 1.13 | 1.08 | 1.11 | 1.1 | 1.11 |
| Cigna | 0.71 | 0.82 | 0.78 | 0.76 | 0.72 | 0.75 |
| United Healthcare | 0.96 | 0.92 | 1 | 1 | 0.99 | 0.97 |
| Procedure category | Code description | Service code | Payer | Unique price points | Unique providers | Professional fees | Facility fees | ||||||
|---|---|---|---|---|---|---|---|---|---|---|---|---|---|
| Mean (SD) | Median (IQR) | Ratio of 75th to 25th %tiles | Coef of variation | Mean (SD) | Median (IQR) | Ratio of 75th to 25th %tiles | Coef of variation | ||||||
| CT scan | Head/Brain scan without contrast | 70 450 | All Four Payers | 520 237 | 26 387 | 190 (164) | 144 (100–225) | 2.25 | 0.86 | 574 (1148) | 292 (178–670) | 3.76 | 2 |
| Aetna | 62 618 | 13 794 | 136 (108) | 103 (71–164) | 2.31 | 0.79 | 506 (552) | 257 (125–700) | 5.61 | 1.09 | |||
| BlueCross BlueShield | 297 519 | 24 212 | 217 (177) | 162 (108–266) | 2.46 | 0.82 | 773 (1771) | 462 (238–777) | 3.27 | 2.29 | |||
| Cigna | 56 008 | 18 599 | 141 (74) | 129 (89–175) | 1.96 | 0.53 | 364 (318) | 238 (170–501) | 2.95 | 0.87 | |||
| UnitedHealthcare | 104 092 | 19 657 | 174 (169) | 141 (105–200) | 1.92 | 0.97 | 273 (59) | 281 (281–281) | 1 | 0.22 | |||
| Chest scan without contrast | 71 250 | All Four Payers | 513 670 | 26 757 | 244 (205) | 183 (129–288) | 2.24 | 0.84 | 624 (1209) | 334 (205–704) | 3.44 | 1.94 | |
| Aetna | 63 132 | 14 021 | 166 (126) | 126 (91–186) | 2.04 | 0.76 | 537 (551) | 303 (156–742) | 4.77 | 1.03 | |||
| BlueCross BlueShield | 295 558 | 24 560 | 278 (236) | 206 (141–316) | 2.23 | 0.85 | 828 (1823) | 491 (262–795) | 3.04 | 2.2 | |||
| Cigna | 56 070 | 18 763 | 184 (94) | 169 (117–227) | 1.94 | 0.51 | 435 (307) | 304 (255–628) | 2.46 | 0.7 | |||
| UnitedHealthcare | 98 910 | 19 309 | 227 (165) | 187 (126–270) | 2.15 | 0.73 | 297 (67) | 313 (313–313) | 1 | 0.23 | |||
| Chest scan with contrast | 71 260 | All Four Payers | 517 772 | 27 096 | 303 (261) | 226 (162–345) | 2.13 | 0.86 | 705 (1096) | 468 (280–832) | 2.97 | 1.56 | |
| Aetna | 62 965 | 14 079 | 210 (175) | 159 (114–233) | 2.04 | 0.83 | 569 (532) | 372 (201–762) | 3.79 | 0.94 | |||
| BlueCross BlueShield | 299 007 | 24 945 | 343 (304) | 254 (181–381) | 2.11 | 0.89 | 980 (1675) | 660 (409–1047) | 2.56 | 1.71 | |||
| Cigna | 56 501 | 18 996 | 222 (115) | 205 (144–273) | 1.9 | 0.52 | 497 (315) | 375 (285–707) | 2.48 | 0.63 | |||
| UnitedHealthcare | 99 299 | 19 626 | 286 (183) | 235 (170–344) | 2.03 | 0.64 | 450 (111) | 468 (468–468) | 1 | 0.25 | |||
| Chest blood vessel scan (angiography) | 71 275 | All Four Payers | 493 663 | 25 502 | 434 (373) | 319 (237–480) | 2.03 | 0.86 | 854 (1162) | 569 (356–1084) | 3.05 | 1.36 | |
| Aetna | 59 886 | 13 330 | 283 (209) | 214 (160–310) | 1.94 | 0.74 | 711 (632) | 494 (275–990) | 3.61 | 0.89 | |||
| BlueCross BlueShield | 285 981 | 23 486 | 488 (433) | 349 (260–514) | 1.98 | 0.89 | 1086 (1643) | 725 (461–1236) | 2.68 | 1.51 | |||
| Cigna | 53 735 | 17 829 | 335 (171) | 320 (217–404) | 1.87 | 0.51 | 714 (336) | 633 (542–857) | 1.58 | 0.47 | |||
| UnitedHealthcare | 94 061 | 18 412 | 425 (292) | 350 (247–509) | 2.06 | 0.69 | 396 (181) | 375 (272–500) | 1.83 | 0.46 | |||
| Abdomen and pelvis scan without contrast | 74 176 | All Four Payers | 501 607 | 26 344 | 283 (224) | 212 (162–324) | 2 | 0.79 | 785 (1330) | 496 (282–914) | 3.24 | 1.69 | |
| Aetna | 60 638 | 13 657 | 240 (177) | 170 (147–266) | 1.81 | 0.74 | 629 (617) | 399 (226–833) | 3.68 | 0.98 | |||
| BlueCross BlueShield | 293 786 | 24 279 | 316 (257) | 239 (175–347) | 1.98 | 0.81 | 1038 (1964) | 620 (388–1066) | 2.75 | 1.89 | |||
| Cigna | 52 078 | 17 796 | 194 (98) | 170 (137–219) | 1.59 | 0.51 | 531 (314) | 409 (350–707) | 2.02 | 0.59 | |||
| UnitedHealthcare | 95 105 | 18 668 | 260 (158) | 217 (159–314) | 1.98 | 0.61 | 502 (262) | 462 (351–599) | 1.71 | 0.52 | |||
| Abdomen and pelvis scan with contrast | 74 177 | All Four Payers | 537 560 | 28 433 | 445 (382) | 336 (245–508) | 2.07 | 0.86 | 1042 (1329) | 730 (458–1245) | 2.72 | 1.28 | |
| Aetna | 64 600 | 14 601 | 367 (253) | 267 (227–415) | 1.83 | 0.69 | 841 (704) | 631 (364–1129) | 3.11 | 0.84 | |||
| BlueCross BlueShield | 314 438 | 26 241 | 489 (425) | 357 (264–538) | 2.03 | 0.87 | 1335 (1860) | 913 (555–1557) | 2.8 | 1.39 | |||
| Cigna | 55 394 | 19 227 | 297 (161) | 265 (201–346) | 1.72 | 0.54 | 767 (346) | 707 (591–1144) | 1.94 | 0.45 | |||
| UnitedHealthcare | 103 128 | 20 498 | 439 (368) | 363 (238–535) | 2.25 | 0.84 | 750 (418) | 654 (443–978) | 2.21 | 0.56 | |||
| Mammogram | 3D breast imaging (tomosynthesis), both breasts | 77 063 | All Four Payers | 268 059 | 16 178 | 69 (47) | 55 (42–76) | 1.8 | 0.68 | 237 (1573) | 63 (40–109) | 2.72 | 6.63 |
| Aetna | 31 570 | 7614 | 54 (38) | 39 (34–56) | 1.67 | 0.71 | 83 (65) | 61 (40–105) | 2.66 | 0.79 | |||
| BlueCross BlueShield | 155 123 | 14 798 | 75 (53) | 59 (47–82) | 1.74 | 0.71 | 449 (2393) | 69 (45–124) | 2.74 | 5.33 | |||
| Cigna | 27 509 | 10 707 | 53 (24) | 46 (38–62) | 1.62 | 0.46 | 110 (60) | 100 (57–117) | 2.06 | 0.54 | |||
| UnitedHealthcare | 53 857 | 11 644 | 68 (35) | 59 (43–79) | 1.83 | 0.51 | 31 (22) | 26 (24–26) | 1.1 | 0.7 | |||
| Diagnostic mammogram with computer analysis, one breast | 77 065 | All Four Payers | 193 578 | 12 334 | 160 (115) | 127 (96–179) | 1.87 | 0.72 | 374 (1415) | 195 (124–307) | 2.48 | 3.79 | |
| Aetna | 23 818 | 5897 | 127 (81) | 96 (85–135) | 1.6 | 0.64 | 221 (155) | 175 (107–280) | 2.62 | 0.7 | |||
| BlueCross BlueShield | 110 838 | 11 306 | 171 (134) | 131 (100–183) | 1.83 | 0.79 | 554 (2052) | 215 (156–337) | 2.16 | 3.71 | |||
| Cigna | 19 486 | 7881 | 128 (62) | 112 (89–146) | 1.65 | 0.48 | 287 (152) | 241 (176–327) | 1.86 | 0.53 | |||
| UnitedHealthcare | 39 436 | 8860 | 163 (83) | 141 (103–192) | 1.85 | 0.51 | 108 (33) | 96 (87–113) | 1.29 | 0.31 | |||
| Diagnostic mammogram with computer analysis, both breasts | 77 066 | All Four Payers | 192 184 | 12 254 | 202 (146) | 159 (121–227) | 1.88 | 0.72 | 435 (1453) | 236 (150–371) | 2.47 | 3.34 | |
| Aetna | 23 461 | 5815 | 161 (103) | 123 (107–174) | 1.62 | 0.64 | 277 (196) | 208 (136–344) | 2.53 | 0.71 | |||
| BlueCross BlueShield | 110 359 | 11 223 | 216 (170) | 165 (124–232) | 1.87 | 0.79 | 626 (2113) | 263 (184–432) | 2.35 | 3.38 | |||
| Cigna | 19 379 | 7863 | 161 (78) | 141 (113–184) | 1.63 | 0.48 | 374 (191) | 328 (251–425) | 1.69 | 0.51 | |||
| UnitedHealthcare | 38 985 | 8804 | 207 (107) | 177 (131–242) | 1.84 | 0.52 | 132 (38) | 123 (112–129) | 1.15 | 0.28 | |||
| Screening mammogram with computer analysis, both breasts | 77 067 | All Four Payers | 281 714 | 16 805 | 167 (125) | 131 (98–184) | 1.88 | 0.75 | 361 (1387) | 192 (123–305) | 2.48 | 3.84 | |
| Aetna | 33 977 | 8196 | 130 (85) | 98 (86–138) | 1.6 | 0.66 | 222 (163) | 161 (108–278) | 2.57 | 0.73 | |||
| BlueCross BlueShield | 163 670 | 15 345 | 181 (146) | 136 (101–188) | 1.85 | 0.81 | 534 (2035) | 221 (153–341) | 2.23 | 3.81 | |||
| Cigna | 28 035 | 10 908 | 130 (62) | 114 (91–149) | 1.64 | 0.48 | 274 (142) | 247 (148–303) | 2.04 | 0.52 | |||
| UnitedHealthcare | 56 032 | 12 070 | 167 (87) | 144 (105–196) | 1.86 | 0.52 | 111 (32) | 101 (92–115) | 1.25 | 0.29 | |||
| MRI scan | Brain MRI with and without contrast | 70 553 | All Four Payers | 380 432 | 19 448 | 619 (561) | 447 (299–697) | 2.33 | 0.91 | 1210 (1557) | 792 (515–1487) | 2.89 | 1.29 |
| Aetna | 44 339 | 9962 | 390 (370) | 268 (213–427) | 2 | 0.95 | 930 (831) | 652 (353–1321) | 3.74 | 0.89 | |||
| BlueCross BlueShield | 218 204 | 17 814 | 695 (645) | 498 (333–750) | 2.25 | 0.93 | 1693 (2238) | 1107 (716–1874) | 2.62 | 1.32 | |||
| Cigna | 41 433 | 13 694 | 519 (325) | 433 (275–700) | 2.54 | 0.63 | 843 (402) | 720 (616–957) | 1.55 | 0.48 | |||
| UnitedHealthcare | 76 456 | 14 420 | 590 (434) | 469 (329–692) | 2.1 | 0.74 | 803 (249) | 792 (792–792) | 1 | 0.31 | |||
| Lower back (lumbar spine) MRI without contrast | 72 148 | All Four Payers | 383 475 | 19 554 | 380 (330) | 278 (191–451) | 2.36 | 0.87 | 920 (1283) | 570 (348–1107) | 3.18 | 1.4 | |
| Aetna | 45 114 | 10 066 | 273 (233) | 220 (162–301) | 1.86 | 0.85 | 792 (765) | 479 (237–1128) | 4.77 | 0.97 | |||
| BlueCross BlueShield | 222 328 | 17 951 | 429 (381) | 315 (201–523) | 2.6 | 0.89 | 1187 (1832) | 797 (474–1223) | 2.58 | 1.54 | |||
| Cigna | 41 054 | 13 697 | 304 (176) | 265 (165–401) | 2.43 | 0.58 | 612 (394) | 446 (368–888) | 2.41 | 0.64 | |||
| UnitedHealthcare | 74 979 | 14 260 | 340 (241) | 275 (192–400) | 2.08 | 0.71 | 531 (148) | 531 (531–531) | 1 | 0.28 | |||
| Lower extremity joint MRI without contrast | 73 721 | All Four Payers | 268 579 | 13650 | 375 (306) | 283 (196–442) | 2.26 | 0.82 | 940 (1356) | 582 (367–1126) | 3.07 | 1.44 | |
| Aetna | 32 573 | 7248 | 265 (194) | 219 (167–299) | 1.79 | 0.73 | 796 (764) | 494 (246–1127) | 4.58 | 0.96 | |||
| BlueCross BlueShield | 156 605 | 12 599 | 423 (354) | 321 (211–516) | 2.45 | 0.84 | 1256 (1949) | 833 (503–1272) | 2.53 | 1.55 | |||
| Cigna | 27 795 | 9393 | 299 (167) | 267 (175–384) | 2.2 | 0.56 | 635 (409) | 457 (391–925) | 2.37 | 0.64 | |||
| UnitedHealthcare | 51 606 | 9941 | 340 (219) | 270 (198–411) | 2.07 | 0.64 | 430 (163) | 393 (393–393) | 1 | 0.38 | |||
| Ultrasound | Head and neck ultrasound | 76 536 | All Four Payers | 442 672 | 23 783 | 139 (113) | 108 (78–153) | 1.96 | 0.82 | 341 (1342) | 167 (111–286) | 2.57 | 3.94 |
| Aetna | 54 690 | 12 232 | 96 (79) | 68 (58–101) | 1.73 | 0.82 | 157 (116) | 129 (81–200) | 2.47 | 0.74 | |||
| BlueCross BlueShield | 252 150 | 21 750 | 153 (133) | 114 (88–158) | 1.81 | 0.87 | 633 (2121) | 279 (193–437) | 2.27 | 3.35 | |||
| Cigna | 47 783 | 16 584 | 107 (55) | 92 (72–127) | 1.75 | 0.52 | 258 (119) | 227 (207–297) | 1.43 | 0.46 | |||
| UnitedHealthcare | 88 049 | 17 347 | 143 (79) | 124 (87–171) | 1.97 | 0.55 | 147 (84) | 117 (117–117) | 1 | 0.57 | |||
| Complete breast ultrasound | 76 641 | All Four Payers | 145 902 | 9035 | 128 (90) | 101 (78–147) | 1.89 | 0.7 | 391 (1580) | 195 (120–304) | 2.53 | 4.04 | |
| Aetna | 19 969 | 4602 | 105 (91) | 80 (63–108) | 1.71 | 0.86 | 193 (157) | 147 (94–238) | 2.52 | 0.81 | |||
| BlueCross BlueShield | 83 810 | 8180 | 139 (97) | 108 (88–156) | 1.78 | 0.7 | 649 (2381) | 242 (175–366) | 2.1 | 3.67 | |||
| Cigna | 14 991 | 5964 | 100 (45) | 88 (72–117) | 1.61 | 0.45 | 279 (138) | 233 (192–474) | 2.46 | 0.5 | |||
| UnitedHealthcare | 27 132 | 6232 | 124 (74) | 101 (73–148) | 2.04 | 0.59 | 236 (98) | 222 (159–297) | 1.87 | 0.42 | |||
| Limited breast ultrasound | 76 642 | All Four Payers | 254 920 | 14 836 | 115 (83) | 89 (68–132) | 1.95 | 0.73 | 352 (1601) | 158 (90–260) | 2.88 | 4.55 | |
| Aetna | 30 587 | 7243 | 90 (71) | 66 (55–92) | 1.67 | 0.79 | 152 (112) | 115 (73–194) | 2.67 | 0.74 | |||
| BlueCross BlueShield | 149 549 | 13 642 | 126 (93) | 97 (73–136) | 1.86 | 0.74 | 586 (2346) | 204 (140–337) | 2.41 | 4 | |||
| Cigna | 26 214 | 9896 | 86 (41) | 74 (60–100) | 1.65 | 0.48 | 199 (103) | 182 (132–227) | 1.72 | 0.52 | |||
| UnitedHealthcare | 48 570 | 10 553 | 112 (67) | 95 (65–132) | 2.03 | 0.6 | 204 (89) | 192 (144–246) | 1.71 | 0.44 | |||
| Complete abdominal ultrasound | 76 700 | All Four Payers | 455 315 | 23 522 | 156 (125) | 120 (92–172) | 1.88 | 0.8 | 348 (1311) | 176 (116–301) | 2.6 | 3.76 | |
| Aetna | 56 326 | 12 390 | 104 (82) | 76 (62–114) | 1.84 | 0.79 | 168 (140) | 124 (77–218) | 2.81 | 0.83 | |||
| BlueCross BlueShield | 262 205 | 21 583 | 175 (143) | 128 (100–184) | 1.84 | 0.82 | 613 (2031) | 281 (196–448) | 2.29 | 3.31 | |||
| Cigna | 50 275 | 16 691 | 119 (57) | 105 (81–137) | 1.7 | 0.48 | 279 (136) | 239 (217–313) | 1.44 | 0.49 | |||
| UnitedHealthcare | 86 509 | 16 880 | 152 (104) | 125 (87–186) | 2.13 | 0.69 | 173 (70) | 154 (154–154) | 1 | 0.41 | |||
| Limited abdominal ultrasound | 76 705 | All Four Payers | 524 090 | 27 387 | 117 (92) | 90 (70–129) | 1.86 | 0.79 | 294 (1208) | 141 (91–266) | 2.93 | 4.11 | |
| Aetna | 64 030 | 14 162 | 80 (62) | 58 (48–89) | 1.85 | 0.77 | 128 (115) | 95 (59–165) | 2.79 | 0.9 | |||
| BlueCross BlueShield | 301 181 | 25 155 | 131 (107) | 94 (75–139) | 1.86 | 0.82 | 529 (1858) | 260 (161–402) | 2.5 | 3.51 | |||
| Cigna | 57 369 | 19 253 | 88 (44) | 78 (59–102) | 1.72 | 0.5 | 200 (96) | 169 (163–227) | 1.39 | 0.48 | |||
| UnitedHealthcare | 101 510 | 20 026 | 117 (66) | 98 (71–139) | 1.97 | 0.57 | 135 (77) | 109 (109–109) | 1 | 0.57 | |||
| Transvaginal ultrasound (nonobstetric) | 76 830 | All Four Payers | 469 934 | 24 071 | 145 (121) | 112 (83–160) | 1.92 | 0.84 | 336 (1314) | 174 (110–304) | 2.76 | 3.91 | |
| Aetna | 58 327 | 12 727 | 101 (75) | 73 (62–106) | 1.69 | 0.74 | 165 (127) | 126 (75–215) | 2.87 | 0.77 | |||
| BlueCross BlueShield | 267 020 | 22 095 | 159 (145) | 116 (91–165) | 1.81 | 0.91 | 583 (2024) | 280 (176–443) | 2.51 | 3.47 | |||
| Cigna | 51 018 | 16 929 | 112 (54) | 98 (78–131) | 1.69 | 0.49 | 250 (119) | 215 (196–284) | 1.45 | 0.48 | |||
| UnitedHealthcare | 93 569 | 17 626 | 150 (82) | 126 (91–181) | 1.99 | 0.54 | 161 (78) | 135 (135–135) | 1 | 0.49 | |||
| Complete pelvic ultrasound | 76 856 | All Four Payers | 473 778 | 24 101 | 138 (114) | 106 (79–151) | 1.92 | 0.83 | 312 (1124) | 165 (105–292) | 2.78 | 3.6 | |
| Aetna | 58 852 | 12 796 | 94 (74) | 68 (56–98) | 1.73 | 0.79 | 152 (131) | 110 (70–196) | 2.79 | 0.86 | |||
| BlueCross BlueShield | 269 688 | 22 163 | 154 (136) | 112 (88–157) | 1.79 | 0.88 | 527 (1713) | 269 (180–427) | 2.37 | 3.25 | |||
| Cigna | 51 193 | 16 937 | 106 (50) | 94 (73–122) | 1.68 | 0.47 | 227 (108) | 194 (177–258) | 1.46 | 0.48 | |||
| UnitedHealthcare | 94 045 | 17 700 | 138 (74) | 119 (84–164) | 1.96 | 0.54 | 182 (73) | 163 (163–163) | 1 | 0.4 | |||
| X-ray | Chest X-ray, single view | 71 045 | All Four Payers | 540 881 | 28 920 | 32 (28) | 24 (17–35) | 2.02 | 0.87 | 160 (1029) | 48 (25–119) | 4.7 | 6.41 |
| Aetna | 60 164 | 13 785 | 24 (21) | 17 (14–25) | 1.79 | 0.91 | 49 (94) | 31 (19–53) | 2.73 | 1.9 | |||
| BlueCross BlueShield | 318 140 | 26 716 | 34 (31) | 25 (20–39) | 1.95 | 0.89 | 285 (1518) | 96 (40–180) | 4.52 | 5.33 | |||
| Cigna | 56 180 | 19 435 | 22 (12) | 19 (15–28) | 1.88 | 0.54 | 55 (31) | 47 (28–58) | 2.09 | 0.57 | |||
| UnitedHealthcare | 106 397 | 21 039 | 33 (25) | 26 (18–40) | 2.29 | 0.77 | 180 (116) | 171 (100–241) | 2.41 | 0.65 | |||
| Chest X-ray, two views | 71 046 | All Four Payers | 549 078 | 29 245 | 43 (36) | 32 (25–50) | 2.02 | 0.83 | 197 (1253) | 66 (36–142) | 3.97 | 6.36 | |
| Aetna | 62 461 | 14 121 | 31 (24) | 23 (20–32) | 1.6 | 0.77 | 64 (92) | 43 (26–75) | 2.93 | 1.43 | |||
| BlueCross BlueShield | 321 837 | 26 980 | 48 (41) | 35 (27–52) | 1.93 | 0.87 | 348 (1849) | 108 (59–192) | 3.25 | 5.31 | |||
| Cigna | 56 290 | 19 556 | 31 (16) | 27 (21–38) | 1.78 | 0.5 | 68 (38) | 62 (36–75) | 2.09 | 0.56 | |||
| UnitedHealthcare | 108 490 | 21 276 | 43 (27) | 35 (23–54) | 2.31 | 0.62 | 178 (107) | 169 (100–238) | 2.38 | 0.6 | |||
| Lower spine X-ray, 2–3 views | 72 100 | All Four Payers | 499 658 | 25 857 | 49 (44) | 37 (28–54) | 1.9 | 0.9 | 217 (1584) | 66 (40–153) | 3.78 | 7.31 | |
| Aetna | 60 429 | 13 422 | 37 (56) | 26 (23–37) | 1.61 | 1.52 | 62 (89) | 43 (27–75) | 2.74 | 1.43 | |||
| BlueCross BlueShield | 286 055 | 23 725 | 54 (48) | 40 (31–57) | 1.86 | 0.89 | 449 (2514) | 159 (81–230) | 2.83 | 5.6 | |||
| Cigna | 54 189 | 18 094 | 37 (18) | 33 (25–44) | 1.72 | 0.49 | 86 (44) | 75 (48–103) | 2.13 | 0.51 | |||
| UnitedHealthcare | 98 985 | 18 840 | 48 (28) | 40 (29–58) | 1.98 | 0.58 | 88 (96) | 48 (48–48) | 1 | 1.09 | |||
| Shoulder X-ray | 73 030 | All Four Payers | 515 580 | 26 437 | 42 (35) | 32 (24–47) | 1.95 | 0.84 | 162 (1044) | 56 (36–120) | 3.37 | 6.44 | |
| Aetna | 62 155 | 13 688 | 31 (30) | 22 (19–31) | 1.64 | 0.99 | 56 (93) | 37 (23–64) | 2.71 | 1.67 | |||
| BlueCross BlueShield | 295 633 | 24 295 | 46 (40) | 36 (26–49) | 1.87 | 0.87 | 315 (1636) | 110 (68–192) | 2.8 | 5.19 | |||
| Cigna | 55 555 | 18 423 | 31 (16) | 27 (21–37) | 1.75 | 0.51 | 71 (38) | 64 (37–77) | 2.09 | 0.54 | |||
| UnitedHealthcare | 102 237 | 19 370 | 42 (25) | 34 (26–49) | 1.88 | 0.59 | 75 (76) | 44 (44–44) | 1 | 1.01 | |||
| Hand X-ray | 73 130 | All Four Payers | 498 973 | 25 566 | 43 (35) | 33 (24–49) | 2.01 | 0.81 | 211 (1332) | 61 (38–123) | 3.27 | 6.31 | |
| Aetna | 59 977 | 13 258 | 32 (28) | 23 (20–33) | 1.64 | 0.89 | 58 (87) | 40 (25–68) | 2.73 | 1.5 | |||
| BlueCross BlueShield | 286 032 | 23 504 | 48 (40) | 36 (27–51) | 1.88 | 0.84 | 435 (2082) | 118 (73–200) | 2.73 | 4.78 | |||
| Cigna | 54 107 | 18 018 | 32 (17) | 28 (22–39) | 1.76 | 0.52 | 81 (42) | 70 (46–93) | 2.01 | 0.52 | |||
| UnitedHealthcare | 98 857 | 18 709 | 43 (26) | 36 (25–51) | 2.07 | 0.62 | 75 (78) | 42 (42–42) | 1 | 1.05 | |||
| Knee X-ray, three views | 73 562 | All Four Payers | 488 612 | 24 696 | 48 (41) | 37 (27–55) | 2.01 | 0.85 | 204 (1192) | 75 (38–140) | 3.7 | 5.85 | |
| Aetna | 58 899 | 12 902 | 36 (42) | 25 (22–36) | 1.6 | 1.19 | 62 (73) | 44 (27–75) | 2.73 | 1.19 | |||
| BlueCross BlueShield | 280 482 | 22 719 | 54 (46) | 41 (30–58) | 1.9 | 0.86 | 374 (1778) | 124 (79–208) | 2.63 | 4.75 | |||
| Cigna | 52 808 | 17 371 | 36 (19) | 31 (24–43) | 1.77 | 0.53 | 86 (48) | 75 (45–99) | 2.22 | 0.55 | |||
| UnitedHealthcare | 96 423 | 18 094 | 47 (28) | 39 (29–55) | 1.92 | 0.58 | 178 (105) | 162 (110–225) | 2.05 | 0.59 | |||
| Ankle X-ray | 73 610 | All Four Payers | 498 854 | 25 536 | 44 (40) | 33 (25–49) | 1.99 | 0.92 | 193 (1257) | 61 (38–123) | 3.24 | 6.53 | |
| Aetna | 59 997 | 13 258 | 33 (49) | 23 (20–33) | 1.63 | 1.48 | 58 (86) | 40 (25–70) | 2.77 | 1.5 | |||
| BlueCross BlueShield | 286 748 | 23 496 | 48 (44) | 35 (28–53) | 1.91 | 0.92 | 388 (1963) | 119 (74–200) | 2.72 | 5.06 | |||
| Cigna | 53 678 | 17 842 | 32 (17) | 28 (22–39) | 1.77 | 0.52 | 76 (42) | 68 (39–83) | 2.11 | 0.54 | |||
| UnitedHealthcare | 98 431 | 18 676 | 43 (25) | 36 (26–52) | 1.96 | 0.58 | 74 (79) | 41 (41–41) | 1 | 1.08 | |||
| Foot X-ray | 73 630 | All Four Payers | 507 314 | 26 045 | 42 (36) | 32 (24–46) | 1.96 | 0.86 | 153 (949) | 58 (36–119) | 3.34 | 6.21 | |
| Aetna | 60 859 | 13 479 | 31 (32) | 22 (19–31) | 1.62 | 1.05 | 55 (87) | 37 (24–66) | 2.73 | 1.56 | |||
| BlueCross BlueShield | 291 682 | 23 961 | 46 (40) | 33 (26–50) | 1.93 | 0.88 | 294 (1488) | 112 (70–191) | 2.75 | 5.06 | |||
| Cigna | 54 630 | 18 200 | 31 (16) | 27 (21–37) | 1.7 | 0.5 | 72 (37) | 63 (38–76) | 2.03 | 0.52 | |||
| UnitedHealthcare | 100 143 | 19 089 | 42 (29) | 34 (25–49) | 2.01 | 0.71 | 72 (77) | 42 (42–42) | 1 | 1.06 | |||
| Abdominal X-ray, single view | 74 018 | All Four Payers | 512 546 | 27 347 | 38 (31) | 29 (22–42) | 1.97 | 0.82 | 207 (1337) | 61 (34–129) | 3.81 | 6.45 | |
| Aetna | 57 159 | 13 131 | 28 (23) | 21 (18–30) | 1.66 | 0.81 | 58 (86) | 40 (24–67) | 2.74 | 1.48 | |||
| BlueCross BlueShield | 300 334 | 25 251 | 42 (36) | 31 (24–44) | 1.87 | 0.85 | 371 (1950) | 103 (55–181) | 3.28 | 5.25 | |||
| Cigna | 53 353 | 18 423 | 28 (14) | 24 (19–34) | 1.77 | 0.5 | 65 (34) | 55 (35–78) | 2.2 | 0.52 | |||
| UnitedHealthcare | 101 700 | 19 952 | 38 (24) | 30 (20–46) | 2.26 | 0.65 | 181 (109) | 172 (107–241) | 2.26 | 0.6 | |||
| Bone density scan (DXA), spine/hips | 77 080 | All Four Payers | 278 039 | 16 062 | 70 (63) | 53 (32–86) | 2.68 | 0.9 | 299 (1455) | 105 (54–226) | 4.17 | 4.86 | |
| Aetna | 35 258 | 8160 | 53 (56) | 35 (26–63) | 2.43 | 1.07 | 102 (113) | 64 (38–117) | 3.1 | 1.11 | |||
| BlueCross BlueShield | 160 815 | 14 674 | 80 (71) | 61 (34–104) | 3.01 | 0.89 | 544 (2173) | 199 (108–316) | 2.93 | 3.99 | |||
| Cigna | 27 952 | 10 503 | 55 (29) | 48 (33–72) | 2.2 | 0.52 | 91 (43) | 79 (70–103) | 1.46 | 0.47 | |||
| UnitedHealthcare | 54 014 | 11 341 | 60 (44) | 47 (32–71) | 2.2 | 0.74 | 246 (116) | 245 (180–303) | 1.69 | 0.47 | |||
Peer Reviews
No public reviews on file for this paper yet. If you reviewed it on a platform where reviews are public (OpenReview, ICLR, NeurIPS, ICML), you can paste yours below so the community can read it here.
Videos
No videos yet. Explain this paper in a talk, walkthrough, or lecture? Add one.
Taxonomy
TopicsHealthcare Policy and Management · Radiation Dose and Imaging · Health Systems, Economic Evaluations, Quality of Life
Introduction
Clinicians, patients, and purchasers face large variation in rates negotiated by commercial insurers, which provide health insurance coverage for approximately half the country. Unlike Medicare rates, commercial rates are established through a negotiation process that is not transparent, resulting in prices that are highly variable and opaque.^1,2^ Further, prices can vary depending on whether the contract is at the facility or physician level, with prices differing even within the same insurer's portfolio of plans.^3^ Lack of transparency limits the ability of regulators to monitor prices and employers, patients, and purchasers to impose market discipline on prices. The private market lacked meaningful price transparency for patients and purchasers until the recent implementation of Hospital Price Transparency and Transparency in Coverage (TiC) rules, which respectively require hospitals to post prices for 300 “shoppable” services and insurers to post their full set of negotiated rates. However, initial efforts to analyze the TiC data have been limited, largely due to data size and complexity. Price variation for common imaging studies has not been widely examined for large commercial payers since the implementation of TiC rules and is the objective of this study.
While existing studies show patients are unlikely to use price transparency data,^4-6^ these data can inform other decisions and policies. Clinicians play a key role in advising patients on care decisions and can benefit from understanding the wide range of prices offered by insurers to help them guide patients in navigating cost considerations and selecting affordable care options.^7^ Both purchasers and policymakers may also use price information to appropriately design initiatives that ensure health care affordability.^6,8^ Regulators can also use these data to monitor health care markets and design policies that limit the price consequences of provider concentration.^9,10^
To help fill this gap and inform these policies, in this study, we used TiC data to examine variation in commercial insurance payment rates for common imaging studies. Relative to other healthcare services, imaging studies are relatively homogenous.^11,12^ Thus, observed differences in prices are likely to reflect differences in negotiation leverage between both providers and payers. We also separately focused on price variation for professional fees, the amount paid to the radiologist to interpret the imaging study, and facility fees, the amount paid to the facility in which the imaging study occurs. Relative to other approaches which have identified substantial price variation in imaging studies,^13-16^ a key advantage of using the TiC data to examine these questions is the ability to specifically identify insurers. Further, TiC data allows us to comprehensively examine how insurer-specific factors translate into observed price differences for imaging studies*—*an analysis not possible with hospital transparency data, which are limited by incomplete reporting and focus only on hospital-based imaging prices, when many imaging services are performed in nonhospital settings.
Data and methods
We examined TiC price data collected by a third-party vendor, ClarifyHealth, for common imaging studies from four large national insurers (Blue Cross Blue Shield [BCBS], United, Cigna, and Aetna), which collectively constitute 78% market share.^17^ Unlike the majority of prior work which utilizes hospital price data, we leverage TiC data's unique granularity and broader provider coverage to directly compare prices across all care settings (including hospitals) for major named insurers. Despite being released in July 2021, these data have seen limited use due to their structural complexity. However, recent research confirms high concordance between TiC data, hospital pricing data, and Marketscan commercial claims.^18,19^ Challenges with TiC data include “zombie rates” for inactive providers and redundant pricing files, resulting in over 1 trillion monthly price observations and 1 petabyte of data. To address these data challenge, Clarify links TiC data to Medicare fee-for-service and commercial insurance claims, covering about 270 million people.^20^ We analyzed commercial prices (excluding Medicare Advantage and Medicaid Managed Care) for providers with billed claims during the 2023 contract year for 30 common imaging studies. These data were downloaded in December 2024, but reflect the prior year's negotiated rates. Imaging studies were broadly categorized as either CT scan, mammogram, MRI, ultrasound, or X-ray studies. Prices reflect the “allowed amount,” which is the amount negotiated between an insurer and provider for a given Current Procedural Terminology (CPT) code (distinct from the “chargemaster” rate), and includes both payments from the insurer and patient cost-sharing responsibilities. We used weighted average negotiated prices across all plan types (PPO, HMO) as calculated by ClarifyHealth. This means if an insurer has enrollees in both PPO and HMO plans with different pricing structures, our analysis incorporates a weighted average of these prices.
For professional fee prices, our sample had approximately 12.7 million price points and 35 269 unique physicians. For facility fee prices, our sample included approximately 239 969 price points and 5057 facilities. We analyzed distributional differences in prices (mean, median, and percentiles), coefficients of variation, and price indices by payer. To construct price indices, we define procedure-specific volume weights for CPT codes (see Appendix 1), consistent with approaches used in previous literature.^21,22^
Several limitations should be noted in this analysis. First, we describe negotiated rates from four major commercial insurers, potentially missing important variation from smaller regional insurers and self-insured employers. Second, given its recency, these data are cross-sectional for the 2023 contract year and may not capture seasonal variations, longitudinal trends, or recent market changes. Third, we cannot track how much of the difference in payments translates to differences in physician compensation. Fourth, the price data does not account for quality differences, patient outcomes, or specific facility characteristics that might justify price variations. Fifth, we cannot stratify our price analysis by site-of-service principally due to differential reporting across payers.
Brown University Institutional Review Board deemed this cross-sectional study exempt from ethics review and informed consent because it was not human participant research. Data analysis was performed using R version 4.4.1.
Results
Across all imaging studies examined, professional pricing has less price variation than facility pricing (Table 1). Facility coefficients of variation are often 3 to 6 times higher than their professional components. This difference is particularly pronounced in X-ray studies, where facility fees can vary by a factor of 6 or more. Advanced imaging modalities (CT and MRI) demonstrate more consistent pricing patterns with lower coefficients of variation in their facility fees (generally 1.2 to 2.0) compared to basic imaging like X-rays and ultrasounds.
Volume-weighted price indices by payer (Table 2) show BCBS consistently has higher payments across all imaging studies, with facility prices ranging from 31% to 85% above the market average. In contrast, Cigna and Aetna generally have lower-than-average prices across most imaging studies. United Healthcare presents a mixed pricing pattern, with professional fees close to the market average but notably lower facility fees, particularly for mammograms, at just 0.25 times the market average. Within service categories, the most extreme price variations appear in facility fees for X-rays, where BCBS charges 1.85 times the market average while Aetna charges only 0.32 times the market average—a 6-fold difference.
Disaggregated analysis by both service and payer (Table 3) shows substantial price variation. The professional interquartile ratios were lowest for Cigna's CT Abdomen/Pelvis without contrast [CPT 74 176] (25th percentile: 219) and highest for BCBS's DXA Bone Density Scan [CPT 77 080] (25th percentile: 104). The facility interquartile ratios were lowest for the majority of UnitedHealthcare's imaging studies (with 17 of 30 studies showing an interquartile ratio of exactly 1) and highest for Aetna's CT Head without contrast [CPT 70 450] (25th percentile: 700).
As a descriptive example of price variation for imaging studies by geography, Figure 1 maps the variation in prices for chest X-rays across states. Professional prices for chest X-rays are relatively low and show limited variation across states, but facility prices are higher and have an upper limit of approximately 5 times its lower bound across states. Similar findings were present for other procedures.
Map of median rates by state for chest X-ray [CPTs 71 045 and 71 046]. Source: author's analysis. (A) Professional rates. (B) Facility rates.
Discussion
The findings of this study highlight significant variation in commercial pricing for common imaging studies, with facility prices exhibiting greater variability, especially for X-ray studies. We observe not just geographic variation in commercial prices, but also payer-specific variation across named insurers that suggest unique bargaining strategies, and extend prior work using hospital-posted data by including both hospital and nonhospital providers. The higher prices observed for BCBS likely reflect their market power and strategic decision to maintain broad provider networks, which typically require higher reimbursement rates to attract and retain providers.^23,24^ Cigna's consistently lower prices across imaging studies suggest a successful implementation of selective contracting with providers who accept lower reimbursement rates in exchange for higher patient volume.^23^ Aetna's consistently lower prices, particularly in facility fees, suggests an aggressive negotiating stance with providers and possibly a willingness to exclude higher-cost facilities from their networks,^25^ even if this means more limited geographic coverage. United Healthcare's unique pattern of average professional fees but markedly lower facility fees, particularly in mammography, may reflect a vertical integration strategy through its subsidiary, Optum, where it can better control facility costs through direct ownership while maintaining competitive physician compensation to ensure network adequacy.^26^
The pricing patterns observed in part reflect different negotiation strategies and market positioning. While our analysis examines variation across major insurers, significant heterogeneity exists within individual insurers’ networks. For example, different plans (including employer-specific plans) from the same insurer can have substantially different prices even within the same hospital or for the same physician.^27,28^ This within-insurer variation likely contributes to the overall price dispersion observed in our study.
Our findings of greater variation in facility fees for X-rays compared to advanced imaging like MRI and CT may reflect, in part, differences in site-of-service utilization. X-rays can be performed across multiple settings (hospitals, ambulatory surgical centers, and physician offices), while advanced imaging is more commonly performed in hospital settings. Recent studies using Transparency-in-Coverage data have documented substantial site-of-service price differentials for other services. Wang et al.^29^ found facility fees for colonoscopies were approximately 55% higher in hospitals compared to ambulatory surgical centers. Similar patterns exist for imaging services, with BCBS data showing hospital outpatient department prices for imaging 2–3 times higher than physician office prices, with these differentials increasing over time.^30^ While our current analysis focuses on payer-specific variation rather than site-of-service differences, the observed price patterns—particularly the wider variation in X-ray facility fees—may reflect these site-of-service dynamics. Future research should examine how imaging prices vary across different care settings and how site-neutral payment policies might affect commercial market prices.
The cost burden on patients and insurers can differ widely depending on the location and the service provided, potentially exacerbating healthcare inequities. The state-level variation in prices further underscores the potential influence of local market dynamics, such as provider market concentration, insurer market power, cost of living adjustments, state-specific regulatory environments, and local practice patterns—with facility fees showing particularly pronounced geographic disparities compared to the more uniform professional component pricing. Outlier states (such as Wisconsin and Alaska) with higher than average professional prices may be explained by strong physician practices with increased negotiating leverage^1^ or Medicare payment policy allowing for geographic payment adjustment.^31^
This study reveals how novel TiC data may inform policies that improve the efficiency of the US health care system. Future work should extend this study and examine the underlying causes of price variation in imaging studies. Existing studies show minimal relationship between prices and care quality or efficiency.^32^ The disconnect between pricing and quality metrics is particularly noteworthy in imaging studies, where standardization of equipment and protocols should theoretically lead to more uniform pricing structures.^11,33^ Even among these relatively standardized procedures, we observe inconsistent patterns of commercial insurance price variation. If price variation reflects clinical or perceived quality variation, purchasers and policymakers must find the balance between receiving higher-quality care and spending financial resources elsewhere. However, if price variation is driven by consolidation or anticompetitive contracting, then regulators should design policies that ensure competitive healthcare markets. The factors determining price variation are likely somewhere in the middle of these two possibilities, but likely skewed towards the latter in the case of imaging studies where quality should be relatively constant.
Supplementary Material
qxaf092_Supplementary_Data
The reference list from the paper itself. Each links out to its DOI / PubMed record.
- 1Whaley CM, Briscombe B, Kerber R, O’Neill B, Kofner A. Prices Paid to Hospitals by Private Health Plans: Findings from Round 4 of an Employer-Led Transparency Initiative. RAND Corporation. 2022. Accessed November 11, 2024. https://www.rand.org/pubs/research_reports/RRA 1144-1.html PMC 971806236484073 · pubmed ↗
- 2Cooper Z, Craig SV, Gaynor M, Van Reenen J. The price ain’t right? Hospital prices and health spending on the privately insured*. Q J Econ. 2019;134(1):51–107. 10.1093/qje/qjy 02032981974 PMC 7517591 · doi ↗ · pubmed ↗
- 3Henderson M, Mouslim M. Facts about hospital-insurer contracting. Am J Manag Care. 2024;30:e 59–e 62.38381550 10.37765/ajmc.2024.89502 · doi ↗ · pubmed ↗
- 4Desai S, Hatfield LA, Hicks AL, Chernew ME, Mehrotra A. Association between availability of a price transparency tool and outpatient spending. JAMA. 2016;315(17):1874–1881. 10.1001/jama.2016.428827139060 · doi ↗ · pubmed ↗
- 5Desai S, Hatfield LA, Hicks AL, et al Offering a price transparency tool did not reduce overall spending among California public employees and retirees. Health Aff Proj Hope. 2017;36(8):1401–1407. 10.1377/hlthaff.2016.163628784732 · doi ↗ · pubmed ↗
- 6Whaley C, Schneider Chafen J, Pinkard S, et al Association between availability of health service prices and payments for these services. JAMA. 2014;312(16):1670–1676. 10.1001/jama.2014.1337325335149 · doi ↗ · pubmed ↗
- 7Rashidi A, Pham T, Arce A, Garg D, Sadigh G. Association between price transparency and patient decision to complete outpatient imaging. Clin Imaging. 2025;119:110397. 10.1016/j.clinimag.2024.11039739736182 · doi ↗ · pubmed ↗
- 8Robinson JC, Whaley C, Brown TT. Reference pricing, consumer cost-sharing, and insurer spending for advanced imaging tests. Med Care. 2016;54(12):1050–1055. 10.1097/MLR.000000000000060527479594 · doi ↗ · pubmed ↗