Combining biomarkers to construct a novel predictive model for predicting preoperative lymph node metastasis in early gastric cancer
Yujian He, Xiaoli Xie, Bingxue Yang, Xiaoxu Jin, Zhijie Feng

TL;DR
This paper develops a new model to predict lymph node metastasis in early gastric cancer using clinicopathological factors and a biomarker called HAVCR1.
Contribution
The novel contribution is integrating HAVCR1 biomarker expression with clinicopathological factors to improve prediction accuracy.
Findings
Tumor size, histological type, and ulcers are independent risk factors for lymph node metastasis.
Incorporating HAVCR1 expression improved the model's reclassification and discrimination abilities.
The new nomogram provides better guidance for treatment strategies in early gastric cancer patients.
Abstract
Accurately identifying the status of lymph node metastasis (LNM) is crucial for determining the appropriate treatment strategy for early gastric cancer (EGC) patients. Univariate and multivariate logistic regression analyses were used to explore the association between clinicopathological factors and LNM in EGC patients, leading to the development of a nomogram. Differential expression analysis was conducted to identify biomarkers associated with LNM, and their expression was evaluated through immunohistochemistry. The biomarker was integrated into the conventional model to create a new model, which was then assessed for reclassification and discrimination abilities. Multivariate logistic regression analysis revealed that tumor size, histological type, and the presence of ulcers are independent risk factors for LNM in EGC patients. The nomogram demonstrated good clinical performance.…
Genes, proteins, chemicals, diseases, species, mutations and cell lines named across the full text — each resolved to its canonical identifier and authoritative record.
Click any figure to enlarge with its caption.
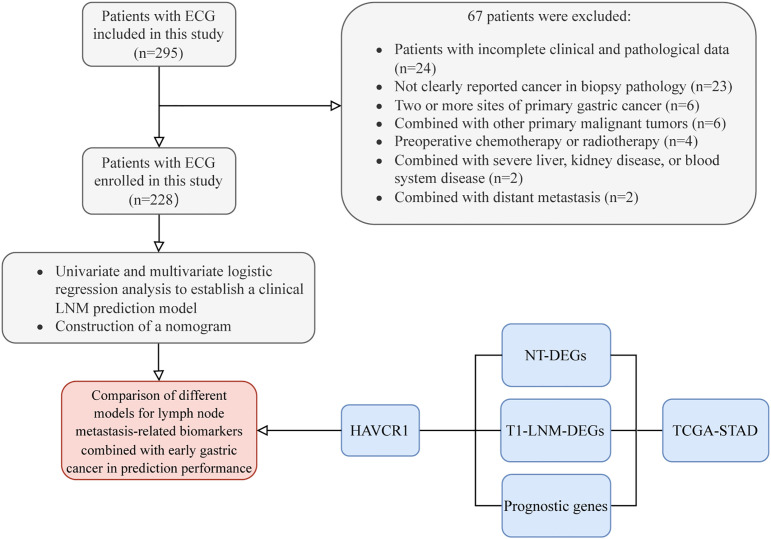 Figure 1
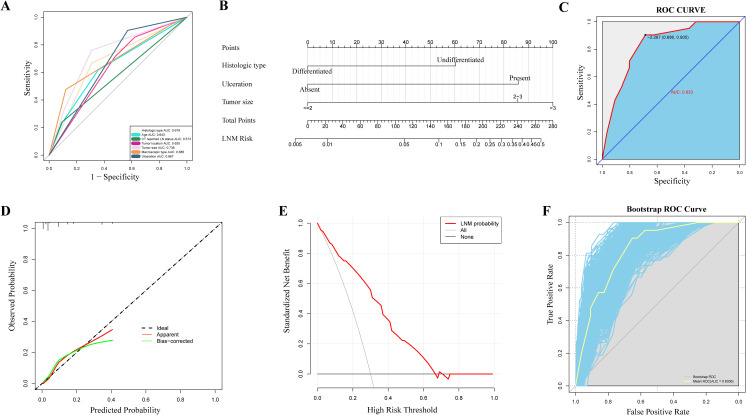 Figure 2
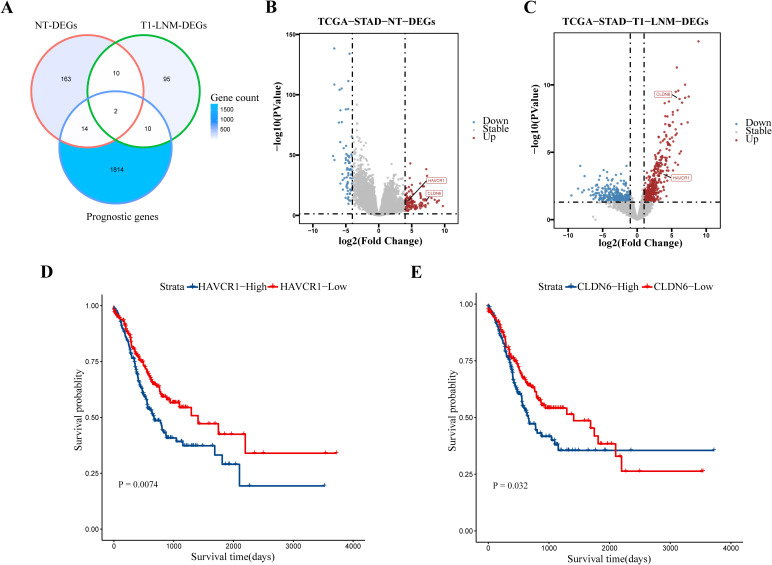 Figure 3
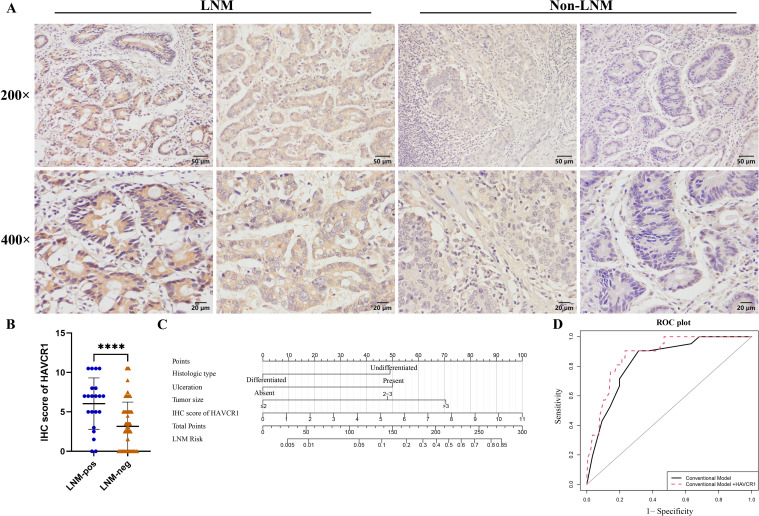 Figure 4
| Variables | Overall (n= 228) | Non-LMN (n=207) | LMN (n=21) | P-value |
|---|---|---|---|---|
| Gender | 0.698 | |||
| Female | 52 (22.8%) | 46 (22.2%) | 6 (28.6%) | |
| Male | 176 (77.2%) | 161 (77.8%) | 15 (71.4%) | |
| Age (years) |
| |||
| ≤50 | 25 (11.0%) | 20 (9.7%) | 5 (23.8%) | |
| 50-60 | 62 (27.2%) | 54 (26.1%) | 8 (38.1%) | |
| >60 | 141 (61.8%) | 133 (64.3%) | 8 (38.1%) | |
| Family history of gastrointestinal cancer | 0.569 | |||
| Absent | 199 (87.3%) | 182 (87.9%) | 17 (81.0%) | |
| Present | 29 (12.7%) | 25 (12.1%) | 4 (19.0%) | |
| Smoking | 0.622 | |||
| Absent | 131 (57.5%) | 120 (58.0%) | 11 (52.4%) | |
| Present | 97 (42.5%) | 87 (42.0%) | 10 (47.6%) | |
| Alcoholism | 0.972 | |||
| Absent | 173 (75.9%) | 157 (75.8%) | 16 (76.2%) | |
| Present | 55 (24.1%) | 50 (24.2%) | 5 (23.8%) | |
| FOBT | 0.379 | |||
| Negative | 194 (85.1%) | 178 (86.0%) | 16 (76.2%) | |
| Positive | 34 (14.9%) | 29 (14.0%) | 5 (23.8%) | |
| Histologic type |
| |||
| Differentiated | 150 (65.8%) | 143 (69.1%) | 7 (33.3%) | |
| Undifferentiated | 78 (34.2%) | 64 (30.9%) | 14 (66.7%) | |
| CT-reported LN status | 0.088 | |||
| Absent | 204 (89.5%) | 188 (90.8%) | 16 (76.2%) | |
| Present | 24 (10.5%) | 19 (9.2%) | 5 (23.8%) | |
| Tumor location | 0.080 | |||
| Cardia/fundus | 81 (35.5%) | 78 (37.7%) | 3 (14.3%) | |
| Gastric body | 33 (14.5%) | 30 (14.5%) | 3 (14.3%) | |
| Antrum/pylorus | 114 (50.0%) | 99 (47.8%) | 15 (71.4%) | |
| Tumor size (cm) |
| |||
| ≤2 | 148 (64.9%) | 143 (69.1%) | 5 (23.8%) | |
| 2-3 | 50 (21.9%) | 41 (19.8%) | 9 (42.9%) | |
| >3 | 30 (13.2%) | 23 (11.1%) | 7 (33.3%) | |
| Macroscopic type |
| |||
| Protruded | 23 (10.1%) | 22 (10.6%) | 1 (4.8%) | |
| Superficial | 170 (74.6%) | 160 (77.3%) | 10 (47.6%) | |
| Excavated | 35 (15.4%) | 25 (12.1%) | 10 (47.6%) | |
| Ulceration |
| |||
| Absent | 91 (39.9%) | 89 (43.0%) | 2 (9.5%) | |
| Present | 137 (60.1%) | 118 (57.0%) | 19 (90.5%) | |
| Atrophic/Intestinal metaplasia background | 0.901 | |||
| Absent | 144 (63.2%) | 131 (63.3%) | 13 (61.9%) | |
| Present | 84 (36.8%) | 76 (36.7%) | 8 (38.1%) | |
| Spontaneous bleeding | 0.240 | |||
| Absent | 159 (69.7%) | 142 (68.6%) | 17 (81.0%) | |
| Present | 69 (30.3%) | 65 (31.4%) | 4 (19.0%) | |
| The color of the lesion | 1.000 | |||
| Red | 190 (83.3%) | 172 (83.1%) | 18 (85.7%) | |
| White | 38 (16.7%) | 35 (16.9%) | 3 (14.3%) | |
| Clear boundaries | 1.000 | |||
| Absent | 45 (19.7%) | 41 (19.8%) | 4 (19.0%) | |
| Present | 183 (80.3%) | 166 (80.2%) | 17 (81.0%) | |
| ALB (g/L) | 41.45 [39.08, 43.80] | 41.40 [39.05, 43.80] | 41.80 [39.10, 42.60] | 0.979 |
| Fib (g/L) | 2.92 [2.58, 3.25] | 2.94 [2.55, 3.24] | 2.90 [2.73, 3.27] | 0.599 |
| LHD (mmol/L) | 166.00 [148.00, 191.00] | 165.00 [147.00, 190.50] | 178.00 [155.00, 193.00] | 0.192 |
| WBC (109/L) | 5.55 [4.60, 6.75] | 5.60 [4.60, 6.77] | 5.30 [4.50, 6.40] | 0.594 |
| NE (109/L) | 3.17 [2.50, 4.16] | 3.16 [2.50, 4.20] | 3.20 [2.20, 3.60] | 0.541 |
| LY (109/L) | 1.60 [1.26, 2.07] | 1.60 [1.25, 2.08] | 1.60 [1.30, 2.04] | 0.892 |
| MO (109/L) | 0.38 [0.30, 0.50] | 0.38 [0.30, 0.50] | 0.40 [0.34, 0.40] | 0.551 |
| HGB (g/L) | 137.00 [125.00, 147.00] | 137.00 [125.00, 146.50] | 130.00 [121.00, 149.00] | 0.858 |
| NLR | 1.89 [1.38, 2.78] | 1.89 [1.38, 2.78] | 1.86 [1.23, 2.29] | 0.483 |
| MLR | 0.23 [0.17, 0.33] | 0.23 [0.17, 0.31] | 0.23 [0.19, 0.36] | 0.434 |
| Clinicopathological features | Univariate analysis | Multivariate analysis | ||
|---|---|---|---|---|
|
| OR (95%CI) |
| OR (95%CI) | |
| Gender | ||||
| Female | Reference | |||
| Male | 0.51 | 0.71 (0.26-1.94) | ||
| Age (years) | ||||
| ≤50 | Reference | |||
| 50-60 | 0.404 | 0.59 (0.17-2.03) | ||
| >60 |
| 0.24 (0.07-0.81) | ||
| Family history of gastrointestinal cancer | ||||
| Absent | Reference | |||
| Present | 0.366 | 1.71 (0.53-5.50) | ||
| Smoking | ||||
| Absent | Reference | |||
| Present | 0.622 | 1.25 (0.51-3.08) | ||
| Alcoholism | ||||
| Absent | Reference | |||
| Present | 0.972 | 0.98 (0.34-2.81) | ||
| FOBT | ||||
| Negative | Reference | |||
| Positive | 0.236 | 1.92 (0.65-5.64) | ||
| Histologic type | ||||
| Differentiated | Reference | |||
| Undifferentiated |
| 4.47 (1.72-11.61) |
| 3.12 (1.16-9.02) |
| CT-reported LN status | ||||
| Absent | Reference | |||
| Present |
| 3.09 (1.02-9.38) | ||
| Tumor location | ||||
| Cardia/fundus | Reference | |||
| Gastric body | 0.258 | 2.60 (0.50-13.60) | ||
| Antrum/pylorus |
| 3.94 (1.10-14.08) | ||
| Tumor size (cm) | ||||
| ≤2 | Reference | Reference | ||
| 2-3 |
| 6.28 (1.99-19.76) |
| 5.03 (1.57-17.80) |
| >3 |
| 8.70 (2.55-29.75) |
| 6.59 (1.85-25.00) |
| Macroscopic type | ||||
| Protruded | Reference | |||
| Superficial | 0.767 | 1.37 (0.17-11.26) | ||
| Excavated |
| 8.80 (1.04-74.38) | ||
| Ulceration | ||||
| Absent | Reference | Reference | ||
| Present |
| 7.17 (1.63-31.59) |
| 5.06 (1.33-33.20) |
| Atrophic/Intestinal metaplasia background | ||||
| Absent | Reference | |||
| Present | 0.901 | 1.06 (0.42-2.68) | ||
| Spontaneous bleeding | ||||
| Absent | Reference | |||
| Present | 0.248 | 0.51 (0.17-1.59) | ||
| The color of the lesion | ||||
| Red | Reference | |||
| White | 0.759 | 0.82 (0.23-2.93) | ||
| Clear boundaries | ||||
| Absent | Reference | |||
| Present | 0.934 | 1.05 (0.34-3.28) | ||
| ALB (g/L) | 0.989 | 1.00 (0.90-1.11) | ||
| Fib (g/L) | 0.284 | 1.44 (0.74-2.82) | ||
| LHD (mmol/L) | 0.277 | 1.01 (0.99-1.02) | ||
| WBC (109/L) | 0.533 | 0.92 (0.70-1.20) | ||
| NE (109/L) | 0.588 | 0.92 (0.68-1.25) | ||
| LY (109/L) | 0.736 | 0.88 (0.43-1.82) | ||
| MO (109/L) | 0.704 | 1.78 (0.09-34.8) | ||
| HGB (g/L) | 0.671 | 1.00 (0.97-1.02) | ||
| NLR | 0.305 | 1.08 (0.93-1.25) | ||
| MLR | 0.730 | 1.58 (0.12-21.26) | ||
| Model | C-statistic Estimate (95% CI) |
| NRI Estimate (95% CI) |
| IDI Estimate (95% CI) |
|
|---|---|---|---|---|---|---|
|
| 0.833(0.757-0.909) |
| Reference |
| Reference |
|
|
| 0.878 | 0.6749 (0.267- 1.083) | 0.0879 (0.017- 0.159) |
Peer Reviews
No public reviews on file for this paper yet. If you reviewed it on a platform where reviews are public (OpenReview, ICLR, NeurIPS, ICML), you can paste yours below so the community can read it here.
Videos
No videos yet. Explain this paper in a talk, walkthrough, or lecture? Add one.
Taxonomy
TopicsGastric Cancer Management and Outcomes · Gastrointestinal Tumor Research and Treatment · Esophageal Cancer Research and Treatment
Introduction
1
Gastric cancer (GC) is the fifth most common cancer and the fourth leading cause of cancer-related death worldwide (1). In China, it ranks third in both incidence and mortality among all cancer types (2). Early gastric cancer (EGC) is defined as a tumor confined to the mucosal or submucosal layers of the stomach, regardless of lymph node metastasis (LNM) (3). LNM is recognized as one of the most critical prognostic factors in EGC (4). The presence of LNM not only profoundly influences the overall survival and recurrence rates of EGC patients but also plays a crucial role in determining the appropriate treatment strategies (5). For EGC patients without LNM who are suitable for surgery, minimally invasive procedures like endoscopic mucosal resection (EMR) and endoscopic submucosal dissection (ESD) are commonly used (6). For those at risk of LNM, standard gastrectomy with D2 lymph node dissection is the preferred approach (7). Therefore, accurately predicting the status of LNM in EGC before surgery is of great clinical importance.
However, accurately assessing the risk of LNM before surgery remains a significant clinical challenge. Currently, the National Comprehensive Cancer Network (NCCN) has not recommended any specific imaging modality for the accurate detection of LNM (8). Although modalities such as multidetector computed tomography (MDCT), endoscopic ultrasonography (EUS), magnetic resonance imaging (MRI), and positron emission tomography-computed tomography (PET-CT) are available, none of these methods can reliably and accurately evaluate the lymph node status in gastric cancer patients (9, 10). Although many studies have developed models to predict LNM, most of these models incorporate risk factors that can only be determined postoperatively, such as tumor invasion depth, presence of lymphatic invasion, vascular invasion, and pathological T staging (11–18). These indicators are not available preoperatively. And Some researchers have utilized multiphoton imaging to extract and analyze collagen characteristics in tumor specimens to predict LNM. However, this approach involves highly complex techniques and is associated with significant costs, limiting its widespread application (19, 20). In recent years, studies have developed sensitive biomarkers for predicting LNM through transcriptomic analysis. These studies have established predictive models composed of multiple genes or long non-coding RNA (LncRNA) combined with clinicopathological factors to enhance the identification of LNM (21, 22). However, these studies require the expression analysis of multiple genes in patient tissues, which limits their clinical applicability.
To the best of our knowledge, no studies have yet utilized transcriptomic analysis to identify biomarkers for immunohistochemical (IHC) analysis of protein expression in preoperative biopsy tissues, combined with preoperative clinicopathological factors, to develop a model for predicting LNM in EGC. Therefore, this study aims to enhance the predictive performance of a conventional model developed using preoperative clinicopathological factors by incorporating IHC expression results of identified biomarkers. This improved model will provide critical guidance for selecting treatment strategies and evaluating prognosis in patients with EGC.
Materials and methods
2
Patient recruitment
2.1
We conducted a retrospective analysis of patients who underwent early gastric cancer resection at the Second Hospital of Hebei Medical University between November 2009 and April 2024 (Figure 1). Out of 295 patients reviewed, 228 met the inclusion criteria. Eligible patients were those undergoing their first curative gastrectomy with standard D1+/D2 lymph node dissection and were histopathologically confirmed to have early-stage gastric cancer. They also underwent comprehensive preoperative assessments including blood tests, gastroscopy with biopsy, and CT scans. Sixty-seven patients were excluded based on the following criteria: 1) incomplete clinical pathological data; 2) preoperative biopsy not confirming cancer or without a clear cancer report; 3) patients with multiple primary gastric cancer sites; 4) patients with other primary malignancies; 5) patients who had undergone chemotherapy or radiotherapy prior to surgery; 6) patients with severe liver, kidney, or hematologic diseases; 7) patients with distant metastases. It is worth noting that EGC patients who received minimally invasive treatments, such as ESD or EMR, were excluded because, without standard lymph node dissection, it is not possible to accurately determine whether LNM is present. Based on the presence or absence of LNM in surgical pathology specimens, patients were categorized into two groups: those with LNM and those without LNM. This study was approved by the Ethics Committee of the Second Hospital of Hebei Medical University (2024-R532), conducted in accordance with the ethical standards of the Helsinki Declaration, and informed consent was obtained from all participants.
Flow diagram of the study design. EGC, early gastric cancer; LNM, lymph node metastasis; NT, Normal-vs-Tumor; DEGs, differentially expressed genes.
Clinical pathological data collection
2.2
Characteristics of patients, including age and gender, were collected along with data from electronic medical records, endoscopy information platforms, and pathology databases. Information gathered from electronic medical records included family history of gastrointestinal cancer, alcohol consumption history, smoking history, and CT imaging data. Laboratory parameters such as fecal occult blood test (FOBT), albumin (ALB), fibrinogen (Fib), lactate dehydrogenase (LDH), white blood cells (WBC) count, neutrophils (NE) count, lymphocytes (LY) count, monocytes (MO) count, hemoglobin (HGB), neutrophil-to-lymphocyte ratio (NLR), and monocyte-to-lymphocyte ratio (MLR) were also gathered. CT scans assessed for enlarged lymph nodes were confirmed by two independent radiologists. Preoperative gastroscopy data from the endoscopy platform included lesion location, tumor size, endoscopic macroscopic features, the presence of ulcers, background of atrophy/intestinal metaplasia, spontaneous bleeding, lesion color, and clarity of boundaries. Lesion sites were categorized as cardia/fundus, gastric body, or antrum/pylorus. Tumor size was recorded as the maximum diameter measured during gastroscopy. Macroscopic features were classified according to the Paris classification (23) into protruded, superficial, or excavated types. Pathology results obtained from the pathology platform divided pathological types into differentiated (highly or moderately differentiated tubular and papillary adenocarcinomas) and undifferentiated (poorly differentiated adenocarcinoma, signet ring cell carcinoma, and mucinous carcinoma).
Identification of biomarkers associated with lymph node metastasis in early gastric cancer
2.3
The RNA sequencing (RNA-seq) data was downloaded from The Cancer Genome Atlas (TCGA) public data platform (https://portal.gdc.cancer.gov/) which included samples from 412 stomach adenocarcinoma (STAD) tissues and 36 normal tissues. Pathological stage T1 RNA-seq data, including 16 LNM-negative and 5 LNM-positive samples, were selected for further analysis. Differential gene expression analysis was conducted using the “edgeR” package (24) comparing tumor versus normal samples and T1 stage LNM versus non-LNM samples. Significant thresholds were set at a false discovery rate (FDR) < 0.05 and |log2 Fold Change (FC)| > 4.0 and |log2 FC| > 1.0, respectively. Genes identified at the intersection of significant differential expression and prognostic relevance were considered potential biomarkers for LNM, visualized in Venn diagrams using the “ggVennDiagram” package (25). The “ggplot2” package was used to create volcano plots. Univariate Cox analysis with the “survival” package distinguished genes with prognostic value, and visualize survival curves using the “survminer” package.
Immunohistochemistry
2.4
Paraffin-embedded tissue sections were deparaffinized with xylene and rehydrated through a graded ethanol series. Antigens were retrieved by high-pressure heat treatment, followed by cooling to room temperature. Endogenous peroxidase was blocked using 3% H2O2 for 10 minutes. The sections were then incubated overnight at 4°C with the primary antibody Hepatitis A Virus Cellular Receptor 1 (HAVCR1) (final dilution 1:100; SAB; #31156). Afterward, a universal Horseradish Peroxidase (HRP) -conjugated enhanced enzyme-labeled goat anti-rabbit secondary antibody (ZSGB-BIO; PV-9001) was applied and incubated at 37°C for 30 minutes. The staining was developed with diaminobenzidine (DAB), counterstained with hematoxylin, dehydrated, and coverslipped.
Evaluation of immunohistochemical staining
2.5
All stained slides were independently evaluated by two experienced researchers who were blinded to the clinical pathological data. The IHC score for HAVCR1 expression was determined by multiplying the staining intensity by the percentage of positive cells in the tissue sections (26). Staining intensity was scored as 0 (negative), 1 (weak), 2 (moderate), and 3 (strong). The average percentage of marker-positive tumor cells in a given sample was calculated across five regions at 400x magnification. The proportion of positive cells was categorized as follows: 0 (0%-5%), 1 (6%-25%), 2 (26%-50%), 3 (51%-75%), and 4 (76%-100%). The final HAVCR1 expression score ranged from 0 to 12. For further analysis, all EGC patients were divided into low and high HAVCR1 expression groups based on the median IHC score of 3.5.
Statistical analysis
2.6
Data analysis and graphing were performed using GraphPad Prism (Version 9.5), IBM SPSS Statistics (Version 25.0), and R software (Version 4.3.2). Normality tests were conducted for continuous variables. For normally distributed variables, Student’s t-test was used, while the Mann-Whitney U test was applied for non-normally distributed data. Categorical variables were compared using the chi-square test or Fisher’s exact test, as appropriate. Binary logistic regression was employed to analyze risk factors for LNM. Variables with significant differences (P-value < 0.01) in univariate analysis were included in the multivariate logistic regression analysis to identify independent risk factors. In the multivariate analysis, variables with a P-value < 0.05 were considered independent risk factors. These factors were then used to construct a predictive model and develop a nomogram. Additionally, receiver operating characteristic (ROC) curves were plotted to calculate the area under the curve (AUC) to quantify the nomogram’s discriminative ability. The model’s predictive accuracy was evaluated using the concordance statistic (C-statistic) and calibration curves to assess the agreement between predicted and observed LNM probabilities. Decision curve analysis (DCA) was performed to determine net benefit. Internal validation of the model’s predictive accuracy was conducted using 1,000 bootstrap resamples. Additionally, the net reclassification improvement (NRI) (27) and integrated discrimination improvement (IDI) were calculated to assess the incremental predictive value of biomarkers for LNM risk. The following R packages were used: “rms” for logistic regression, nomogram construction, and calibration curves; “pROC” for ROC curve plotting; “rmda” for DCA analysis; “PredictABEL” for NRI and IDI analysis; and “caret” for Bootstrap internal validation. The corresponding R code, which details the analysis pipeline, has been uploaded to GitHub (URL: https://github.com/liuziyang-1/Logistic). For all comparisons, a two-sided P-value < 0.05 was considered statistically significant.
Results
3
Baseline characteristics of patients
3.1
A total of 228 patients were included in the study based on the inclusion and exclusion criteria. The baseline characteristics are summarized in Table 1. Among the 228 patients, 21 were confirmed to have LNM, resulting in a metastasis rate of 9.2%. Of the patients, 119 (52.2%) had tumors confined to the mucosal layer (T1a), while 109 (47.8%) had tumors invading the submucosal layer (T1b), with LNM positivity rates of 5.9% and 12.8%, respectively.
Univariate and multivariate logistic regression analysis
3.2
We summarized the results of univariate and multivariate logistic regression analyses for factors associated with LNM (Table 2). Univariate analysis identified factors such as age, histologic type, CT findings, tumor location, tumor size, macroscopic type, and presence of ulceration as being related to LNM in EGC. These factors were visualized in a univariate ROC curve (Figure 2A). Due to the relatively small sample size in this study, we strictly selected variables for modeling by including only those with a p-value < 0.01 in the multivariate analysis. The multivariate analysis revealed that histologic type (Odds Ratio (OR) = 3.12, 95% Confidence Interval (CI): 1.16–9.02, P = 0.028), tumor size (OR = 5.03, 95% CI: 1.57–17.80, P = 0.008; OR = 6.59, 95% CI: 1.85–25.00, P = 0.004), and presence of ulceration (OR = 5.06, 95% CI: 1.33–33.20, P = 0.038) were independent risk factors for LNM in EGC patients.
Construction and evaluation of a nomogram for predicting lymph node metastasis. (A) Receiver operating characteristic curves of potential risk factors of lymph node metastasis in early gastric cancer by univariate analysis, including histologic type, age, CT reported lymph node status, tumor location, tumor size, macroscopic type and ulceration. (B) Nomogram for the prediction of lymph node metastasis in early gastric cancer. (C) Receiver operating characteristic curves for the prediction of lymph node metastasis in the early gastric cancer set. (D) Calibration curves in the early gastric cancer set. The x-axis represents the predicted probability from the nomogram, and the y-axis is the observed probability of lymph node metastasis in early gastric cancer patients. (E) Decision curve analysis demonstrating the net clinical benefit of our predictive model in the early gastric cancer set. The x-axis calculates the threshold probability. The y-axis, standardized net benefit, represents the clinical net benefit after accounting for both the true positive rate and the consequences of false positives. (F) The receiver operating characteristic curve was obtained after 1000 Bootstrap validations. The yellow curve represents the mean ROC curve obtained from the bootstrap resamples, highlighting the modelig overall predictive performance. The blue curves represent the individual ROC curves from each of the 1000 resamples, showing the variability of the model’s performance across different data subsets. LN, lymph node; AUC, area under the curve; LNM, lymph node metastasis; ROC, receiver operating characteristic.
Construction and evaluation of a nomogram for predicting lymph node metastasis
3.3
We developed a nomogram based on the three identified independent risk factors (Figure 2B). Each variable is assigned a score (ranging from 0 to 100) based on its value, with the total score (ranging from 0 to 280) indicating the probability of LNM. A ROC curve was constructed to evaluate the nomogram’s performance, yielding an AUC of 0.833 (95% CI: 0.757–0.909) (Figure 2C), demonstrating high predictive accuracy. The calibration curve (Figure 2D) indicated good agreement between predicted and observed outcomes. The decision curve (Figure 2E) analysis showed that the nomogram had favorable clinical benefits. Due to the lack of external validation in this study, we performed internal validation using the bootstrap method to assess the model’s predictive performance. After 1,000 bootstrap resamples, the model showed an accuracy of 0.896716, and the ROC curve was plotted (Figure 2F). The blue curve’s close proximity to the yellow curve indicated that the model’s performance is stable and reliable.
Identification and validation of lymph node metastasis-associated biomarkers
3.4
To further enhance the predictive accuracy of our model, we identified biomarkers associated with LNM in early gastric cancer using data mining from the TCGA database. Through the intersection of differentially expressed genes (DEGs) that are highly expressed in gastric cancer tissues with those DEGs highly expressed in early-stage (T1) gastric cancer tissues exhibiting LNM, and with prognostic genes, we identified two biomarkers: HAVCR1 and Claudin 6 (CLDN6) (Figure 3A). Volcano plots (Figures 3B, C) demonstrated that these biomarkers were significantly upregulated in EGC tissues with LNM. Survival curves (Figures 3D, E) revealed that high expression of HAVCR1 and CLDN6 correlated with poorer prognosis. IHC was subsequently performed to validate the protein expression levels of these biomarkers. Notably, preliminary experiments indicated that HAVCR1 protein expression showed significant differences in metastatic gastric cancer tissues, leading to its selection for further validation as a LNM marker. IHC analysis of preoperative biopsy samples indicated that HAVCR1 positive staining was primarily observed on the cell membrane and cytoplasm of tumor cells. Figure 4A illustrates the IHC staining patterns of HAVCR1 in different specimens. We found that the IHC score for HAVCR1 was significantly higher in EGC patients with LNM compared to those without LNM (Figure 4B).
Identification and prognostic analysis of lymph node metastasis-associated biomarkers. (A) A Venn diagram shows the intersection of highly expressed differentially expressed genes in gastric cancer tissues, differentially expressed genes in early-stage (T1) gastric cancer tissues with lymph node metastasis, and prognostic genes, identifying two biomarkers. (B, C) Volcano plots display the high expression of these two biomarkers (HAVCR1 and CLDN6)in gastric cancer tissues and early gastric cancer tissues with lymph node metastasis. Significant thresholds were set at P-value < 0.05 and |log2 Fold Change| > 4.0 and |log2 Fold Change| > 1.0, respectively. (D) Survival curve illustrating the prognostic value of HAVCR1 in gastric cancer patients. (E) Survival curve illustrating the prognostic value of CLDN6 in gastric cancer patients. P < 0.05 is considered to be statistically significant. LNM, lymph node metastasis; NT, Normal-vs-Tumor; DEGs, differentially expressed genes; TCGA, The Cancer Genome Atlas; STAD, stomach adenocarcinoma.
Representative images of HAVCR1 immunohistochemical staining, statistical analysis, and evaluation of HAVCR1’s incremental impact on the conventional model. (A) Representative images of HAVCR1 immunohistochemical staining in early gastric cancer tissues with and without lymph node metastasis. (B) Statistical analysis of HAVCR1 expression in early gastric cancer samples with and without lymph node metastasis based on immunohistochemical scores. (C) The novel nomogram for the prediction of lymph node metastasis in early gastric cancer. The new model includes histologic type, presence of ulceration, tumor size, and IHC score of HAVCR1. (D) Receiver operating characteristic curves showing the incremental impact on predictive accuracy after incorporating HAVCR1 into the conventional model. **** P < 0.0001, P < 0.05 is considered to be statistically significant. LNM, lymph node metastasis; IHC, immunohistochemical; ROC, receiver operating characteristic.
Correlation of HAVCR1 expression with clinicopathological features in early gastric cancer patients and evaluation of its incremental predictive value for lymph node metastasis
3.5
We further analyzed the correlation between HAVCR1 expression levels and clinicopathological parameters in EGC patients’ gastric tissue samples (Supplementary Table S1), using a median IHC score of 3.5 as the cutoff for high and low expression. High HAVCR1 expression was observed in 111 (48.7%) EGC patient samples and was significantly associated with LNM (P = 0.008), with no significant correlation with other clinicopathological factors. To evaluate the impact of HAVCR1 on the predictive model, we incorporated its IHC score into the conventional model to predict LNM probability. The new model includes histologic type, presence of ulceration, tumor size, and IHC score of HAVCR1. We then developed a novel nomogram predictive model (Figure 4C). We found that adding HAVCR1 resulted in an incremental effect on the AUC compared to the conventional model (AUC: conventional model + HAVCR1, 0.878 vs. conventional model, 0.833, P = 0.022) (Figure 4D). Additionally, it improved the model’s reclassification and discrimination abilities (NRI = 0.6749, P = 0.001; IDI = 0.0879, P = 0.015) (Table 3).
Discussion
4
Due to the proactive implementation of national upper gastrointestinal cancer screening programs and the widespread use of gastroscopy among high-risk populations, an increasing number of EGC cases are being detected and diagnosed promptly (28). For EGC patients with no risk of LNM, minimally invasive treatments such as EMR and ESD offer the advantage of preserving gastric function and maintaining quality of life (29). These procedures have emerged as viable alternatives to more invasive surgeries. LNM is considered a key prognostic factor in EGC (30). Since endoscopic resection cannot achieve perigastric lymph node dissection, surgical intervention is still required to achieve curative tumor resection in EGC patients with LNM (31). Therefore, accurately determining the status of LNM is a crucial factor in selecting the most appropriate treatment strategy for EGC (32).
In this study, the incidence of LNM among all EGC patients was 9.2%, which is consistent with or lower than the results reported in most previous studies (10, 33–35). This may be attributed to the relatively high proportion of T1a stage patients in our cohort. In our single-center study, we included a total of 26 preoperatively accessible variables covering various aspects such as pathology, imaging, endoscopy, blood tests, and clinical characteristics, as well as personal history, to comprehensively identify risk factors associated with LNM in EGC patients. We found that tumor size, histologic type, and the presence of ulceration were independent risk factors for LNM in these patients, which is consistent with previous studies (14, 36, 37). Studies have reported a significant association between tumor size and LNM (9). Our study similarly found that the larger the tumor, the higher the risk of lymph node metastasis, with this significance being notably greater than that of other risk factors. A multi-cohort study (13) identified varying degrees of differentiation in EGC as independent risk factors for LNM. Our study also demonstrated that patients with undifferentiated-type cancer have a significantly higher risk of LNM. This finding underscores the importance of accurate preoperative biopsy pathology reports. The presence of an ulcer is also a crucial risk factor that cannot be ignored in clinical practice. It plays a role in determining both the absolute and expanded indications for endoscopic resection (7).
Based on these risk factors, we constructed a predictive model presented in the form of a nomogram. The model demonstrated high clinical predictive performance, as evidenced by ROC curves, DCA, and calibration curves, and underwent internal validation. To further enhance the predictive capability of the model, we incorporated the immunohistochemical expression results of the biomarker HAVCR1. The inclusion of this biomarker improved the sensitivity, specificity, reclassification ability, and discrimination capacity of the final model in predicting LNM. The nomogram-based scoring system for predicting the risk of LNM will greatly benefit the selection of treatment strategies for patients with EGC. To the best of our knowledge, this is the first study to utilize transcriptomics to identify biomarkers for immunohistochemical validation in preoperative biopsy tissues, combined with preoperative clinicopathological factors, to establish a model for predicting the likelihood of LNM in EGC. Our predictive model is based on variables that are readily available preoperatively, enabling an initial assessment of LNM risk prior to surgery. It enhances clinically actionable therapeutic guidance for EGC patients following endoscopic examination and biopsy.
In addition to clinicopathological factors, molecular biomarkers are increasingly being utilized to predict LNM in gastric cancer patients (21, 22, 38–41). In our study, transcriptomic analysis revealed that the mRNA expression level of HAVCR1 is higher in GC tissues compared to adjacent normal tissues, which is consistent with the findings of Liu et al. (42). Our study further demonstrates that HAVCR1 is highly expressed in early gastric cancer patients with lymph node metastasis. The HAVCR1 gene encodes a type I transmembrane glycoprotein (43), which is upregulated in various cancers, including esophageal cancer, lung adenocarcinoma, and gastric adenocarcinoma with different pathological characteristics, and its expression is associated with poor prognosis in these cancers (42, 44, 45). Studies have shown that the overexpression of HAVCR1 can lead to the disruption of tight junctions between cells, which in turn facilitates cancer cell metastasis (46). Additionally, Xue et al. found that HAVCR1 may promote the progression of gastric adenocarcinoma through the MEK/ERK pathway (47). Furthermore, other studies have demonstrated that HAVCR1 plays a significant role in regulating and activating immune responses (48). Given these findings, HAVCR1 holds potential as a target for tumor therapy. Our study found that HAVCR1 is a sensitive biomarker for determining LNM in EGC, both at the mRNA and protein levels, and its IHC expression is independent of other clinicopathological factors.
This study has certain limitations. First, it is a single-center retrospective study with a relatively small sample size. Although the model’s internal validation showed good performance, external validation is lacking. We are committed to addressing this limitation in future research. Our goal is to collaborate with multiple institutions to collect larger and more diverse datasets, enabling external validation and further enhancing the generalizability of our model. Second, there is a selection bias as this study only included patients who underwent gastrectomy, excluding those who received minimally invasive treatments for EGC. Third, due to the fact that the patient enrollment period in this study spans over a decade, advancements in medical technology may have influenced the assessment of endoscopic lesions, pathological examination methods, intraoperative lymph node dissection, and the experience of endoscopists and pathologists, potentially affecting the accuracy of LNM prediction. Fourth, due to the long-time span of the study, some preoperative clinical factors, such as serum tumor markers, Helicobacter pylori antibody testing, and endoscopic ultrasound, were not included in the analysis. Fifth, not all patients had preoperative biopsy specimens tested, and some were diagnosed at other centers, leading to the use of final resection specimens for immunohistochemical validation. Finally, the mechanism by which HAVCR1 is involved in LNM in EGC remains unclear and requires further experimental validation in future studies. Despite these limitations, the strength of our study lies in the incorporation of immunohistochemical expression of biomarkers into the conventional model development process. These factors are strictly available preoperatively, offering practical clinical utility in helping EGC patients select appropriate treatment methods.
Conclusion
5
In conclusion, our study identified the presence of ulcers during endoscopy, tumor size, and biopsy histologic type as independent risk factors for LNM in EGC. We developed a conventional nomogram model based on these factors. By incorporating the immunohistochemical expression of HAVCR1, a biomarker associated with LNM in EGC identified through transcriptomic analysis, we developed a new model based on the conventional model. The predictive performance of this new model, as assessed by the C-statistic, NRI, and IDI, showed significant improvement over the conventional model.
The reference list from the paper itself. Each links out to its DOI / PubMed record.
- 1Yang WJ Zhao HP Yu Y Wang JH Guo L Liu JY. Updates on global epidemiology, risk and prognostic factors of gastric cancer. World J Gastroenterol. (2023) 29:2452–68. doi: 10.3748/wjg.v 29.i 16.2452 PMC 1016790037179585 · doi ↗ · pubmed ↗
- 2Cao W Chen HD Yu YW Li N Chen WQ. Changing profiles of cancer burden worldwide and in China: a secondary analysis of the global cancer statistics 2020. Chin Med J (Engl). (2021) 134:783–91. doi: 10.1097/CM 9.0000000000001474 PMC 810420533734139 · doi ↗ · pubmed ↗
- 3Smyth EC Nilsson M Grabsch H Ivan Grieken NC Lordick F. Gastric cancer. Lancet. (2020) 396:635–48. doi: 10.1016/s 0140-6736(20)31288-5 32861308 · doi ↗ · pubmed ↗
- 4Chen J Zhao G Wang Y. Analysis of lymph node metastasis in early gastric cancer: a single institutional experience from China. World J Surg Oncol. (2020) 18:57. doi: 10.1186/s 12957-020-01834-7 32197625 PMC 7085136 · doi ↗ · pubmed ↗
- 5Wang J Wang L Li S Bai F Xie H Shan H. Risk factors of lymph node metastasis and its prognostic significance in early gastric cancer: A multicenter study. Front Oncol. (2021) 11:649035. doi: 10.3389/fonc.2021.649035 34722232 PMC 8548692 · doi ↗ · pubmed ↗
- 6Ono H Yao K Fujishiro M Oda I Uedo N Nimura S. Guidelines for endoscopic submucosal dissection and endoscopic mucosal resection for early gastric cancer (second edition). Dig Endosc. (2021) 33:4–20. doi: 10.1111/den.13883 33107115 · doi ↗ · pubmed ↗
- 7Japanese Gastric Cancer A. Japanese gastric cancer treatment guidelines 2018 (5th edition). Gastric cancer: Off J Int Gastric Cancer Assoc Japanese Gastric Cancer Assoc. (2021) 24:1–21. doi: 10.1007/s 10120-020-01042-y PMC 779080432060757 · doi ↗ · pubmed ↗
- 8Bai H Deng J Zhang N Liu H He W Liu J. Predictive values of multidetector-row computed tomography combined with serum tumor biomarkers in preoperative lymph node metastasis of gastric cancer. Chin J Cancer Res. (2019) 31:453–62. doi: 10.21147/j.issn.1000-9604.2019.03.07 PMC 661350231354214 · doi ↗ · pubmed ↗