Correction: Long non-coding RNA NKILA inhibits migration and invasion of non-small cell lung cancer via NF-κB/Snail pathway
Zhiliang Lu, Yuan Li, Jingnan Wang, Yun Che, Shouguo Sun, Jianbing Huang, Zhaoli Chen, Jie He

Abstract
Genes, proteins, chemicals, diseases, species, mutations and cell lines named across the full text — each resolved to its canonical identifier and authoritative record.
Click any figure to enlarge with its caption.
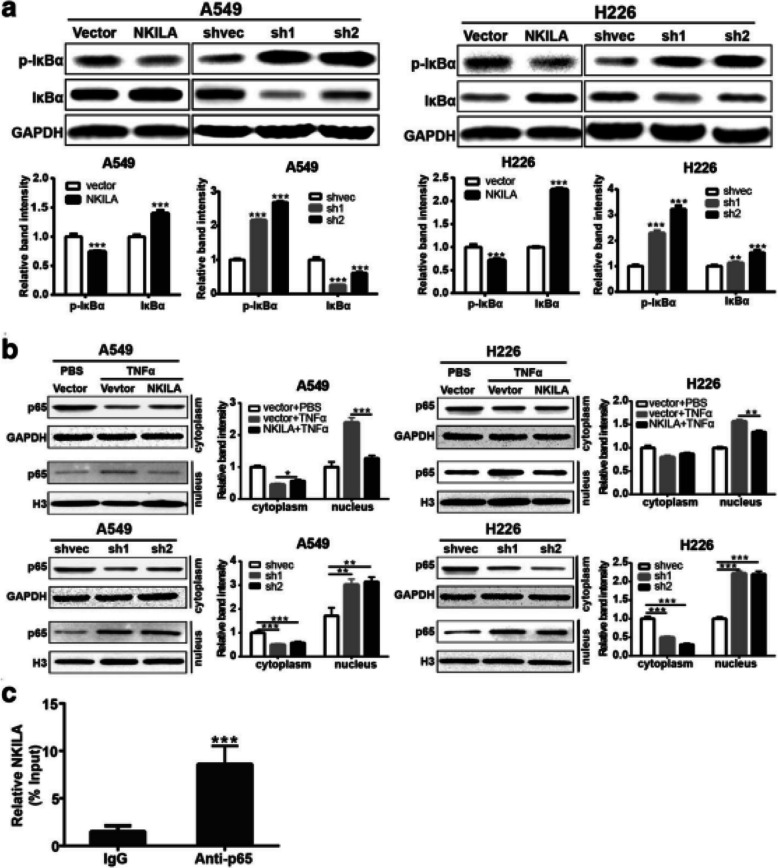 Figure 1
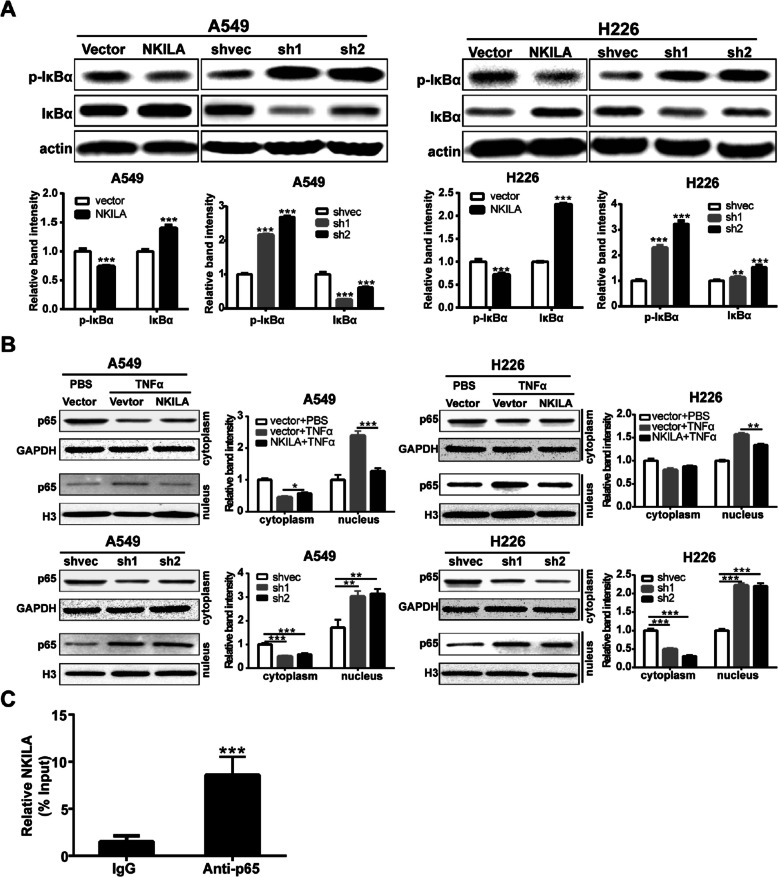 Figure 2
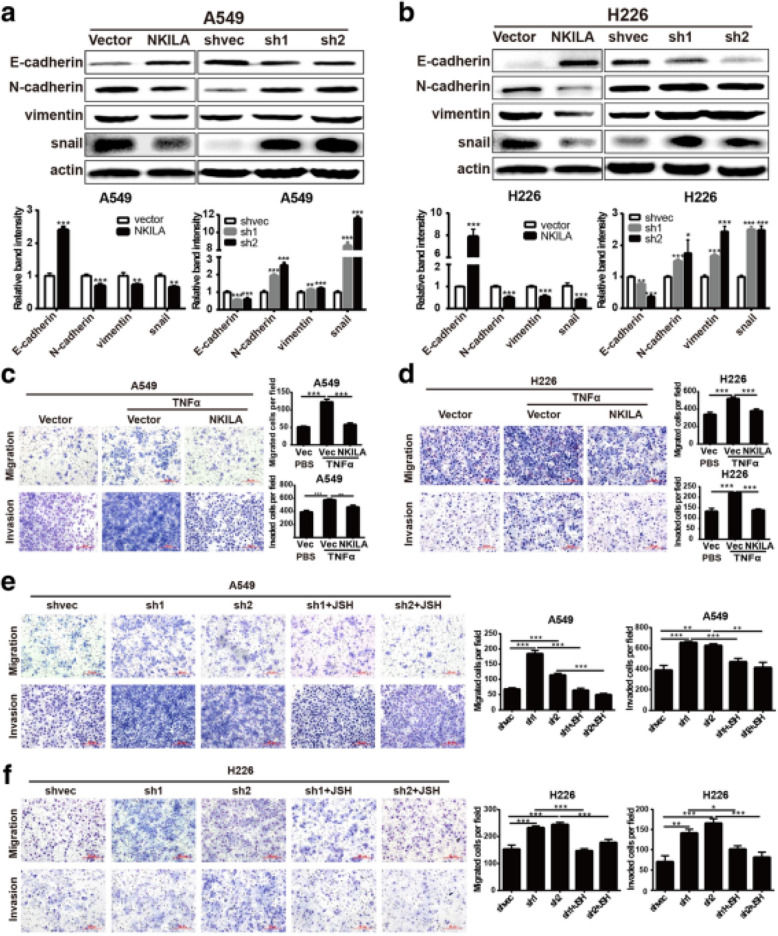 Figure 3
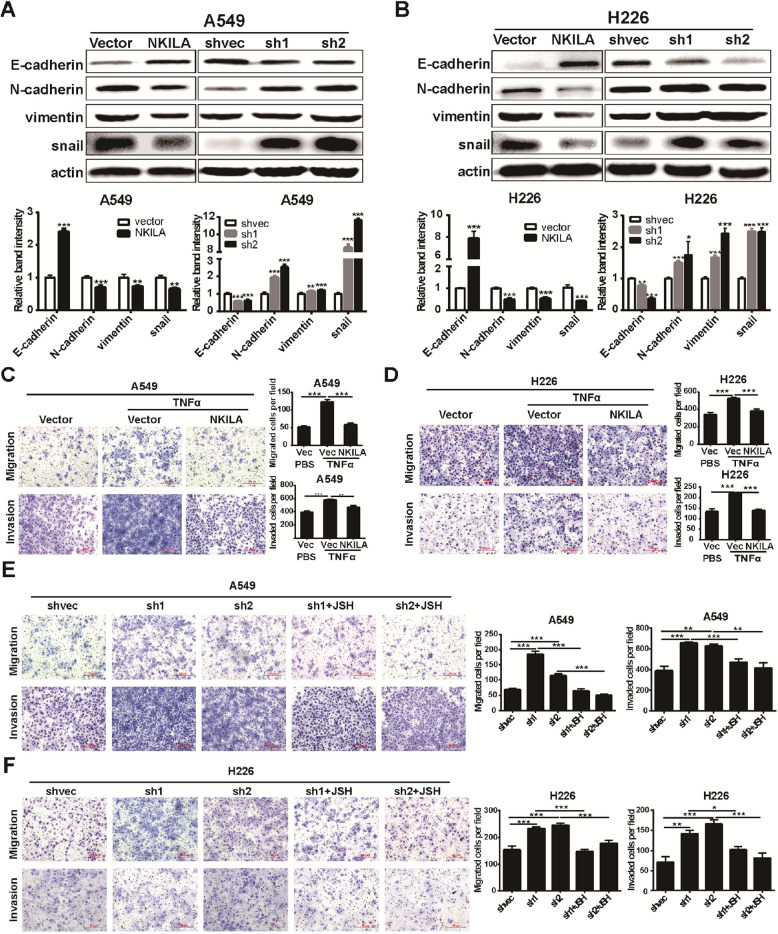 Figure 4
Peer Reviews
No public reviews on file for this paper yet. If you reviewed it on a platform where reviews are public (OpenReview, ICLR, NeurIPS, ICML), you can paste yours below so the community can read it here.
Videos
No videos yet. Explain this paper in a talk, walkthrough, or lecture? Add one.
Taxonomy
TopicsCancer-related molecular mechanisms research · Circular RNAs in diseases · RNA modifications and cancer
Correction: J Exp Clin Cancer Res 36, 54 (2017)
https://doi.org/10.1186/s13046-017–0518-0
Following the publication of the original article [1], the authors found errors in the published version of Fig. 5 and Fig. 6, specifically:
-
In Fig. 5a on page 8, the internal reference of Western Blot should be actin and not GAPDH;
-
In Fig. 5a on page 8 and Fig. 6b on page 9, the internal reference bands of H226 NKILA overexpression were accidentally used duplicate images during editing;
-
The same graphs were used between the H226-shvec invasion and H226-sh2 invasion in Fig. 2d and Fig. 6f this is because the authors conducted the experiments at the same time and thought that it was reasonable using the same graphs to display the same cell line with receiving the same treatment. However, in order to avoid unnecessary misunderstandings, the authors think it is more reasonable to present the graphs of different batches from repeated experiments. Thence, the graphs of H226-shvec invasion and H226-sh2 invasion in Fig. 6f should be replaced.
Below are the correct figures:
Incorrect Fig. 5Fig. 5NKILA negatively regulate IκB phosphorylation and NF-κB activation. a Western blotting showing total and phosphorylated IκBα in A549 and H226 cells. Left panel was representative images and right panel was statistical column diagram. b Western blot for nuclear and cytoplasm p65 in A549 and H226 cells. GAPDH and Histone 3 (H3) is the loading control for cytoplasm and nuclear, respectively. Left panel was representative images and right panel was statistical column diagram. c RIP-derived RNA was measured by qRT-PCR. The levels of qRT-PCR products were expressed as a percentage of input RNA. Data are expressed as means ± SEM. Two-tailed Student’s t-test was used. *p < 0.05, **p < 0.01, ***p < 0.001
Correct Fig. 5Fig. 5NKILA negatively regulate IκB phosphorylation and NF-κB activation. a Western blotting showing total and phosphorylated IκBα in A549 and H226 cells. Left panel was representative images and right panel was statistical column diagram. b Western blot for nuclear and cytoplasm p65 in A549 and H226 cells. GAPDH and Histone 3 (H3) is the loading control for cytoplasm and nuclear, respectively. Left panel was representative images and right panel was statistical column diagram. c RIP-derived RNA was measured by qRT-PCR. The levels of qRT-PCR products were expressed as a percentage of input RNA. Data are expressed as means ± SEM. Two-tailed Student’s t-test was used. *p < 0.05, **p < 0.01, ***p < 0.001
Incorrect Fig. 6Fig. 6NKILA regulate NSCLC cell mobility via NF-κB/Snail pathway. a and b The expression levels of classical EMT markers in A549 (a) and H226 (b) cells were measured by western blot. c and d Migration and invasion ofA549 and H226 stably expressing NKILA or mock-vehicle control with or without TNFα stimuli measured by Chamber assay. (e and f) Migration and invasion of A549 and H226 stably expressing NKILA shRNA or negative control with or without JSH-23 (JSH) measured by Chamber assay. Left panel was representative images and right panel was statistical column diagram. Data are expressed as means ± SEM, n = 3. *p < 0.05, **p < 0.01, ***p < 0.001
Correct Fig. 6Fig. 6NKILA regulate NSCLC cell mobility via NF-κB/Snail pathway. a and b The expression levels of classical EMT markers in A549 (a) and H226 (b) cells were measured by western blot. c and d Migration and invasion ofA549 and H226 stably expressing NKILA or mock-vehicle control with or without TNFα stimuli measured by Chamber assay. (e and f) Migration and invasion of A549 and H226 stably expressing NKILA shRNA or negative control with or without JSH-23 (JSH) measured by Chamber assay. Left panel was representative images and right panel was statistical column diagram. Data are expressed as means ± SEM, n = 3. *p < 0.05, **p < 0.01, ***p < 0.001
The corrections do not compromise the validity of the conclusions and the overall content of the article. The original article [1] has been updated.