Healthcare Cost Coverage and Hypertension and Diabetes Care Step Movement: A Five‐Year Follow‐Up Study in a Malaysian Semi‐Rural Community
Adeola Folayan, Quek Kia Fatt, Mark Wing Loong Cheong, Tin Tin Su

TL;DR
A five-year study in Malaysia found that healthcare cost coverage did not improve care progression for hypertension and diabetes but reduced backward movement in treatment and control.
Contribution
This study is novel in analyzing how healthcare cost coverage affects backward movement in hypertension and diabetes care over five years in a semi-rural community.
Findings
Healthcare cost coverage did not contribute to care step progression for hypertension and diabetes.
HCC reduced significant backward movement in diabetes treatment and blood pressure control compared to those without HCC.
Those without HCC experienced significant backward movement in treatment and control over five years.
Abstract
This study aims to understand how healthcare cost coverage (HCC) status affects hypertension and diabetes care across the three major care steps: awareness, treatment initiation and control. The probability of progressing the care steps was determined with logistic regression. The backward movements of two care steps (treatment and control) were investigated using McNemar's tests and presented with a Sankey diagram. All results were disintegrated by HCC status. There was no evidence that having HCC contributed to any care step progression. However, there was no significant backward movement for diabetes treatment and blood pressure control for those with HCC, while those without HCC had a significant backward movement for diabetes treatment (54.3% [152/280], p < 0.001) and blood pressure control (31.6% [43/136], p = 0.04). Our results suggest that HCC supported a reduction in…
Genes, proteins, chemicals, diseases, species, mutations and cell lines named across the full text — each resolved to its canonical identifier and authoritative record.
Click any figure to enlarge with its caption.
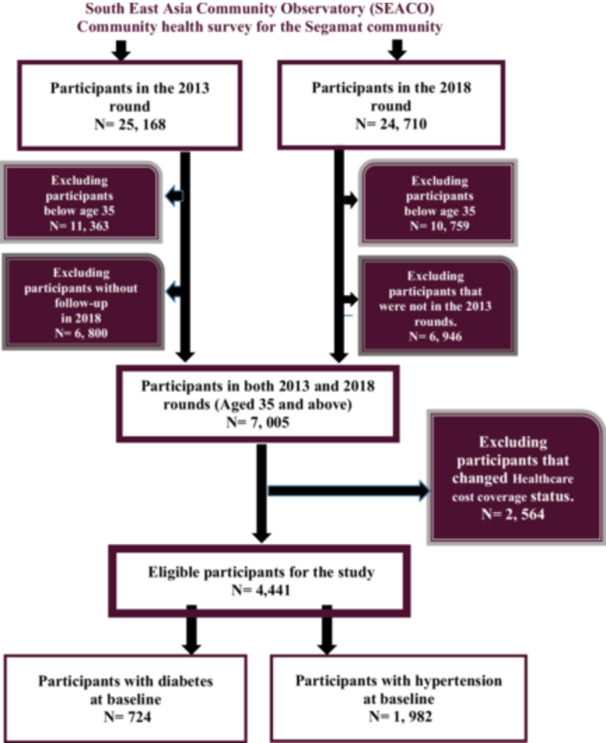 Figure 1
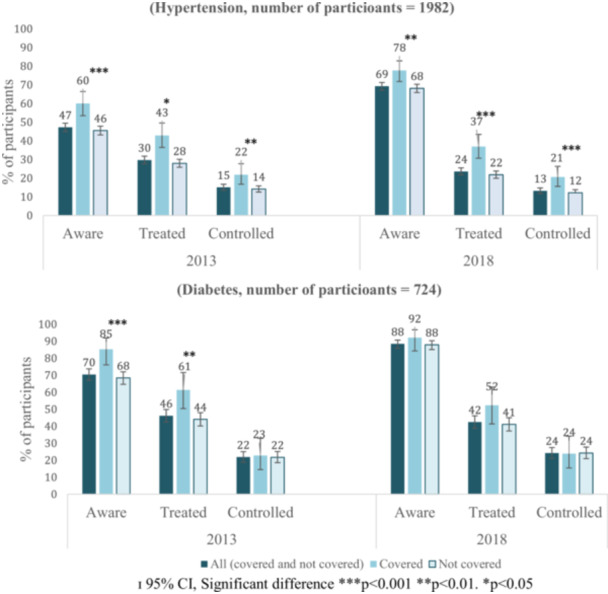 Figure 2
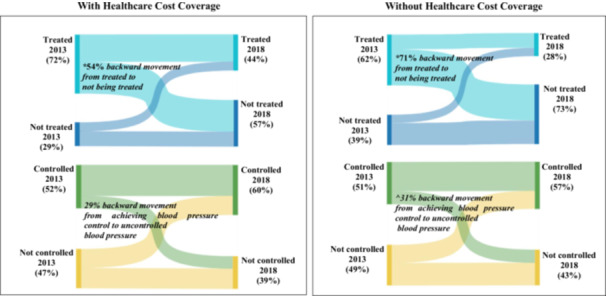 Figure 3
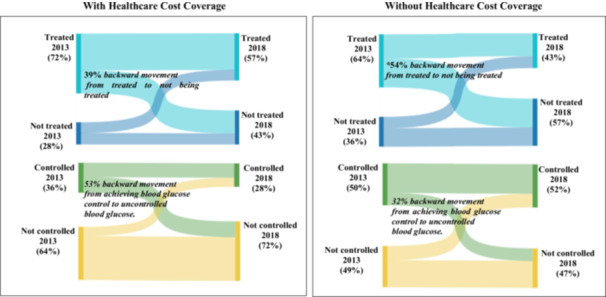 Figure 4
| Variables |
With healthcare cost coverage ( |
Without healthcare cost coverage ( |
Total (
| |
|---|---|---|---|---|
| Age | 35–44 | 12 (5.2) | 186 (10.6) | 198 (10.0) |
| 45–54 | 48 (20.6) | 424 (24.2) | 472 (23.8) | |
| 55–64 | 78 (33.5) | 693 (39.6) | 771 (38.9) | |
| ≥ 65 | 95 (40.8) | 446 (25.5) | 541 (27.3) | |
| Gender | Female | 116 (49.8) | 1099 (62.8) | 1215 (61.3) |
| Male | 117 (50.2) | 650 (37.2) | 767 (38.7) | |
| Ethnicity | Malay | 144 (68.0) | 1131 (66.3) | 1275 (64.3) |
| Chinese | 54 (18.8) | 388 (20.2) | 442 (22.3) | |
| Indian | 27 (9.6) | 207 (11.8) | 234 (11.8) | |
| Others | 8 (3.3) | 23 (1.6) | 31 (1.6) | |
| Marital Status | Married | 196 (84.1) | 1424 (81.4) | 1620 (81.7) |
| Never married | 3 (1.3) | 46 (2.6) | 49 (2.5) | |
| Divorced | 3 (1.3) | 18 (1.0) | 21 (1.1) | |
| Widow(er) | 31 (13.3) | 245 (14.0) | 276 (13.9) | |
| Others | 0 (0.0) | 12 (0.7) | 12 (0.6) | |
|
|
| |||
| Education | No formal education | 21 (9.0) | 53 (3.0) | 74 (3.7) |
| Primary | 144 (61.8) | 1283 (73.4) | 1427 (72.0) | |
| Secondary | 5 (2.1) | 19 (1.1) | 24 (1.2) | |
| Tertiary | 9 (3.9) | 13 (0.7) | 22 (1.1) | |
| Others | 54 (23.2) | 349 (20.0) | 403 (20.3) | |
|
|
|
| ||
| Employment status | Paid Employee | 56 (24.0) | 313 (17.9) | 369 (18.6) |
| Self‐employed | 28 (12.0) | 326 (18.6) | 354 (17.9) | |
| House wife/husband | 63 (27.0) | 764 (43.7) | 827 (41.7) | |
| Not working | 44 (18.9) | 231 (13.2) | 275 (13.9) | |
| Pensioner | 42 (18.0) | 108 (6.2) | 150 (7.6) | |
|
|
|
| ||
| Household income (RM) | B40 (< 3855) | 227 (97.4) | 1722 (98.5) | 1949 (98.3) |
| M40 (3856–8135) | 5 (2.1) | 25 (1.4) | 30 (1.5) | |
| T20 (> 8135) | 1 (0.4) | 2 (0.1) | 3 (0.2) | |
| Household Size | < 4 | 130 (55.8) | 878 (39.8) | 1008 (50.9) |
| = 4 | 27 (11.6) | 259 (17.0) | 286 (14.4) | |
| > 4 | 76 (32.6) | 608 (42.7) | 684 (34.5) | |
|
|
| |||
| Variables |
With healthcare cost coverage ( |
Without healthcare cost coverage ( |
Total (
| |
|---|---|---|---|---|
| Age | 35–44 | 7 (8.0) | 59 (9.3) | 66 (9.1) |
| 45–54 | 16 (18.2) | 182 (28.6) | 198 (27.3) | |
| 55–64 | 33 (37.5) | 260 (40.9) | 293 (40.5) | |
| ≥ 65 | 32 (36.4) | 135 (21.2) | 167 (23.1) | |
| Gender | Female | 44 (50.0) | 404 (63.5) | 448 (61.9) |
| Male | 44 (50.0) | 232 (36.5) | 276 (38.1) | |
| Ethnicity | Malay | 54 (61.4) | 385 (60.5) | 439 (60.6) |
| Chinese | 16 (18.2) | 103 (16.2) | 119 (16.4) | |
| Indian | 16 (18.2) | 143 (22.5) | 159 (22.0) | |
| Others | 2 (2.3) | 5 (0.8) | 7 (1.0) | |
| Marital status | Married | 70 (79.5) | 520 (81.8) | 590 (81.5) |
| Never married | 1 (1.1) | 14 (2.2) | 15 (2.1) | |
| Divorced | 2 (2.3) | 6 (0.9) | 8 (1.1) | |
| Widow(er) | 15 (17.0) | 91 (14.3) | 106 (14.6) | |
| Others | 0 (0.0) | 5 (0.8) | 5 (0.7) | |
| Education | No formal education | 7 (8.0) | 26 (4.1) | 33 (4.6) |
| Primary | 57 (64.8) | 457 (71.9) | 514 (71.0) | |
| Secondary | 3 (3.4) | 10 (1.6) | 13 (1.8) | |
| Tertiary | 1 (1.1) | 6 (0.9) | 7 (1.0) | |
| Others | 20 (22.7) | 130 (20.4) | 150 (20.7) | |
|
|
|
| ||
| Employment status | Paid Employee | 23 (13.6) | 118 (18.6) | 141 (19.5) |
| Self‐employed | 6 (6.8) | 100 (15.7) | 106 (14.6) | |
| House wife/husband | 27 (30.7) | 279 (43.9) | 306 (42.3) | |
| Not working | 20 (22.7) | 92 (14.5) | 112 (15.5) | |
| Pensioner | 12 (13.6) | 44 (6.9) | 56 (7.7) | |
|
|
|
| ||
| Household income (RM) | B40 (< 3855) | 87 (98.9) | 619 (97.3) | 706 (97.5) |
| M40 (3856–8135) | 1 (1.1) | 14 (2.2) | 15 (2.1) | |
| T20 (> 8135) | 0 (0.0) | 3 (0.5) | 3 (0.4) | |
| Household size | < 4 | 47 (53.4) | 307 (48.3) | 354 (48.9) |
| = 4 | 13 (14.8) | 101 (15.9) | 114 (15.7) | |
| > 4 | 28 (31.8) | 226 (35.5) | 254 (35.1) | |
|
|
|
| ||
| Hypertension | Diabetes | |||
|---|---|---|---|---|
| aOR (95%CI) |
| aOR (95%CI) |
| |
| Awareness | 1.666 (1.247–2.224) | < 0.001 | 2.595 (1.381–4.877) | 0.003 |
| Treatment | 1.795 (1.341–2.404) | < 0.001 | 1.970 (1.223–3.174) | 0.005 |
| Control | 1.443 (1.052–1.980) | 0.02 | 0.550 (0.346–0.874) | 0.01 |
| Progression from being hypertensive or diabetic and not aware in 2013 to being aware in 2018 | ||||
|---|---|---|---|---|
| Hypertension awareness | Diabetes awareness | |||
| aOR (95%CI) |
| aOR (95%CI) |
| |
|
| ||||
| Without healthcare cost coverage ( | ||||
| With healthcare cost coverage | 1.068 (0.690–1.652) | 0.77 | 0.614 (0.187–2.018) | 0.42 |
|
| 1.017 (1.004–1.030) | 0.01 | 1.020 (0.987–1.054) | 0.24 |
|
| ||||
| Female ( | ||||
| Male | 0.792 (0.573–1.097 | 0.16 | 0.863 (0.417–1.787) | 0.69 |
|
| ||||
| Malay ( | ||||
| Chinese | 0.863 (0.622–1.197) | 0.38 | 1.642 (0.710–3.796) | 0.25 |
| Indian | 0.819 (0.530–1.267) | 0.37 | 2.554 (1.104–5.9.6) | 0.03 |
| Others | 1.363 (0.458–4.173) | 0.57 | 0.752 (0.053–10.775) | 0.83 |
|
| ||||
| Married ( | ||||
| Never married, divorced or widow(er) | 0.904 (0.636–1.284) | 0.57 | 1.143 (0.517–2.524) | 0.74 |
|
| ||||
| Below Tertiary education ( | ||||
| Tertiary education | 0.568 (0.312–1.034) | 0.06 | 0.230 (0.056–0.949) | 0.04 |
|
| ||||
| Not employed ( | ||||
| Employed | 0.847 (0.613–1.170) | 0.31 | 0.614 (0.187–2.018) | 0.42 |
- —The authors received no specific funding for this work.
Peer Reviews
No public reviews on file for this paper yet. If you reviewed it on a platform where reviews are public (OpenReview, ICLR, NeurIPS, ICML), you can paste yours below so the community can read it here.
Videos
No videos yet. Explain this paper in a talk, walkthrough, or lecture? Add one.
Taxonomy
TopicsHealth Systems, Economic Evaluations, Quality of Life · Healthcare Systems and Reforms · Healthcare Policy and Management
Introduction
1
Non‐communicable diseases (NCDs) are known to be the leading cause of mortality globally [1]. They were previously viewed as a burden only in the high‐income countries but are now of concern in the low‐ and middle‐income countries (LMICs) [2]. Southeast Asia is said to have the highest increase in deaths due to NCDs [3]. NCDs account for 62% of all deaths in Southeast Asia, of which 50% of recorded deaths occur in people below the age of 70 [4]. NCDs are cardiovascular disease, diabetes, cancer and chronic obstructive pulmonary disorder [1, 5, 6, 7]. Diabetes is one of the leading causes of death in Malaysia [8]. About 15.6% and 29.2% of the Malaysian adult population live with diabetes and hypertension, respectively [8].
The management of hypertension and diabetes usually includes awareness (medically diagnosed), treatment initiation and control [9, 10, 11, 12]. The proper management of hypertension and diabetes can prevent or delay the onset of NCD‐related complications and mortality [13, 14]. Although, healthcare costs coupled with limited access to healthcare facilities pose substantial barriers to treatment‐seeking and management of NCDs for many families in the LMIC [2, 15]. However, healthcare cost coverage (HCC) is seen as a proxy for access to healthcare facilities, improving treatment seeking, healthcare utilization and health outcomes [16, 17, 18, 19, 20, 21]. Hence, HCC is expected to enhance the management of common NCDs such as hypertension and diabetes.
While HCC is an essential measure to improve the management of NCDs in LMICs, there remains a gap in the evidence of the role of HCC in each hypertension and diabetic care step. Many studies on NCD management are cross‐sectional and are unable to capture important elements in the care process, such as an individual's progression or backward movement on the care cascade [22]. For example, an individual might be diagnosed and aware of his status but fail to progress to the treatment care stage or discontinue treatment after treatment initiation. The treatment and control care stages are reversible, not permanent care steps [22]. An individual's circumstances might change due to some sociodemographic factors, which can influence their movement on the care step.
This study determined the distribution (in proportion) of adults with hypertension and diabetes who reported (i) having been previously diagnosed with hypertension and diabetes (aware), (ii) being treated for hypertension and diabetes, and (iii) having achieved blood pressure or blood glucose control. The association between HCC and each care step at baseline was determined. Furthermore, the probability of progression from (i) being hypertensive or diabetic and not aware to being aware, (ii) being aware to being treated or (iii) being treated to achieving control was also determined based on sociodemographic characteristics. The study also tracked the backward movement for two care steps (treatment and control) over 5 years. The backward movements occur, for example, when an individual moves from being treated to not treated or from achieving blood pressure or blood glucose control to having uncontrolled blood pressure or blood glucose levels. This is to understand which individuals by HCC status are likely to be lost and at what stage they are lost in the hypertension and diabetes management process. The evidence from this study will inform which stage of the care process needs restructuring and intervention. It will also guide policymakers on the necessary guidelines to be incorporated into the various HCC schemes to aid the effective management of hypertension and diabetes.
Methods
2
Data Source
2.1
The data is part of community health surveys in 2013 and 2018 by the South‐East Asia Community Observatory (SEACO) in Segamat, Johor, Malaysia. SEACO is a certified health and demographic surveillance system. Details of SEACO have been published previously [23].
Data Used and Study Design
2.2
This is a 5‐year longitudinal study. The data used for this analysis includes demographic data, data on HCC, blood pressure and blood glucose measurement. The data also contain information on hypertension and diabetes awareness, treatment and control.
Ethical Consideration
2.3
Participants provided written informed consent, and the study was approved by the Human Research Ethics Committee of the authors’ institute: (3837) for the Health Survey 2013 and (13242) for the Health Survey 2018.
Inclusion and Exclusion Criteria
2.4
Participants were pulled from the 2013 and 2018 health rounds. Eligible participants were aged 35 and older, as SEACO only collects data on hypertension and diabetes for this age group. Those who were lost to follow‐up in 2018 were excluded from the study. Those who changed their HCC status from having HCC to not having HCC and vice versa were also excluded. Eligible participants met the criteria for being hypertensive or diabetic. The inclusion and exclusion flow chart is in Figure 1.
Flow chart of the study.
Demographic Variables
2.5
The demographic variables studied across the data set include age, gender, ethnicity, marital status, educational level, employment status, household income, and household size.
Independent Variable
2.6
For participants to be considered having HCC, they must have reported having any healthcare coverage plans such as government or pensioner insurance, employer‐provided insurance, private or personal health insurance, or employer or panel clinic coverage for healthcare costs. Those who make out‐of‐pocket payments by themselves, family or household members were considered not to have HCC.
Outcome Variables
2.7
The outcome variables are (i) being hypertensive or diabetic, (ii) hypertension and diabetes awareness, (iii) hypertension and diabetes treatment and (iii) hypertension and diabetes control. The cutoffs and definitions of the outcome variables are detailed in Appendix A.
Data Analysis
2.8
IBM SPSS Statistics, software version 27 and Microsoft Excel were used for data entry and analysis. Descriptive analyses were done to investigate the distribution (in proportion) of participants who achieved each care step. The difference in proportion was tested with a chi‐square test. The associations between HCC and each care step at baseline were determined using logistic regression. The probability of progressing each care step based on sociodemographic characteristics was also determined with a logistic regression. The regression models were adjusted for demographic variables. The group without HCC was the reference for coverage status. The backward movements of two care steps (treatment and control) were investigated with McNemar's tests and presented with a Sankey diagram created using SankeyMATIC. All results were disintegrated by HCC status. The adjusted odds Ratio (aOR) and 95% confidence interval (Cl) were used to report the size of the association. A p‐value < 0.05 was considered statistically significant. All statistical analyses were two‐sided.
Results
3
The baseline demographic characteristics of participants are shown in Tables 1 and 2.
Distribution of Individuals Across the Hypertension and Diabetes Care Steps in 2013 and 2018
3.1
Compared with those without HCC, those with HCC had significantly higher proportions of participants who are aware of their hypertension status (2013: 60.1% (140/233) vs. 45.5%, (796/1749) p < 0.001 | 2018: 77.7% (181/233) versus 68.2% (1192/1749), p = 0.003), being treated (2013: 42.9% (100/233) vs. 27.9% (489/1749), p = 0.03 | 2018: 36.9% (86/233) versus 21.8% (382/1749), p < 0.001) and who had achieved blood pressure control (2013: 21.9% (51/233) vs. 14.2% (248/1749), p = 0.003 | 2018: 20.6% (48/233) versus 12.2% (214/1749), p < 0.001) in both 2013 and 2018 (Figure 2). Similarly, those with HCC, compared with those without HCC, had significantly higher proportions of participants who were aware of their diabetes status (85.2% (75/88) vs. 68.4% (435/636), p < 0.001) and were being treated (61.4% (54/88) vs. 44.0% (280/636), p = 0.003) in 2013 (Figure 2). Participants with HCC had a higher proportion of participants who achieved all hypertension care steps but not all diabetic care steps.
*Distribution of hypertension and diabetes awareness, treatment and control among participants by healthcare cost coverage status in 2013 and 2018. ɪ 95% CI, Significant difference ***p < 0.001, **p < 0.01, p < 0.05.
The Association Between Healthcare Cost Coverage and Hypertension and Diabetic Care Steps at Baseline
3.2
Those with HCC had higher odds of achieving all care steps at baseline, except for blood glucose control (hypertension awareness: aOR = 1.666 (95% CI: 1.247–2.224) p < 0.001 | hypertension treatment: aOR = 1.795 (95% CI: 1.341–2.404) p < 0.001 | hypertension control: aOR = 1.443 (95% CI: 1.052–1.980) p = 0.02 | diabetes awareness: aOR = 2.595 (95% CI: 1.381–4.877) p = 0.003 | diabetes treatment: aOR = 1.970 (95% CI: 1.223–3.174) p = 0.005 | diabetes control: aOR = 0.550 (95% CI: 0.346–0.874) p = 0.01) (Table 3).
The Probability of Progression Based on Sociodemographic Characteristics
3.3
The proportion of participants that progressed the hypertension and diabetes care steps by healthcare cost coverage status are presented in the Supporting Information. HCC was not associated with all care step progressions except for the progression from being treated for diabetes without control in 2013 to having control in 2018 (aOR = 0.350 (95% CI: 0.124–0.987) p = 0.05) (Table 4). Surprisingly, this result shows that those with HCC are less likely to progress from being treated for diabetes without achieving blood glucose control to achieving blood glucose control. Hence, there was no evidence that HCC contributed positively to any care step progression.
Although HCC did not affect most care step progression, sociodemographic variables that contributed to care step progression include age, ethnicity and education (Table 4). Being Indian ethnicity contributed to the three diabetes care step progression (from being diabetic and not aware to being aware (aOR = 2.554 (95% CI: 1.104–5.9.6) p = 0.03), from being aware and not treated to being treated (aOR = 2.237 (95% CI: 1.059–4.727) p = 0.04), from being treated without control to having blood glucose control (aOR = 3.085 (95% CI: 1.252–7.601) p = 0.01).
Hypertension and Diabetes Care Step Backward Movement
3.4
Although, those with and without HCC had a significant backward movement from being treated for hypertension to not being treated. However, those with HCC had a lower proportion of backward movement compared with those without HCC (54.0% (54/100), p < 0.001 vs. 71% (346/487), p < 0.001). In addition, those without HCC had a significant backward movement for blood pressure control (30.6% (76/248), p = 0.04) and diabetes treatment (54.3% (152/280), p < 0.001), while those with HCC had no significant backward movement blood pressure control and diabetes treatment. HCC supports backwards movement reduction for most care steps (Figures 3 and 4).
*Care step backward movement in hypertension management by healthcare cost coverage status. Significantly backward movement, p < 0.001. ^Significantly backward movement, p = 0.04.
*Care step backward movement in diabetes management by healthcare cost coverage status. Significantly backward movement, p < 0.001.
Discussion
4
Main Finding of This Study
4.1
Participants with HCC had a higher proportion of participants who achieved all hypertension care steps but not all diabetic care steps at baseline. HCC was positively associated with all hypertension care steps at baseline but not all diabetic care steps. However, there was no evidence that having HCC contributed positively to any care step progression after 5 years. Ethnicity was associated with all diabetic care steps progressions. Those without HCC had a significant backward movement for diabetes treatment and blood pressure control, unlike those with HCC.
The proportion of participants with hypertension awareness was higher for those with HCC in 2013 and 2018 at 60.1% (140/233) and 77.7% (181/233), respectively, compared with those without HCC (45.5% (796/1749) and 68.2% (1192/1749) respectively). This agrees with a similar study among hypertensive participants in the United States; 82% of participants with private insurance had their blood pressure checked within 6 months, compared with 58% of the uninsured participants [24].
Likewise, more participants with HCC achieved hypertension control (2013: 21.9% (51/233) and 2018: 20.6% (48/233)) compared with those without HCC (2013: 14.2% [248/1749] and 2018: 12.2% [214/1749]). Although the proportion of participants with HCC that achieved hypertension control was only about 20% in this study, this proportion was nonetheless higher than the proportion reported in a study done in the United States, where only about 10% of the adult population with health insurance and usual health care source had blood pressure control (i.e., there were 90% with uncontrolled hypertension) [25].
Notably, the proportion of participants who achieved blood pressure and blood glucose control was generally low in this study, irrespective of the HCC status, ranging from 13% to 24%. This is not too far from the meta‐analysis of studies conducted in rural India, which stated hypertension control of 10.7% [26]. A similar study across Bangladesh, India, Indonesia, Malaysia, Viet Nam also reported that hypertension control was low across all study sites, ranging from 11.5% (189/1641; 95% CI: 10.0–13.0) to 20.4% (43/211; 95% CI: 14.9–25.8) [12]. However, this differs from an observation from a similar rural setting in South Africa, where nonphysician healthcare workers recorded 68% and 82% of blood pressure and blood glucose control, respectively [27].
Those with HCC had higher odds of being aware of their status at baseline (hypertension: aOR = 1.666 (95% CI: 1.247–2.224) p < 0.001, | diabetes: aOR = 2.595 (95% CI: 1.381–4.877) p = 0.003. This is related to a study among American adults, where PHI coverage was associated with decreased odds (0.82 (95% CI: 0.67–0.99) for unknown diabetes [28]. HCC is expected to improve hypertension and diabetes awareness. However, the effect of HCC on hypertension and diabetes awareness might be diverse. On the first note, the impact of HCC on hypertension and diabetes awareness largely depends on the HCC scheme offered to enrollees. e.g., PHI plans in Malaysia usually cover inpatient care but not outpatient care [29], similar to what is obtainable in India. This means that health insurance had a limited impact on hypertension screening [30]. Secondly, periodic interventions by government and nongovernment organisations might increase the awareness of NCD risk factors in general, like the implementation of the Komuniti Sihat Perkasa Negara (KOSPEN), the Healthy Communities, Building the Nation” program in Malaysia. Due to the high prevalence of hypertension and diabetes, the Ministry of Health implemented KOSPEN, a community‐based program, in 2013. This targeted NCD risk factors screening, patient‐centred care and referral, among others [4]. With the successful implementation of the programme, hypertension and diabetes awareness is expected to increase over the years, irrespective of HCC status.
HCC was positively associated with hypertension and diabetes treatment, similar to the reports in previous studies. Health insurance was reported to increase the likelihood of being on treatment for hypertension by 28.7% [31] and was positively associated with receiving diabetic treatment [19]. Uninsured and underinsured participants with hypertension were reported to be less likely to receive hypertension treatment compared to those with suitable health insurance [32]. This is expected as HCC is known to increase healthcare utilisation [16, 18].
Overall, this study showed that HCC is beneficial for hypertension control, similar to other studies [24, 33, 34, 35, 36, 37]. Duru et al. in their study, reported lower odds of blood pressure control among their study participants without health insurance (aOR: 0.63 (95% CI: 0.44–0.92) [24]. Another study by Oso et al. also reported a 2.2‐fold increased odds of achieving blood pressure control among patients with health insurance compared to those without health insurance [37].
HCC was negatively associated with the blood glucose control (aOR = 0.550 (95% CI: 0.346–0.874) p = 0.01). Although achieving blood glucose control has been positively related to having health insurance in previous studies [19, 38, 39, 40]. In Mexico, enrolment in Seguro Popular, a public health insurance plan known as People's Insurance, improved blood glucose control among diabetes patients, precisely poor adults [39]. However, one study reported that health insurance was not associated with blood glucose control among diabetic patients [41].
Current studies have shown that the rate of increase in hypertension and diabetic awareness, treatment and control in LMICs is generally lower compared with high‐income countries. Hypertension and diabetic diagnosis are convenient and should be prioritised in LMICs [10]. This could be achieved through different HCC schemes, as HCC was associated with better hypertension and diabetic care processes in most cases [42, 43, 44, 45, 46].
HCC was not related to the probability of progressing most care steps after 5 years. This suggests that HCC does not have efficient policies that facilitate hypertension and diabetic care step progression. However, ethnicity was associated with all diabetic care step progression. With regard to those of Malays ethnicity, those of Indian ethnicity are more likely to process the diabetes care steps. Policymakers should focus interventions on the ethnic groups most likely to be left out of diabetic care.
Those without HCC had more significant backward movement. Those without HCC might encounter financial barriers in initiating or continuing treatment to maintain blood pressure and glucose control. Unlike those without HCC, those with HCC might be propelled to continue treatment as long as the HCC plan that covers their treatment is still active. The health insurance industry should be explored as a means of retention in hypertension and diabetes care.
What Is Already Known on This Topic
4.2
No literature evidence has captured how HCC influence an individual's forward or backward movement in hypertension and diabetes care steps. Most studies have examined the association between HCC and hypertension and diabetes care steps. HCC was positively associated with better hypertension and diabetic care processes in most cases [42, 43, 44, 45, 46].
What This Study Adds
4.3
The evidence from this study suggested that HCC supported reductions in backward movement for some care steps, but it did not contribute to care step progression.
Limitation and Strength of This Study
4.4
This is the first study that assessed the effect of HCC on hypertension and diabetes care step backwards and forward movement. This study was done at a health and demographic surveillance system that only surveyed a geographically defined population. Hence, the result might not be a representation of the entire population.
Conclusion
5
HCC is beneficial for hypertension awareness, treatment and control. However, the effect of HCC on diabetic care is limited. HCC supports reduction in backward movement for most care steps, but it did not contribute to care step progression. HCC stakeholders and policymakers should ensure that HCC schemes have policies that facilitate care step progression. Hypertension and diabetes care step progressions are important to attaining long‐term hypertension and diabetes control in the LMIC.
Author Contributions
Adeola Folayan: conceptualization, investigation, methodology, writing – original draft, validation, visualization, writing – review and editing, formal analysis. Quek Kia Fatt: methodology, validation, investigation, visualization, writing – review and editing, supervision. Mark Cheong Wing Loong: supervision, methodology, validation, visualization, writing – review and editing, investigation. Tin Tin Su: supervision, methodology, validation, visualization, writing – review and editing, conceptualization, investigation.
Consent
The authors have nothing to report.
Conflicts of Interest
The authors declare no conflicts of interest.
Transparency Statement
The lead author Adeola Folayan affirms that this manuscript is an honest, accurate, and transparent account of the study being reported; that no important aspects of the study have been omitted; and that any discrepancies from the study as planned (and, if relevant, registered) have been explained.
Supporting information
SuppMat.
The reference list from the paper itself. Each links out to its DOI / PubMed record.
- 1L. N. Allen , J. Pullar , K. K. Wickramasinghe , et al., “Evaluation of Research on Interventions Aligned to WHO ‘Best Buys’ for NC Ds in Low‐Income and Lower‐Middle‐Income Countries: A Systematic Review From 1990 to 2015,” BMJ Global Health 3, no. 1 (2018): e 000535.10.1136/bmjgh-2017-000535 PMC 584152329527342 · doi ↗ · pubmed ↗
- 2H. T. Kankeu , P. Saksena , K. Xu , and D. B. Evans , “The Financial Burden From Non‐Communicable Diseases in Low‐and Middle‐Income Countries: A Literature Review,” Health Research Policy and Systems 11, no. 1 (2013): 31.23947294 10.1186/1478-4505-11-31PMC 3751656 · doi ↗ · pubmed ↗
- 3F. B. Rasul , O. Kalmus , M. Sarker , et al., “Determinants of Health Seeking Behavior for Chronic Non‐Communicable Diseases and Related Out‐of‐Pocket Expenditure: Results From a Cross‐Sectional Survey in Northern Bangladesh,” Journal of Health, Population, and Nutrition 38, no. 1 (2019): 48.31870436 10.1186/s 41043-019-0195-z PMC 6929492 · doi ↗ · pubmed ↗
- 4N. T. Castillo‐Carandang , R. D. Buenaventura , Y.‐C. Chia , et al., “Moving Towards Optimized Noncommunicable Disease Management In the ASEAN Region: Recommendations From a Review and Multidisciplinary Expert Panel,” Risk Management and Healthcare Policy 15 (2020): 803–819.10.2147/RMHP.S 256165 PMC 737156132765135 · doi ↗ · pubmed ↗
- 5D. Beran , H. B. Pedersen , and J. Robertson , “Noncommunicable Diseases, Access to Essential Medicines and Universal Health Coverage,” Global Health Action 12, no. 1 (2019): 1670014.31573421 10.1080/16549716.2019.1670014 PMC 6781244 · doi ↗ · pubmed ↗
- 6M. Roy , A. T. Protity , S. Das , et al., “Prevalence and Major Risk Factors of Non‐Communicable Diseases: A Machine Learning Based Cross‐Sectional Study,” EUREKA: Health Sciences no. 3 (2023): 28–45.
- 7S. Rashid , H. Mahmood , A. Asma Iftikhar , et al., “Availability and Readiness of Primary Healthcare Facilities for the Management of Non‐Communicable Diseases in Different Districts of Punjab, Pakistan,” Frontiers in Public Health 11 (2023): 1037946.36969638 10.3389/fpubh.2023.1037946 PMC 10036340 · doi ↗ · pubmed ↗
- 8Institute for Public Health ., NHMS Report 2024 Volume I—NON‐COMMUNICABLE DISEASES & OTHER HEALTH PROBLEMS In: National Health and Morbidity Survey 2024 (NHMS 2024). 2024, Available from: https://iku.nih.gov.my/images/nhms 2023/key‐findings‐nhms‐2023.pdf, accessed 08 Mar 2025.