Growing Season Lengthens in a North American Deciduous Woody Community From 1993 to 2021
Carol K. Augspurger, David N. Zaya

TL;DR
Over 29 years, the growing season in a North American forest has lengthened due to climate change, with spring events happening earlier and autumn events later.
Contribution
The study provides long-term evidence of climate-driven changes in phenology and their ecological implications in a deciduous woody community.
Findings
The growing season lengthened by an average of 4.7 days per decade for 88% of species.
Warmer spring temperatures and higher autumn minimum temperatures were key drivers of phenological changes.
Canopy trees showed greater autumn delays, while other woody species advanced in spring.
Abstract
Observations of both spring and autumn phenological events were made annually over 29 years (1993–2021) for 22 taxa of multiple growth forms in a mature deciduous forest remnant near Urbana, Illinois, USA. Temporal trends in event dates, trends in stage durations, and associations with weather variables were analyzed with linear mixed‐effect models. Species were grouped together in analyses based on seasonality.Spring event dates for most species advanced from 1.2 to 3.0 days/decade, while durations of spring stages shortened from 0.3 to 0.6 days/decade.Autumn event dates for most species delayed from 1.2 to 3.3 days/decade, while durations of autumn stages lengthened from 0.8 to 3.8 days/decade.Overall, the duration of the growing season lengthened for 88% of species (mean of 4.7 days/decade), with greater delays in autumn phenology for canopy trees and greater advances in spring…
Genes, proteins, chemicals, diseases, species, mutations and cell lines named across the full text — each resolved to its canonical identifier and authoritative record.
Click any figure to enlarge with its caption.
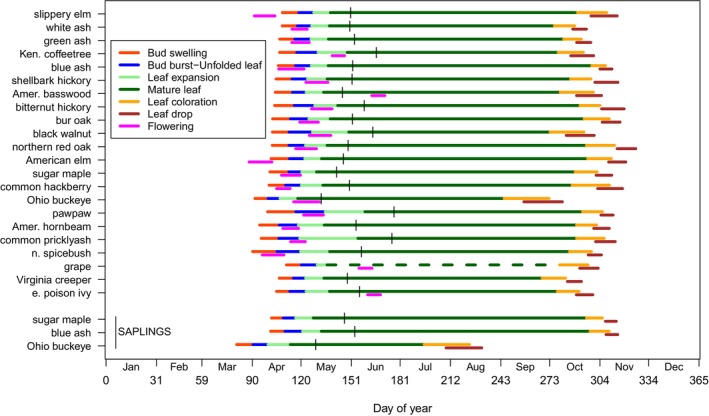 FIGURE 1
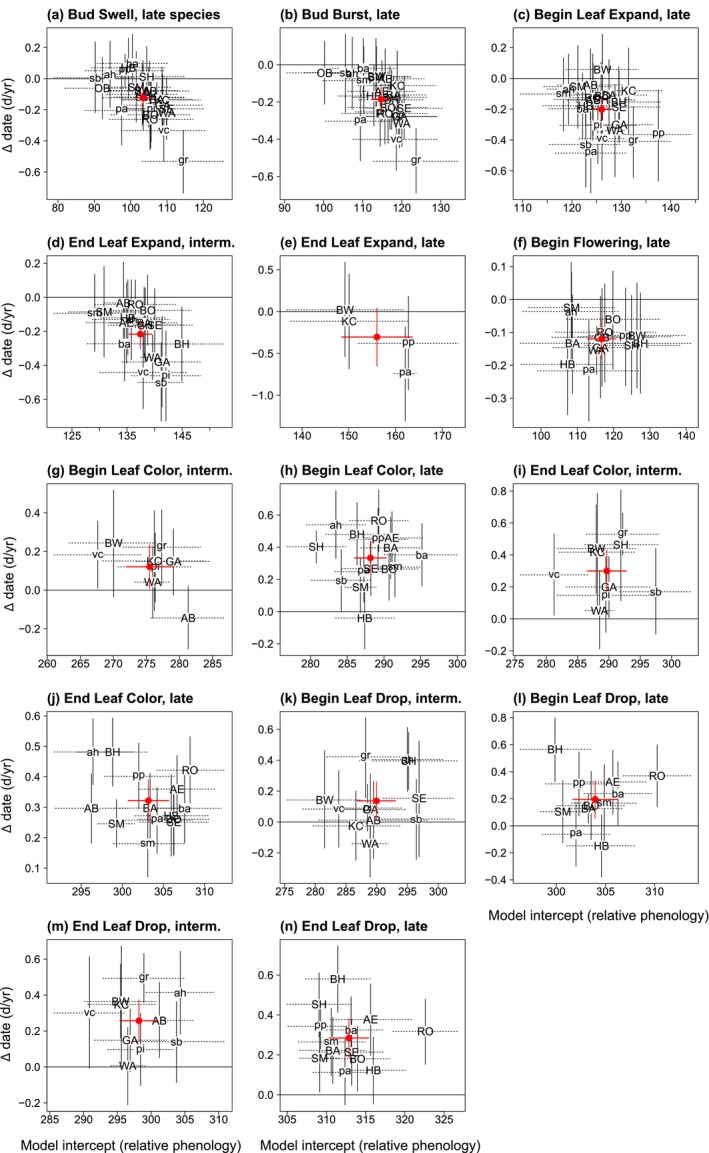 FIGURE 2
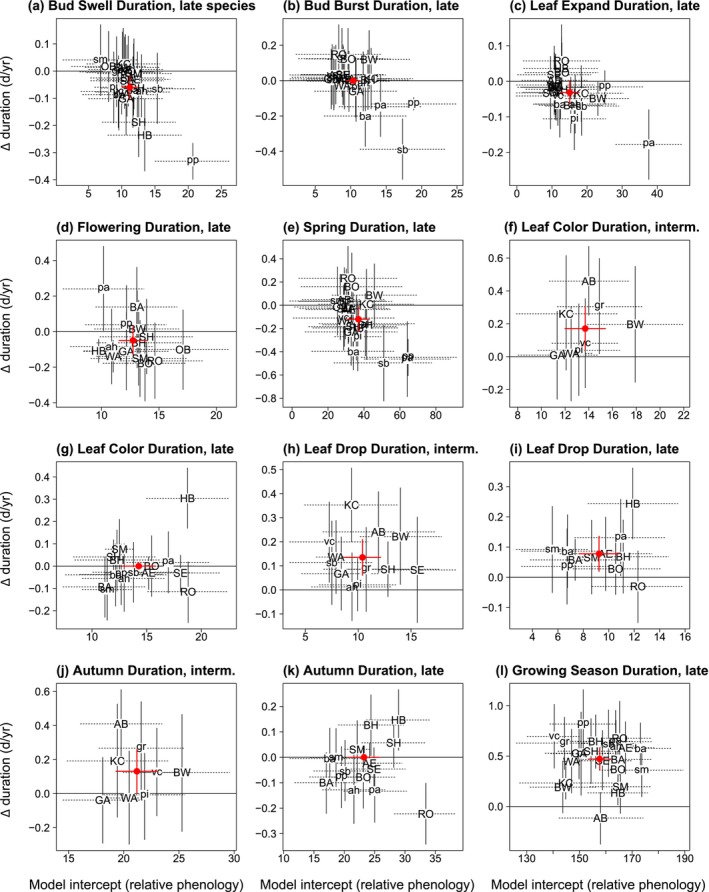 FIGURE 3
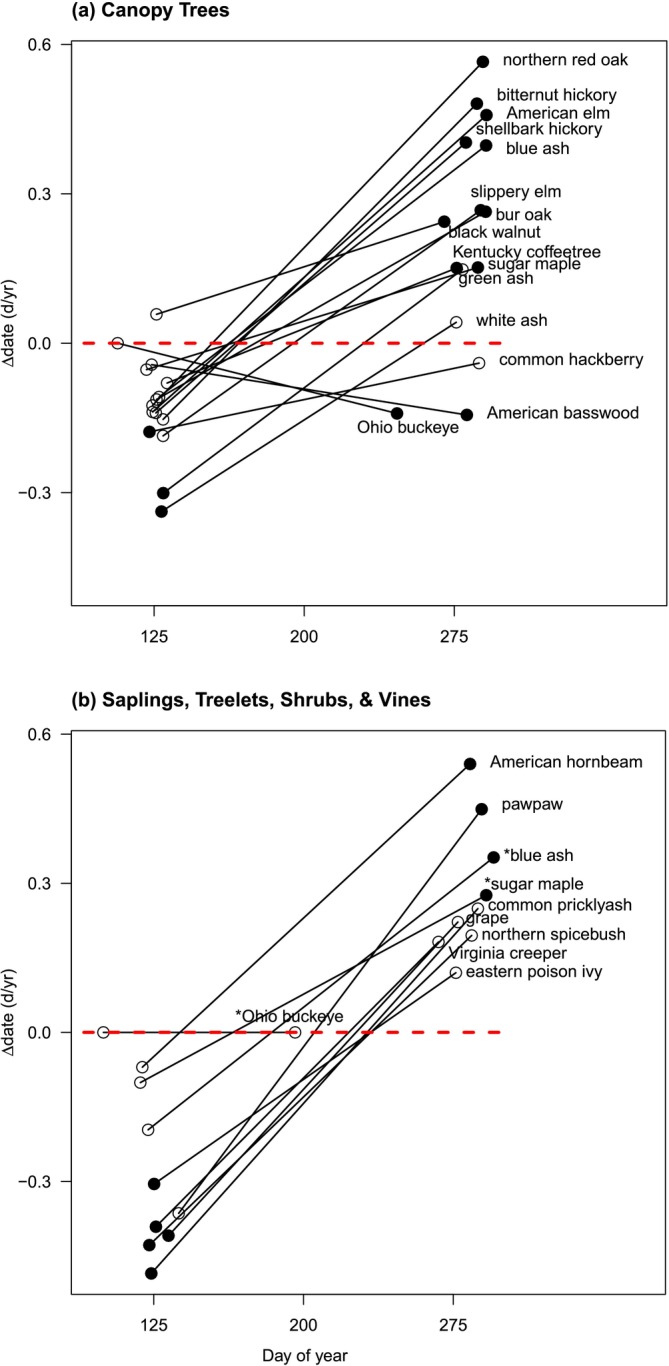 FIGURE 4
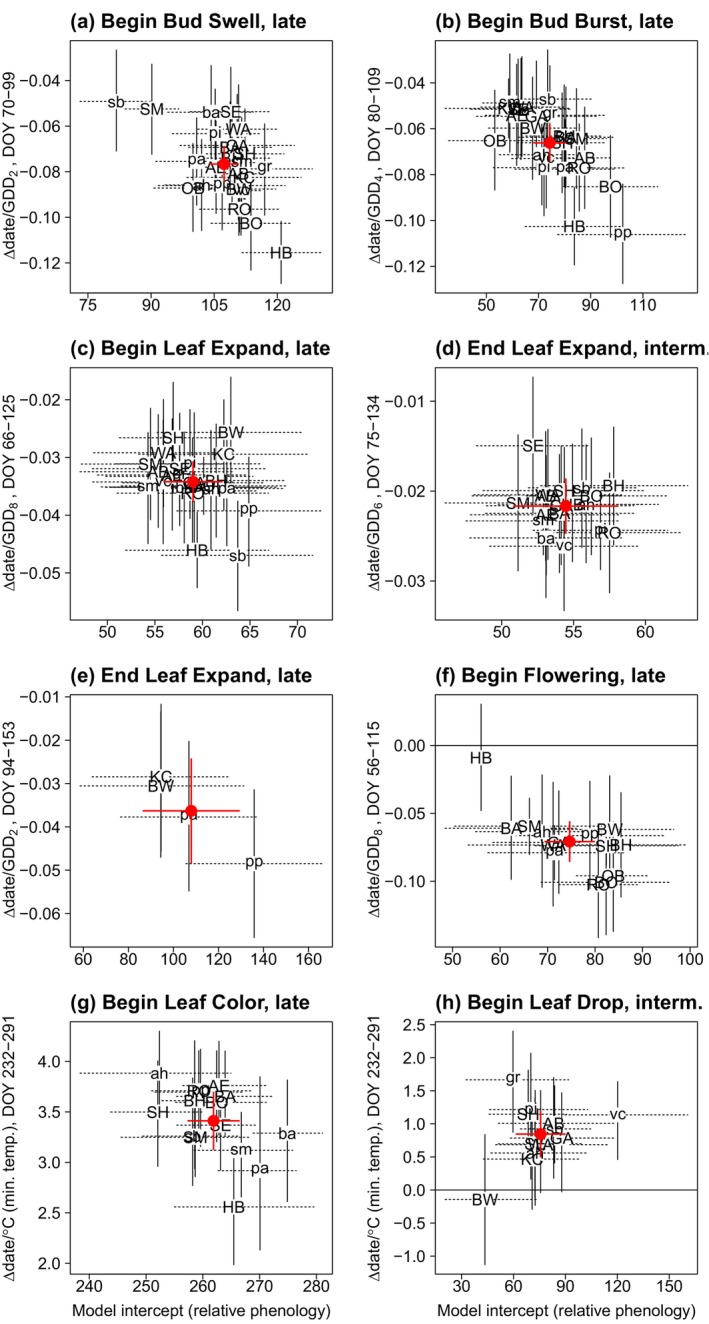 FIGURE 5
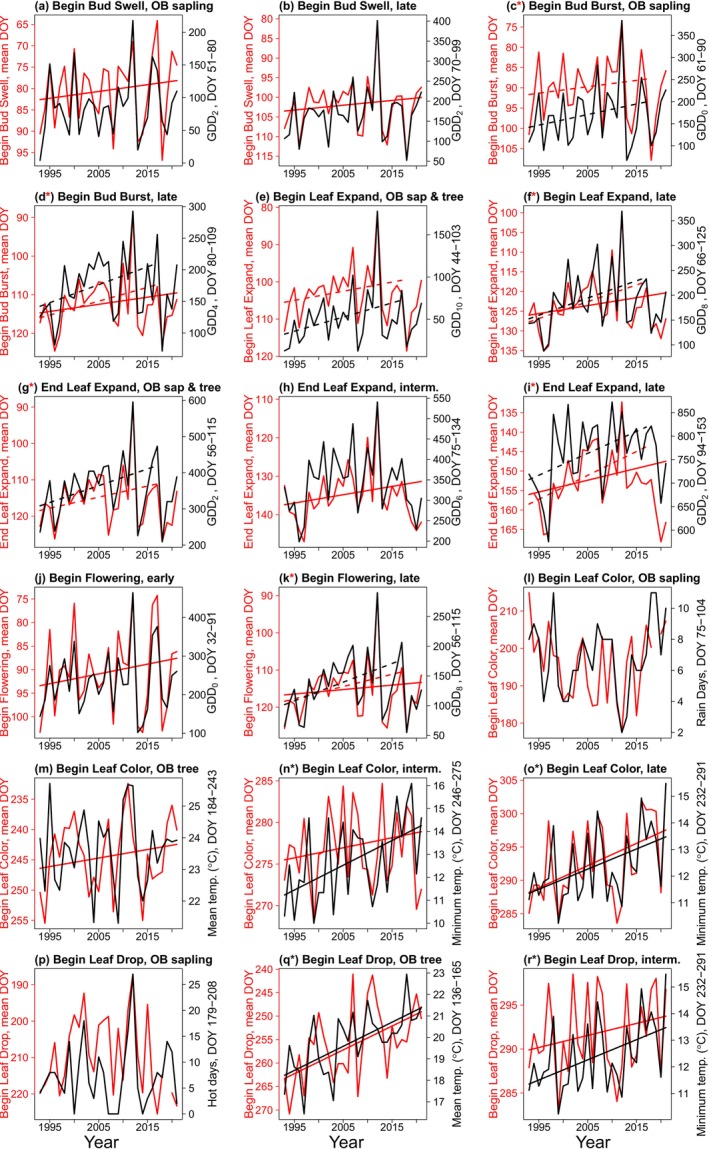 FIGURE 6
| Principal growth stage | Event code | BBCH code | Description of event |
|---|---|---|---|
| Bud swell | BS1 | 01 | Bud 1/3 of final size |
| BS2 | 02 | Bud 2/3 of final size | |
| BS3 | 03 | End of bud swelling; Bud fully swollen | |
| Bud burst | BB1 | 07 | Bud burst |
| BB2 | 09 | First green leaf tips visible | |
| BB3 | 10 | Leaf/shoot emergence well beyond bud scales, but leaves not yet unfolding and entire petiole not visible | |
| Leaf expansion | LE1 | 11 | Individual leaf blade and petiole visible; leaf unfolded but not expanded; up to 33% of final size |
| LE2 | 17 | Leaf 67% of final size | |
| LE3 | 19 | Leaf final size | |
| Flowering | FLB | 63 | Begin Flower; 30% of flowers at full size and appear functional |
| FLE | 67 | End Flower; 1 week after 70% of flowers appear non‐functional | |
| Leaf senescence (Leaf coloration) | LC1 | 92 | Leaves converted 33% of green to senescent color |
| LC2 | 92 | Leaves converted 67% of green to senescent color | |
| LC3 | 93 | Leaf 100% senescent color | |
| Leaf drop | LD1 | 93 | 33% of leaves fallen |
| LD2 | 96 | 67% of leaves fallen | |
| LD3 | 97 | 100% leaves fallen |
Peer Reviews
No public reviews on file for this paper yet. If you reviewed it on a platform where reviews are public (OpenReview, ICLR, NeurIPS, ICML), you can paste yours below so the community can read it here.
Videos
No videos yet. Explain this paper in a talk, walkthrough, or lecture? Add one.
Taxonomy
TopicsSpecies Distribution and Climate Change · Remote Sensing in Agriculture · Plant Water Relations and Carbon Dynamics
Introduction
1
Phenological patterns of woody plant species, including bud burst and leaf expansion in spring and leaf coloration and leaf drop in autumn, have been changing in seasonal temperate deciduous forests (Menzel 2000; Ge et al. 2015). Many studies show that rising spring temperatures predict advances in the timing of spring events (Menzel et al. 2006; Piao et al. 2019), with some exceptions and complications (Roberts et al. 2015). Fewer studies of autumn events show a delay in timing with warmer autumn temperatures (Gill et al. 2015; Gallinat et al. 2015). These altered leaf stages result in longer growing seasons (Jeong et al. 2011), and may impact ecological processes, including community assembly and species niches (Ponti and Sannolo 2023), community interactions within and between trophic levels (Nakazawa and Doi 2011; Renner and Zohner 2018; Belitz et al. 2025), species' ranges (Morin et al. 2007), and invasions (Polgar et al. 2014). Additionally, a longer growing season potentially brings longer periods of photosynthesis and carbon uptake and storage by canopy trees (Keenan et al. 2014), although the results are mixed as to whether this potential is realized (Dunn et al. 2007; Piao et al. 2008; Wu et al. 2013).
A longer growing season by canopy trees may increase the period of shade experienced by understory species and saplings dependent on high light before canopy closure and/or after canopy opening (Renner and Zohner 2018; Augspurger and Salk 2024). However, the focus of phenological studies of woody species has been on canopy trees, and not the growth forms of saplings, vines, treelets, and shrubs (but see Ge et al. 2015).
The amount of autumn delay, and, by extension, the amount of lengthening of the growing season, can be constrained by increases in spring and summer productivity (Zani et al. 2020). Additionally, Zohner et al. (2023) report that warm and cold years differ in their effect on autumn phenology. In cold years, slow spring development results in a late beginning and rapid movement toward an early ending of senescence; conversely, in warm years, rapid spring development causes early beginning and slow movement to a later ending of senescence.
Europe (Wang et al. 2016; Wesołowski and Rowiński 2006) and parts of Asia (Ge et al. 2015) have long‐term observational studies of the phenology of their deciduous forests for a large number of species, years, and countries. Long‐term North America studies were focused historically on northeastern USA (Harvard Forest: O'Keefe 2024; Hubbard Brook Ecosystem Study 2022) and midwestern USA (Morin et al. 2009; Yu et al. 2016; Donnelly et al. 2017). The USA National Phenology Network is increasingly being used as its data set becomes longer and more widespread (Crimmins et al. 2022). In North America, it remains unclear how climate change in recent decades is affecting the growing season of mature deciduous forests and whether any changes are associated with spring or autumn phenology.
Temperature and precipitation are key factors that predict phenology of deciduous trees. In spring, accumulating warmth from rising temperatures forces leaf development (Polgar and Primack 2011). Some species also have a chilling requirement and/or a critical photoperiod before buds can respond to spring warmth (Zohner 2016; Wang et al. 2020). Chilling accumulation is a primary predictor of the beginning of autumn senescence (Dufrene et al. 2005). Additionally, photoperiod can determine the onset date of chilling accumulation (Liu et al. 2024). Increasing autumn temperatures and summer drought may delay leaf coloration, but heat stress or heavy precipitation predict an advance in coloration, while heat stress or heavy precipitation predict an advance in coloration (Archetti et al. 2013; Xie et al. 2015, 2018).
Understanding what predicts leaf coloration is particularly important because it marks the period when carbon uptake is diminishing or has stopped (Wilson et al. 2000). Leaf coloration and drop may not be controlled by the same factors (Gill et al. 2015). Most studies of autumn predict leaf coloration, but understanding predictors of leaf drop phenology is also important as it determines the light received by understory species in autumn (Augspurger and Salk 2024). More phenological studies that encompass both spring and autumn phenology in warm and cold years, coupled with measures of net primary productivity, are necessary to determine their relative effects on carbon sequestration during climate change.
Earlier phenological events (or weather) may affect later events. These “legacy events” of phenology (or weather itself) from previous months or even previous years can be important predictors of later events (Keenan and Richardson 2015; Ettinger et al. 2018; Blonder et al. 2023; Prather et al. 2023). Warmer autumns may delay dormancy and slow advances in spring (Beil et al. 2021). The timing of bud dormancy in autumn can predict timing of spring leaf out (Malyshev et al. 2024).
Species have different thermal sensitivities to specific weather variables (Estrella and Menzel 2006; Vitasse et al. 2009). These differences have implications for species interactions, perhaps influencing relative abundances within the community. The specific requirements and phenological responses of most species are unknown and studies yield inconsistent results (Gill et al. 2015). Existing studies are largely of European tree species, including some species that occur in North America, but usually are not done in the context of one community (Laube et al. 2014; Zohner et al. 2016; Flynn and Wolkovich 2018).
Studies using satellite (Jeong et al. 2011), experiment (Fu et al. 2018), and observation (Fu et al. 2015) over recent decades (~1980–2010), despite regional and decadal differences (Jeong et al. 2011), have generally found a lengthening of the growing season that is due more to autumn delays than spring advances (Fu et al. 2015, 2018). However, non‐linearities in the amount of change due to temperature and precipitation variability have been found in long‐term, multi‐decadal studies (Fu et al. 2015; Jochner et al. 2016). Differences in the rates of winter and spring warming (Fu et al. 2015) and greater inter‐annual variation in weather may obscure long‐term patterns (Liu and Zhang 2020).
To deepen our understanding of the long‐term association of phenological responses with climate change, we collected long‐term, contemporary field phenological observations for a community of woody species in both spring and autumn in an intact mature forest in the Midwest, USA. Our focus is on community‐level trends, rather than species‐specific responses. The goals of the study were (1) to quantify leaf and flower phenological changes in spring, autumn, and the growing season duration of a community with 22 woody species of canopy trees, subcanopy trees, shrubs, vines, and tree saplings from 1993 to 2021, (2) to determine whether the length of the growing season is changing, and whether shifts in spring or autumn phenology are more responsible, and (3) to identify temperature and precipitation predictors of spring and autumn phenological events, and to determine long‐term trends in those predictors.
Materials and Methods
2
The study site was the north half of Trelease Woods, a 24.5‐ha temperate deciduous mature forest fragment dominated by Acer saccharum near Urbana, IL, USA. Topography is uniform with elevation varying by ±5 m. Observations were made of 17 phenological “events” (nine “stages”) in the annual life cycle of each of 15 dominant canopy tree species, two subcanopy species, two shrub species, two vine species, one vine genus, and saplings of three canopy species (Table 1). Tree species included in this study represented 96.3% of total basal area of trees greater than 22.6 cm DBH, based on data collected during a complete census of the north half of Trelease Woods in 2005 (J. Edgington, unpublished data). Sample size varied among species and declined over time due to mortality (mean = 13.2 individuals per species, range = 1–20 at beginning of study; mean = 7.4, range = 0–20 at end of study). Numbers of the three species of Fraxinus declined to zero near the end of the study and vines and shrubs decreased more than canopy trees and subcanopy trees. Species were included in analyses regardless of number of individuals or number of years with observations for individuals.
The predominant phenological status of each individual was determined using binoculars by the same observer weekly from mid‐February through June for spring events and September through December for autumn events from 1993 to 2021. Aesculus glabra saplings were observed in July–August for their early leaf coloration and leaf drop. Within the duration of each of five vegetative “stages”, three dates, reflecting a given stage being one‐third, two‐thirds, or three‐thirds completed on the individual, were noted, each date being a so‐called phenological “event” (Table 1; Appendix B: Text 1). Added criteria for events were based on a species' distinctive phenology (Appendix A: Tables A1, A2, A3).
For flowering phenology, only beginning (census during first week with 30% flowers open) and ending of flowering (first census after 70% flowers wilted) were recorded because flowering does not have clear developmental changes, and it is impossible to know, on a given census date, how long flowering will continue. Each event was not always observed because of rapid development within the 7‐day census interval; also, change from one event to the next sometimes took more than 1 week. Accordingly, an estimate of the date, based on simple linear interpolation, was made for each non‐observed event. The middle of three events (the “two‐thirds” event) were not used in any analyses, but were critical in determining estimated dates of non‐observed events.
Stage durations were based on event dates (e.g., Bud Swell Duration = [First DOY of Bud Burst] − [First DOY of Bud Swell]; Appendix A: Table A4). Flowering Duration was calculated as the difference between the DOY when 30% of the flowers were open, and 7 days after 70% of flowers were wilted. The two autumn stage durations each were calculated as (DOY of last event—DOY of first event). Total duration of Spring Phenology, Autumn Phenology, and Growing Season were also estimated (Appendix A: Table A4). Accuracy of a stage's duration is determined by census frequency. Greater error results with a greater interval between two censuses and during faster phenological development (Osteros et al. 2013). Given the length of the study, censusing at intervals shorter than weekly was not possible. However, caution in interpreting durations is necessary, especially for the fast‐developing stages in spring.
Our focus is largely on community‐level trends, rather than species‐specific responses. Instead of analyzing and presenting results for 22 species separately for 10 events and nine durations, we categorized species into different “seasonal groups”, with species within each group having similar mean timing of an event (Appendix A: Table A6). It was not desirable to build one model for all species combined because the date for a given event ranges widely among species that have been exposed to different weather conditions. Shorter gaps between the start of a weather metric (or the end of a cumulative weather variable, e.g., “CDD”) and an event date are preferred. This approach provides estimated responses of each species to the predominant weather predictors through random slopes (see below), although the predominant weather variables are determined at the seasonal‐group level and not for each species.
Aesculus glabra (Ohio buckeye or OB) saplings were a unique early seasonal group for almost all spring and autumn vegetative events; for Leaf Expansion, they were combined with OB canopy trees as one early group. OB canopy trees were a second unique early seasonal group for all autumn events. All other species were combined into a late seasonal group for all spring vegetative events through begin Leaf Expansion, but were separated into Intermediate and late seasonal groups for end Leaf Expansion and all autumn events (Appendix A: Table A5).
The mean number of days separating typical event dates within a seasonal group was 17.5 days (range = 12–26 days). Natural breaks of 4–6 days with no species active occurred for end Full Expansion and begin Leaf Coloration. Artificial breaks, used for end Leaf Coloration and both Leaf Drop events, divided the species roughly in half, with a range of about 15 days among species. For durations, each species stayed in the same seasonal group as the beginning event of a stage. Mean number of species in major seasonal groups was 13.5 (range = 3–24). For each combination of seasonal group and phenological measurement, 557–7111 records were in analyses with multiple species; number of individuals ranged from 38 to 327.
Weather Variables
2.1
Weather variables used in model selection to predict each event were based on literature for woody plants (e.g., Xie et al. 2015). Analyses included various combinations of mean daily, maximum and minimum temperatures, growing degree days (GDD for spring, also known as forcing accumulation) and chilling degree days (CDD for autumn and spring, also known as chilling accumulation), number of hot days, as well as total precipitation, number of rain and flood days (see Appendix A: Table A6 for details). Daily temperature and precipitation data from 1992 to 2021 were gathered from the Champaign, IL Weather Station (3S), 8 km SW of the study site. The station is part of the National Weather Service Cooperative Observer Program (US‐COOP, https://www.weather.gov/coop/) and data were obtained through the Midwestern Regional Climate Center (http://mrcc.purdue.edu/). The phenology of a given event may be dependent on earlier vegetative events (Ettinger et al. 2018; Augspurger and Zaya 2020). Therefore, dates of selected prior events were added as variables (“legacy events”), predicting subsequent events (see Appendix A: Tables A7a and A7b for details). Durations were not used as explanatory variables.
A specific combination of weather variables over varying time intervals was used for each event, depending on its timing (Appendix A: Tables A7a and A7b). Shorter gaps between the start of a weather metric (or the end of a cumulative weather variable, e.g., “GDD”) and an event date are preferred. Given the large quantity of analyses and the number of time intervals to cover for each event, we elected to use only 30‐ and 60‐day intervals. The first interval for accumulating a weather variable stopped at a “Stop Date,” the mid‐point in the range of interannual mean event date of species in a seasonal group, and worked backward either 30‐day (labeled as “m” for month) or 60‐day (labeled as “s” for season) intervals. Each subsequent weather variable began the day prior to the earliest day of the previous 30 days or 60 days. Values of the suffix for month and season are larger with a greater number of intervals back from the stop date (e.g., “Rain.m1” indicates rain days in Days 1–30 preceding the Stop Date, while “Rain.m2” indicates rain days in Days 31–60 preceding the Stop Date).
The number of temperature intervals was greatest (6 months and 3 seasons) for Begin Bud Swell and Begin Flowering to include possible chilling requirements in winter and forcing accumulation in spring and for autumn events in order to include weather from most of the growing season. Subsequent events used four 30‐day and two 60‐day intervals for mean temperature, growing degree days (GDD), chilling degree‐days (CDD), chilling degree‐days based on minimum temperature (CDD_i_), and frost days. Precipitation variables used a maximum of four 30‐day (two 60‐day) intervals. In addition to weather data from the previous 4–6 months, we used weather data from the previous growing season to predict event dates for four spring events: Begin Bud Swell, Begin Bud Break, Begin Leaf Expansion, and Begin Flowering. For weather predictors we used mean temperature and total rainfall from the previous year's summer (June–August) and autumn (September–November), as in Prather et al. (2023).
Statistical Analysis
2.2
Analyses for (a) temporal change in event start date, (b) temporal change of stage duration, and (c) weather and/or legacy variables that best predicted event date were tested using linear mixed‐effects models. Statistical methods were based on the methods of Xie et al. (2018) and Augspurger and Zaya (2020). All mixed‐effects models were constructed using R version 4.0.4 (R Core Team 2021) and the lme4 package (Bates et al. 2015). All analyses were based on event dates observed on individual plants in each year, with stage durations calculated from these event dates. Standardized values of explanatory variables, scaled to have a mean of zero and standard deviation of one, were used in all analyses. However, raw (unscaled) values are used for result visualization, unless stated otherwise.
Nine events were analyzed for temporal change in event dates, five spring events and four autumn events (Appendix B: Text 1; Appendix C: Tables C1a and C1b). For each event, separate analyses were conducted for groups of species that had similar timing. Species were separated into two to four seasonal groups for each event, with a total of 27 combinations of event and seasonal group (11 spring; 16 autumn). A separate set of mixed‐effects models was created for each event‐season combination. The response variable was event date, measured as day of year. All models included random intercepts for individual plants. All models also included a random intercept for species (canopy trees and saplings of a single species were treated as separate groups). Random slopes for species were tested if an analysis had more than three species.
To test for temporal change in event dates, first, the fixed effects structure was chosen using model selection with the Akaike information criterion corrected for sample size (AIC_C_). Second, building from the optimal fixed effects structure, the optimal random effects structure was selected using the conditional AIC (cAIC; Greven and Kneib 2010), calculated with the cAIC4 package (Saefken and Ruegamer, 2018; Saefken et al. 2018).
The temporal changes in the durations of nine stages were also tested (five in spring, four in autumn, and Growing Season spanning the two seasons; Appendix C: Table C2c). Seasonal groups were assigned based on the first event marking the stage. Each stage had 2–4 seasonal groups with a total of 24 combinations of stage and group. The same analytical approach was used for the durations of stages as described for event dates, except that the response variable was stage duration measured in days.
To test the influence of higher phylogenetic effects, we also constructed a set of temporal change models with genus, family, and order in the random effects structure for a subset of response variables. We found little to no improvement of model performance (∆AIC_C_ between −0.14 and 0.36) when using higher taxonomic classifications. Thus, we proceeded with models that included only species in the random effects structure and do not report results for the higher phylogenetic groupings.
For analyses of the relationship between event dates and weather variables, we tested the dates of seven events in 19 separate analyses based on seasonal groups of species (Appendix A: Tables A8a and A8b). These events and seasonal groups were the same as for the analyses of the temporal trend in event dates, except that End Leaf Coloration and End Leaf Drop were excluded because they are largely determined by the preceding event (“Begin” for each). In all analyses, the response variable was the event date, measured as day of year (DOY). Fixed effects consisted of weather variables and, in most cases, phenological variables that preceded the response (legacy effects). Weather variables described temperature and precipitation in multiple 30‐day intervals (“months”) or 60‐day intervals (“seasons”) preceding the typical date for an event within a seasonal group. The optimal fixed effects and random effects structures were chosen for each weather or legacy variable individually, using model selection with AIC_C_.
Models were created using weather and/or legacy variables in combinations of three or fewer variables, and compared with AIC_C_. Fixed effects included in the top model and at least four of the top five models were highlighted as important explanatory variables. For the weather variables chosen as important explanatory variables of a specific event date, we used linear regression to test for temporal change in the weather variable through time (1993–2021).
After we found the best model of weather and legacy variables predicting an event date, we repeated the tests of temporal change for the event date (linear mixed‐effects model) and weather variable (linear regression) for a shorter time period, 1993–2017; 2018–2021 had great variation in temperatures. Random slopes assigned to each species were used to determine relative thermal sensitivities.
In all three sets of analyses (temporal changes of event dates, temporal changes of stage duration, and weather or legacy variables that predict event dates), models were initially constructed using maximum likelihood for comparison with information criteria. Final model parameters were determined using restricted maximum likelihood. Confidence intervals for the species‐level coefficients were calculated using posterior simulations conducted with the arm package (Gelman and Hill 2007; Gelman and Su 2020). See Appendix B: Text 2 for further details on statistical modeling for all three groups of analyses.
Two approaches were used to evaluate models; see Appendix B: Text 3 for details.
Results
3
Spring Phenological Change
3.1
Early stages of spring phenology, based on means of 29 years, vary only about 2 weeks among canopy tree species, but become more variable as stages progress (Figure 1); Aesculus glabra is notably early. Non‐canopy tree species are more variable than canopy tree species, while saplings experience some period of beneficial high light as they predate conspecific canopy trees, markedly so in Aesculus glabra (Figure 1).
Annual phenology of each study species from 1993 to 2021 in Trelease Woods, Illinois, USA. See Appendix A: Table A5 for species nomenclature. Values plotted are mean dates per phenological event across all years; within a given year, the value for an event was calculated as the mean date across individuals of a given species. Species are ordered by mean date of beginning of bud swell, first by canopy tree species, then by treelets, shrubs, and vines, and finally by saplings of three canopy tree species. The vertical line indicates the date of full leaf maturity; the dark green line to the left of the vertical line indicates the period during which the fully expanded leaf is maturing. The dotted dark green line for grape indicates opportunistic growth of the vine for irregular periods of time. Not all species were used in analysis of a given event (see Appendix A: Table A5).
Flowering by most species, largely wind‐pollinated, is during Bud Burst and before Leaf Expansion, allowing the possibility of reducing leaf interference of moving pollen (Figure 1). Exceptions include the very early‐flowering, wind‐pollinated Ulmus species and insect‐pollinated, Lindera benzoin , and the later‐flowering Juglans nigra , Gymnocladus dioicus , and especially Tilia americana ; the latter two species are not wind‐pollinated.
Over 29 years, beginning of spring events advanced for all 11 event–season combinations, except Aesculus glabra (Figure 2; Appendix C: Table C1a). Greater advance occurred with successive vegetative events, from 1.2 days/decade for Begin Bud Swell to 2.2 days/decade for End Leaf Expansion (Appendix C: Table C2a). For all species and events, 89.7% of spring events advanced, significantly more than expected at random (two‐sided exact binomial test, p < 0.00001; Appendix C: Table C3a). Advances for spring events result in a shorter time to full leaf expansion, and bring deep shade sooner to the understory.
Change per year in 14 event dates versus relative phenology, for each species. Species are separated into seasonal groups for each event. Negative values on the y‐axis indicate earlier dates (advances), positive values later dates (delays). Values on the x‐axis indicate relative phenology (random species intercepts), where lesser values indicate species with earlier phenology. Solid vertical lines and dashed horizontal lines give the 95% bootstrap CI. Change in days represents the coefficient (random species slope, b) from linear mixed‐effects models, while the model intercept is the random species intercept from those models, as in the equation date = b(year) + intercept, where the year 1993 is set to year = 0. Two letters refer to abbreviation of the common name (see Appendix A: Table A5). The large red dot is the coefficient of the same variables from the seasonal group‐level analysis (±2 SE; red vertical and horizontal lines; Appendix C: Tables C2a and C2b). For red dots with no vertical SE, the top model did not include year as a fixed effect, that is, the event date did not change through time.
For all spring events, except Begin (Late) and End (Late) Leaf Expansion, the degree to which a species shifted over time was correlated with that species' phenology (Figure 2; Appendix C: Table C1a). For example, Begin Bud Swell (Late) advanced more (y‐axis in Figure 2a, representing random species slopes) in species with later baseline Begin Bud Swell dates (x‐axis in Figure 2a, the random species intercepts). The pattern of species' differences in extent of advance results in less variation among species in spring event dates through time.
Durations of spring stages shortened or did not change, except Bud Swell Duration of Aesculus glabra saplings became longer (Figure 3; Appendix C: Table C3c). For all species and spring stages, 61.5% shortened, significantly more than expected at random (p < 0.007; Appendix C: Table C3c). Overall, Spring Duration shortened by a mean of 1.2 days/decade; 69.6% of species shortened (p < 0.029). For all four spring durations (Late), the degree to which a species shortened over time (y‐axis in Figure 3a) was correlated with its duration (x‐axis in Figure 3a; Appendix C: Table C4a). Species' differences in amount of shortening of duration may affect the degree of overlap among species, depending on the interaction with event date advances.
Change per year in 12 stage durations versus relative phenology, for each species. Negative values on the y‐axis indicate shortening durations, while positive values indicate lengthening durations. Values on the x‐axis indicate relative phenology (random species intercepts), where lesser values indicate species with shorter durations. See Figure 2 legend and Appendix C: Table C2c for additional details.
Autumn Phenological Change
3.2
Based on means of 29 years, a month separates canopy tree species in autumn events, except Aesculus glabra is notably early (Figure 1). Conspecific canopy trees predate saplings of Acer saccharum and Fraxinus quadrangulata , but saplings of Aesculus glabra greatly precede conspecific canopy trees. Non‐canopy species are somewhat earlier than canopy trees. The variation among species in the extent of overlap of timing of Leaf Coloration and Leaf Drop and large temporal differences among species are conspicuous (Figure 1), suggesting that the two processes are not tightly integrated and that all species either are not responding to the same environmental factor(s) or have different sensitivities to it.
Over 29 years, autumn events delayed for all event‐season combinations, except Aesculus glabra (Figure 2) (Appendix C: Table C1b). Delays ranged from 1.2 days/decade later for Begin Leaf Coloration (Intermediate) to 3.3 days/decade for Begin Leaf Coloration (Late) (Appendix C: Table C2b). For all species and events, 87.0% of autumn events delayed, significantly more than expected at random (p < 0.00001; Appendix C: Table C3b). These delays in most canopy tree species result in the deep shading of the understory persisting somewhat later.
Durations of autumn stages lengthened for six of eight stage‐season combinations (Figure 3; Appendix C: Table C2c) from 0.8 days/decade for Leaf Drop Duration (Late) to 3.8 days/decade for Leaf Drop Duration ( Aesculus glabra tree). Across all species, 84.0% of stages lengthened, more than expected at random (p < 0.00001; Appendix C: Table C3d). Total Autumn Duration did not lengthen for most groups. Among species, only 40% lengthened (p < 0.32).
For a given autumn event, the rate of change varied among species, but showed many more delays than advances (Figure 2; Appendix C: Table C3b). For all four autumn events, except End Leaf Coloration (Late) and all durations, the degree to which a species shifted over time was not correlated with that species' phenology (Appendix C: Tables C1b and C4b). Relative to spring, there is less similarity among species in autumn phenological responses to environmental factors and/or more variation in sensitivity to it.
Length of Growing Season
3.3
Length of Growing Season is determined by the duration between Begin Leaf Expansion and Begin Leaf Coloration. Overall, Begin Leaf Expansion advanced for 88% of species by a mean of a 2.0 days/decade from 1993 to 2021, while Begin Leaf Coloration delayed for 84% of species by a mean of 2.3 days/decade (Figure 2; Appendix C: Tables C3a and C3b). As a result, the growing season lengthened by 4.7 days/decade and for 88% of all species (p < 0.00007; Appendix C: Table C3d). Overall, the lengthening is due slightly more from autumn delays than spring advances.
Non‐canopy woody species had a greater lengthening in growing season than canopy tree species (Figure 4). Non‐canopy species had a significantly greater advance in spring phenology (t = 2.5, df = 13, p = 0.028) rather than a greater delay at the end of the growing season (p = 0.585; Figure 4b; Appendix C: Tables C3a and C3b). This difference results in non‐canopy species having a longer time in high light in spring, but not in autumn, although with variation among species.
For each species of (a) canopy trees and (b) non‐canopy trees ( = sapling of canopy tree) over 1993–2021, a comparison of the number of days of change per year in spring (Begin Leaf Expansion; left dot) versus autumn (Begin Leaf Coloration; right dot) as a function of mean day of year of the event. Advances have negative values and delays have positive values. A black circle indicates the season that resulted in greater change in length of Growing Season; steeper slopes indicate a greater change in its length. Values were derived from each species' random slope coefficient for each event in the top mixed‐effects model (Appendix C: Tables C4a, C4b, C3c, C3d).*
Weather Factors Predicting Phenology: 1993–2021
3.4
Among spring weather variables, “GDD” (forcing accumulation) had the strongest predictive power for 10 of 11 event–season combinations and was included in the top statistical model for all 11 events (Appendix C: Tables C5a and C6). “CDD,” an indicator of chilling accumulation, played a secondary role in models of the first spring event, Begin Bud Swell, and Begin Flowering (Late), suggesting that a chilling requirement may be a prerequisite in some cases before responding to forcing warm temperatures. A legacy event (Begin Bud Swell, Begin Bud Burst, or Begin Leaf Expansion) was the strongest predictor of five of 11 events, but “GDD” was the secondary variable in those same events. Precipitation variables, if included at all, were in secondary or tertiary roles in predictive models (Appendix C: Table C5a). When included, they were in only one of five top models, except “Rain.m3” was in all five top models for End Leaf Expansion of Aesculus glabra saplings and trees (Appendix C: Table C6). Temperature plays a much more key role than precipitation in predicting spring events.
The spring phenology of all species advance in warm years or delay in cold years. For each of the strongest weather predictors for spring events, random slopes fit to each species all had a negative sign. Events advanced by a mean of 0.07 day/1‐unit GDD increase (range = 0.02–0.11 days; Appendix C: Tables C7a and C8). Species differ two to fivefold in their thermal sensitivity to the weather variables that best predicted community phenology (Figure 5).
Change in date of seven events per weather variable unit (thermal sensitivity) versus relative phenology, for each species. Species are separated into seasonal groups for each event. Solid vertical lines and dashed horizontal lines give the 95% bootstrap CI. The relationship for a given event was included in this figure only if there was a weather variable that performed consistently as a predictor (Appendix C: Table C6) and random‐species slopes were included for that variable (Appendix C: Tables C4a, C4b, C10a, and C10b). Change in date per weather variable unit is the random‐species slope for the top model describing the relationship (Appendix C: Tables C7a and C7b), while relative phenology date is the random‐species intercept from the model. Smaller model intercept (x‐axis) values correspond with earlier phenological events. Letters refer to species' common names (see Appendix A: Table A5 for species and abbreviations). The large red dots represent the overall model coefficients for all species in the seasonal group‐level analyses (±2 SE; red vertical and horizontal lines; Appendix C: Table C6). All values in this figure represent the results of analyses based on untransformed (i.e., not standardized) values.
Among weather variables in autumn, (CDD), a measure of chilling accumulation, had the strongest and most consistent predictive power for six of eight event–season combinations (Figure 5; Appendix C: Table C6). The legacy event of Begin Leaf Coloration was the top predictor for Begin Leaf Drop for all four event–season combinations, but a temperature variable was the secondary variable in those same events (Appendix C: Tables C5b and C6). Rain days played the primary role for Aesculus glabra saplings and drought was a secondary factor for Aesculus glabra trees in models for Begin Leaf Coloration; each was in the five top models (Appendix C: Table C5b). Precipitation variables were less influential for Intermediate/Late Groups. Begin Leaf Drop (Late) had no consistent weather predictor (Appendix C: Table C5b). Overall, the early autumn events that are potentially important for carbon gain are delaying as temperatures increase, while later events have less predictable patterns.
For most autumn events, species‐level slopes associated with the strongest weather predictor had primarily the same positive sign, indicating a delay in the event with an increase in temperature (Figure 5, Appendix C: Table C7b). However, the thermal sensitivity varied among species for each event–season combination, ranging from an advance of 0.1 day/1°C increase to a delay of 3.9 days/1°C increase. Additionally, there were large differences among seasonal groups; late species overall showed double the sensitivity in Leaf Coloration compared to Intermediate species, and the two groups had opposite reactions to warming for the timing of Leaf Drop (Appendix C: Table C8). Temperature variables for Begin Leaf Coloration for Aesculus glabra trees and Begin Drop (Late) had a negative sign (Appendix C: Table C8), indicating warmer conditions were associated with advances by a range of 0.38–2.03 days/1°C increase (Figure 5; Appendix C: Table A7b). As in spring, almost all species respond similarly to cold or warm temperatures in their autumn phenology, but with greater variation among species and greater thermal sensitivities.
In spring, eight of 11 analyses showed a shift to earlier event dates (Figure 6). All spring events had a strong weather predictor consistently in the top models. However, no weather predictor changed significantly from 1993 to 2021 (Appendix C: Table C9a). Years from 2018 to 2021 had particularly strong variation in spring weather (e.g., Figure 6d). For analyses restricted to 1993–2017, six had a significant temporal change in spring event dates and weather predictors (Figure 6). Therefore, additional support for the association of many phenological events shifting with changing weather in spring was found for the years 1993–2017, although not when including 2018–2021.
Inter‐annual variability in mean date of 18 phenological event‐by‐season combinations (red values) and the strongest weather model predictor for each (black values) from 1993 to 2021. Note that “OB” refers to Ohio buckeye, “Mean temp.” refers to mean daily mean temperature, and “Minimum temp.” refers to mean daily minimum temperature. When multiple weather variables were in the top five models (Appendix C: Tables C5a and C5b), the variable chosen had the highest absolute t‐value in the top model (Appendix C: Table C6). An inverted scale for the event date (left Y‐axis) was used for events that were negatively correlated with the weather predictor (all panels except L, N, O, and R). For weather variables, solid black regression lines represent the least‐squares regression through time when a significant trend was present (p < 0.05; Appendix C: Tables C9a and C9b), while no line indicates a non‐significant trend. For phenological events, solid red regression lines were created from the parameters in the change‐through‐time mixed‐effects model (Appendix C: Tables C1a and C1b); panels where red regression lines are absent represent cases in which year was not included in the top model (Appendix C: Tables C1a and C1b). Dashed lines show significant temporal trends from 1993 to 2017 for the weather variable (dashed black line) and event date (dashed red line) in cases with nonsignificant trends through 2021. A black asterisk () indicates that both phenology and weather variables have significant trends from 1993 to 2021, indicating support for the hypothesis that phenology has shifted with climate change. A red asterisk indicates that both phenology and weather variables had significant trends from 1993 to 2017, but not when including the last four years of data collection (driven by an extreme spring in 2018). End Leaf Drop (Late) is not presented because it had no weather variable in four of the top five models.*
Four of eight analyses had a strong weather predictor for autumn event date, and four more analyses had a strong secondary weather predictor when a legacy event was the strongest predictor (Appendix C: Table C6). Finally, four analyses had both a delay in phenology and a strong weather predictor that changed significantly through time (Figure 6; Appendix C: Table C9b). Aesculus glabra saplings with summer senescence were one exception as their predictor, Rain Days, was highly variable. The other exception was Begin Leaf Drop (Late) with no strong weather predictor. Therefore, additional support for an association of a change in autumn phenology with a change in weather was found for four of eight event–seasonal groups. Importantly, those four groups included 24 of 25 species–life form combinations. Thus, the strong shifts in phenology over this time interval are concordant with climate change.
Model Evaluations and Random Effects Variance
3.5
The majority of variance in the statistical models was captured by the random species intercepts. In all cases, there was greater (in one case equal) variance captured by species intercepts rather than the individual intercepts. Overall, the individual intercepts contributed little to the explanation of variance. Additionally, random species intercepts were much more influential than the random species slopes associated with weather predictors (for details, see Appendix B: Text 4; Appendix C: Tables C10a and C10b).
In model evaluations, model performance was similar for tests of temporal trends in event dates and temporal trends in stage durations. In evaluating the 19 models with weather or legacy variables predicting spring and autumn event dates, model robustness was improved with R ^2^ values that were approximately doubled (for expected values predicting observed values), and with lower root mean square errors (see Appendix B: Text 3 and Appendix D for detailed results of model evaluations with 10‐fold cross‐validation).
Discussion
4
Changes in Temporal Pattern
4.1
Spring
4.1.1
Over the past three decades, this temperate deciduous forest experienced advances in the start of various vegetative spring events, from 1.2 to 3.3 days/decade. Flowering for most species advanced 1.2 days/decade. Among species, 95% of all spring events were earlier. To a lesser extent, durations of stages shortened. This extent of advancement is comparable to studies in the eastern USA (Yue et al. 2015) and European deciduous forests (Chmielewski and Rötzer 2001; Fu, Piao, et al. 2014), less than results from China (Ge et al. 2015), but greater than leaf‐out records of the USA National Phenology Network (Piao et al. 2019).
Plants living in cold winters develop a cold hardiness that prevents premature response to spring warmth. Generally, cold hardiness must be lessened before development can be forced by accumulating temperatures. Therefore, timing of bud break is affected by a chilling accumulation, the rate of loss of cold hardiness prior to bud break, and spring forcing temperatures (Kovaleski 2022). In this study, both late spring events and late species advanced more than early spring events and early species (Figure 2), reflecting the temporal acceleration in warmth and perhaps species' differences in rate of loss of cold hardiness or differences in thermal sensitivity.
In addition to changes of relative dates across species, there is the potential for changing of relative dates across events within a species, or “phenological decoupling” (Guo et al. 2023; Picornell et al. 2023). Phenological decoupling increases (or decreases) the time between stages. For example, earlier leafout can interfere with wind pollination (Buonaito and Wolkovich 2024). However, in this study the shift in timing of End Leaf Expansion and Begin Flowering for wind‐pollinated study species did not differ significantly (data not shown; p > 0.35).
Decreasing the difference in spring timing between late and early species decreases their difference in time to accumulate nutrients and carbon, affecting competitive ability (Roberts et al. 2015). Likewise, as in Klosterman et al. (2018), when spring warming started later, leaf development from budburst to leaf maturity in general became shorter. However, advances of earlier and shorter spring stages are of less physiological significance than later and faster spring stages because early leaves are not yet at leaf expansion, the period of rapid development of photosynthetic machinery and leaf size (Gu et al. 2003; Augspurger et al. 2005). Faster leaf expansion shrinks the time to form chloroplasts, accumulate chlorophyll, and manufacture all apparatus for photosynthesis during leaf development (Jiang et al. 2006). If this process is completed rapidly (and therefore sooner) in spring, a longer period at peak photosynthesis rates arises, potentially increasing the individual plant's carbon storage, depending on respiratory costs (Gu et al. 2003).
Faster leaf expansion also lessens the time to leaf maturity, resulting in less time for herbivores to feed during the leaf's most vulnerable expanding leaf stage (Wiggins et al. 2016). Also, a greater advance by a late species may bring an advantage in interspecific competition. Importantly, at the ecosystem level, the timing of spring stages has a large effect on early‐season productivity and carbon sequestration of deciduous forests. In an advanced spring, carbon uptake via photosynthesis can exceed its loss via respiration (Keenan et al. 2014), but see below.
Advances of spring stages and rapid leaf development are not always positive. Plants can respond to a “false spring,” that is, when particularly early warmth initiates development that is later damaged by a cold period (Vitasse et al. 2018). Studies have found that expanding buds are least cold hardy, while expanding leaves are slightly more resistant to freezing (Lenz et al. 2013, Chamberlain et al. 2019; North and Kovaleski 2024). However, warmer winters with shorter chilling can delay leaf‐out, extending the period of frost risk (Chamberlain and Wolkovich 2021). At our study site, record‐breaking warm temperatures in March 2007 brought rapid leaf development, followed in early April by a record‐breaking freeze that destroyed many expanding leaves. Buds were not damaged more than expanding leaves because most buds had opened and thus were not exposed to the freeze. Re‐foliation occurred, but brought delayed full leaf expansion (Augspurger 2009). Frost events of differing severity were common throughout the study. The combination of spring warming and temperature extremes may be becoming more common (Augspurger 2013), which may threaten individuals of particular species and life forms (e.g., A. glabra saplings, vines in general) with greater damage or mortality (Augspurger 2011).
Autumn
4.1.2
All seasonal groups, except canopy trees and saplings of Aesculus glabra , delayed the start of autumn events from 1.2 to 3.3 days/decade and, to less of an extent, lengthened durations, especially leaf drop in some species. Among species, 87% of autumn events were delayed. This study's delay of leaf coloration is comparable to Chinese (Ge et al. 2015) and European trees (Menzel et al. 2020). In a world‐wide analysis, leaf coloration in deciduous forests delayed 3.3 days/decade (Gill et al. 2015).
Carbon gain depends in part on how long plants can stay at their peak level of photosynthesis as autumn's leaf coloration approaches (Gu et al. 2003). Generally, the amount of photosynthesis per unit time declines from mid‐ to late‐summer onward because of the start of breakdown of its machinery (Krupinska and Humbeck 2004; Augspurger et al. 2005). Loss of chlorophyll is correlated with temperature and day length, and is connected to various hormones triggering senescence (Zhang, Dai, and Ge 2020). An increase in growing season productivity may promote earlier leaf coloration (Zani et al. 2020). This study's results of a delay in leaf coloration may reflect a delay (or slower rate) of the breakdown of photosynthetic machinery. Any delay thus may provide a longer, continuous period of photosynthesis, although a lower sun angle in autumn than spring brings less solar radiation for photosynthesis (Zhang, Commane, et al. 2020). A longer duration of leaf coloration also may indicate a longer period for nutrient remobilization from leaves (Calinger and Curtis 2023). Sequestration of nitrogen before leaf drop and nitrogen storage is critical for manufacturing photosynthetic machinery in new spring leaves, and for spring growth (Jordan et al. 2012; Estiarte and Peñuelas 2015).
Unlike spring events, the amount of delay for autumn events was generally independent of when species started leaf coloration. Species delaying leaf coloration may experience greater competitive ability by accumulating more net carbon and nutrients, although that advantage may be tempered by decreased available radiation in autumn (Zhang, Commane, et al. 2020).
Length of Growing Season
4.2
A longer growing season is the major consequence of these spring advances and autumn delays. From 1993 to 2021, the growing season in this study's forest community lengthened by 4.7 days/decade for all species, excluding the early Aesculus glabra. Few long‐term studies of both spring and autumn changes for a forest community are available to compare recent growing seasons; most focus on only spring phenology.
The growing season lengthening is due more to a delay of Begin Leaf Coloration (2.3 days/decade) than advance of Begin Leaf Expansion (1.9 days/decade), very similar to estimates for Continental Europe (Garonna et al. 2014). Both experimental (Fu et al. 2018) and satellite (Garonna et al. 2014) studies in Europe have found a greater delay in autumn than an advance in spring leaf out in recent decades. As in this study, the lengthening of the growing season in mid and high latitudes in North America from 1982 to 2006 was due to delayed autumn and not advanced spring (Zhu et al. 2012).
A complete picture of the effect of long‐term changes in phenology requires more than quantification of the length of the growing season. The relative contributions of timing and speed of leaf photosynthesis and respiration, driven by changes in phenology in both spring and autumn, need to be modeled to better understand the significance of both advances and delays of leaf phenology in temperate deciduous forests. The capacity of the forest vegetation to assimilate CO_2_ differs between a comparable advance in spring and delay in autumn. An advanced spring can result in positive net carbon gain (Keenan et al. 2014). However, during a delay from warmer autumns and a longer growing season, carbon uptake via photosynthesis can be much less than carbon loss via respiration (Dunn et al. 2007; Piao et al. 2008).
Overall, the lengthening of the growing season is potentially important at multiple spatial scales. Globally, it may lessen carbon atmospheric input from biological processes, including respiration (Polgar and Primack 2011). Regionally, it affects immigration and species' ranges (Morin et al. 2007), thereby affecting community assembly and changing local species composition with different temporal niches (Morin and Thuiller 2009; Wolkovich and Donahue 2021; Ponti and Sannolo 2023). Locally, it changes the period of ecosystem services by canopy trees, including productivity (Richardson et al. 2010), water run‐off (Chen et al. 2022), and nutrient absorption and later remobilization (Estiarte and Peñuelas 2015). Also, it potentially impacts species' demography (Iler et al. 2021), population size, intra‐specific and inter‐specific competition (Fridley 2012), and interactions with higher trophic levels (Rudolph 2019; Robertson et al. 2024). Finally, it expands the potential influence by the canopy on the light environment of understory species (Augspurger and Salk 2024; Xiong et al. 2024).
Weather Predictors
4.3
Identifying a weather predictor strengthens the claim of an association between phenology adjustments and climate change. Also, it gives insight into a possible environmental control of an event, and offers where to explore its exact mechanism (Kðrner and Basler 2010).
Spring Phenology
4.3.1
The strongest predictors of spring events were predominately temperature variables, expressed as GDD (cumulative forcing) of different thresholds, or earlier legacy events within the same season. Accumulating warmth of the preceding month or 60 days predicted earlier event dates, but, in contrast to Fu, Campioli, et al. (2014), the association between prior year's weather predictors and spring events was relatively weak. Overall, these results are similar to studies in the Northeast USA (Richardson et al. 2006), Europe (Menzel et al. 2006), and Asia (Geng et al. 2020). When a legacy event was the strongest predictor, a temperature variable was the second strongest predictor. Precipitation was not a strong predictor for any spring events. Weather variables from the prior year were not among the most predictive variables of spring event dates (but see Blonder et al. 2023; Prather et al. 2023).
Our analyses were based on groups of species. It is possible that individual species' analyses would provide greater resolution of weather variables' influence on phenology, as well as interactions between weather variables. However, studies differ in their findings, even for individual species.
Multiple environmental variables likely interact to determine a species' phenology. Photoperiod and winter chilling, in addition to temperature forcing, can be required for initiating spring phenology (Basler and Kðrner 2012; Flynn and Wolkovich 2018). Fixation on a direct temperature control of phenology may obscure how mechanisms may interact to influence phenological trends. For example, some spring events had CDD (chilling accumulaton) as a secondary predictor, perhaps related to an additional chilling requirement over winter prior to responding to spring warmth (Wang et al. 2020; Zhang et al. 2022). Additionally, patterns of warmth in winter and spring may affect leaf unfolding rather than earlier events (Zhang et al. 2022). Greater warmth (less chilling) in autumn may delay induction of dormancy, thus resulting in less advance in spring events (Beil et al. 2021). While spring events advanced in this study, the non‐experimental methods cannot evaluate if the extent of advance was affected by delayed dormancy. Warming in both winter and spring may result in both a delay in reaching the chilling requirement and an advance from forcing warm temperatures (Ettinger et al. 2020). With these opposing forces, it is difficult to determine the exact factor(s) influencing spring phenology.
Photoperiod control has been studied for some temperate trees. An extensive experimental study found that day length limited responses to climate change in a minority of Northern Hemisphere species (Zohner et al. 2016, but see Flynn and Wolkovich 2018). Shrub species tended to show smaller budburst responses to photoperiod than many tree species, but this was not seen for leafout (Flynn and Wolkovich 2018). Focusing on 12 study species with European (Basler and Kðrner 2012; Laube et al. 2014; Zohner et al. 2016) and North American (Flynn and Wolkovich 2018) experimental studies that included photoperiod control, the four study species with high photoperiod sensitivities, Quercus macrocarpa , Quercus rubra , Acer saccharum , and Carya cordiformis , each showed a weak temporal trend, but not near constancy, of dates of spring events through 29 years. Temperature may have a greater influence than photoperiod on timing of spring phenology for these species, although interactive effects among environmental cues can be large (Flynn and Wolkovich 2018).
Autumn Phenology
4.3.2
Similar to Archetti et al. (2013), the major predictor of the delay in Begin Leaf Coloration was minimum temperature of September/October. Precipitation variables were of secondary or tertiary importance for almost all species. Identifying possible drivers of phenology is dependent on the range experienced within a weather variable. During this study period, most species did not experience heavy rainfall or heat stress, which Archetti et al. (2013) and Xie et al. (2018) found to be important variables predicting autumn phenology in northeastern forests of the USA. Only the very early coloration of Aesculus glabra saplings and canopy trees included drought and hot summers as predictors. Contrasts in precipitation during the study were greater than temperature during summer and early fall and may explain this species' dependence on these changes as triggers to initiate leaf senescence.
Begin Leaf Drop was most strongly predicted by the legacy event of Begin Leaf Coloration, followed by minimum temperature, as in Xie et al. (2018). As noted by Ettinger et al. (2018), earlier “legacy events” can be stronger predictors than weather variables of many subsequent events, but only events within the same season. While this study indicates an increasing delay in autumn senescence over recent decades, predicted by warmer temperatures 1 month earlier, further exploration of earlier season(s) factors is warranted. Unlike Keenan and Richardson (2015) in the Northeastern USA and experimental studies of Fu, Campioli, et al. (2014), warming inducing an earlier spring at this local scale was not among the strongest predictors of earlier Leaf Coloration. Studies of productivity prior to autumn are needed (Zani et al. 2020), as well as comparisons of the rapidity of warm versus cold years on spring development and speed of development to the end of senescence (Zohner et al. 2023).
Association With Climate Change: Integration of Weather and Phenology
4.4
A strong weather predictor indicates it is highly correlated with the timing of a specific phenological event, but does not provide evidence of its direct causation of the event. By our taking the additional step of determining that both the phenological event date and weather predictor show parallel (or inverse) linear change through time provides further evidence of a direct association between phenology and climate change (Menzel et al. 2006). Analyses indicating temporal change in both weather and phenology for many woody species in a North American deciduous forest have not been done.
In this study of woody species, the temporal pattern of autumn, but not spring, events did parallel the temporal patterns of specific weather predictors over the period 1993–2021. However, by restricting the analyses for spring to 1993–2017, spring events also showed weather and phenology concordance. Interannual variation of temperatures is increasing (Liu and Zhang 2020). During our study, February and March had high interannual variation that included some extreme weather years, particularly from 2018 to 2021, thereby obscuring some long‐term patterns (Liu and Zhang 2020).
For three of four major autumn event‐season combinations, concordance between weather and phenology is strong because their predictor, September minimum temperatures, increased significantly over all the study's years, while autumn events were delayed. In the Midwest, USA, minimum temperatures have increased more than maximum temperatures from 1901–1960 to 1986–2016 (Wuebbles et al. 2017). The exception for autumn concordance was Begin Leaf Drop for the few Late species with no strong weather predictor. These late species show erratic patterns of leaf drop, with leaves withering, but not always dropping soon thereafter. In addition, some species have a very slow senescence, sometimes even dropping green leaves after a very late frost. It is unknown whether negative consequences arise from these atypical responses. Perhaps they affect the amount of nutrients mobilized from leaves, thus affecting nutrients needed for leaf development in spring (Jordan et al. 2012).
Thermal Sensitivities and Species‐Specific Traits
4.5
Within a given seasonal group, most or all species showed the same pattern of advance or delay of events. Durations showed more inter‐specific variation than events. However, the study species shift a given event at different rates and a given species shifts different events at different rates. Aesculus glabra is a clear outlying species in both its early spring and autumn phenology, especially its saplings. This species has different timing and sensitivity, as well as dependence on precipitation rather than temperature. Their saplings show growth and survival benefits from the high light of early spring (Augspurger 2008), but are vulnerable to late spring frosts (Augspurger 2011).
In general, species differ in the environmental factor(s) related to their phenology. Some may be sensitive to drought, photoperiod and/or winter chilling, have a low sensitivity to temperature change, or lack adaptive plasticity to respond. Thermal sensitivities in spring vary among the study species two‐ to fivefold (Figure 5), depending on event, similar to European trees (Vitasse et al. 2009). For early events, earlier species don't respond to warming as much as later species. Perhaps early species are vulnerable to frost and have a greater chilling requirement and/or lower thermal sensitivity to initiate spring growth, thus responding slower to warming.
Differences in sensitivities among species regulate the extent of species' overlap in spring and/or autumn. In turn, species‐specific differences in phenological change may result in shifting biotic interactions (Vitasse et al. 2009), including interspecific competition (Roberts et al. 2015). Some species may become winners and others losers as climate change continues, leading to changing communities (Diez et al. 2012).
Functional traits (Panchen et al. 2014), as well as phylogeny (Willis et al. 2008), may explain some species' differences in phenology. The study species differ in phylogeny, leaf size and complexity, determinacy of shoot development, and xylem anatomy, as well as light environment of different life stages, and growth forms. Although sample size limits statistical analysis, trends related to some traits were evident and confirm earlier studies.
First, phylogenetic relationships were not important in explaining phenological differences among the limited diversity of species. Second, Gymnocladus dioicus and Juglans nigra, with the latest End Leaf Expansion (and longest Duration of Leaf Expansion), have doubly compound and simple compound leaves, respectively, and the greatest median leaf lengths among our study species. Third, exceptionally late End Leaf Expansion occurred for Asimina triloba and Zanthoxylum americanum, both understory species with indeterminate shoots that continue to expand opportunistically in high light. Fourth, as first noted by Lechowicz (1984), xylem anatomy is associated with phenology. Begin Bud Swell and Begin Bud Burst were earlier by 9–10 days for the four species with diffuse‐porous xylem (Aesculus glabra, Carpinus caroliniana, Acer saccharum, and Tilia americana ) than the other species, all of which have ring‐ or semi‐ring‐porous anatomy. The large diameter vessels of ring‐porous species are subject to cavitation; their repair to begin water transport in spring results in later bud swell/burst (Lechowicz 1984). Finally, saplings predated conspecific canopy trees in spring events for all three species, but only for Aesculus glabra in autumn events. These results confirm a broader, earlier study in the same forest (Augspurger and Bartlett 2003). Temperature differences at the two levels of the forest (Augspurger 2004) or ontogenetic changes (Vitasse 2013) may explain the differences in timing between life stages in the understory versus the canopy.
Significantly, this is the first study to show that growth forms were mismatched in which season lengthened the growing season more. Canopy trees had a greater delay in autumn than advance in spring. In contrast, non‐canopy woody species had greater advance in spring than canopy trees, but did not differ from trees for the end of the growing season (Figure 4). Growing season lengthened more for non‐canopy woody species than canopy tree species. The difference in timing potentially provides more light for understory woody species. In contrast, Ge et al. (2015) found no differences in phenology between trees and shrubs from 1960 to 2011.
Other Applications
4.6
An additional study (Augspurger and Salk 2024) compared this study's data on woody species to that from a comparable, contemporary phenological study of the Trelease Woods community of 33 herbaceous species (Augspurger and Zaya 2020). Light availability in the understory from 1995 to 2021, resulting from phenological change of canopy tree species, was directly quantified. Most herb species and saplings adjusted their phenology comparable to canopy tree species, with little change in light to the understory (Augspurger and Salk 2024). Only a minority of these understory species have been receiving less light with the trend of increasing warming in the past 2.5 decades. Gross carbon gain by four of the study's herb species showed patterns similar to light patterns over the decades. Ultimately, changes in light available to more species of herbs (Heberling et al. 2019) and woody understory species need to related to gains in net carbon assimilation.
Data from this study have been used as ground‐truthing of remotely sensed imagery of spring canopy phenology at the study site. First, the framework developed by Zhao et al. (2023) effectively bridged the satellite‐ and field‐based phenological measures for Budswell, Bud Burst, and Leaf Expansion events at the individual tree‐crown scale, particularly for large individuals. Bud Burst/Leaf‐out and early Leaf Expansion events were retrieved with highest accuracy. Diao et al. (2024), using a satellite‐field phenological bridging framework that excluded effects from understory, soil and snow, found that key spring stages, summarized at the community level, were detected with high accuracy.
Conclusions
5
This study confirms worldwide studies indicating that climate change is associated with a longer growing season of temperate deciduous forests. It qualifies that phenological stages, growth forms, and species differ in the extent of their responses. It contrasts with most phenological studies of temperate deciduous forest by being in North America, long‐term, community‐based, including multiple growth forms in a natural, mature forest, and including both spring and autumn events. Additionally, no study of a North American mature forest community shows that long‐term trends in phenology and weather predictors are parallel in spring (1993–2017) and autumn (1993–2021), thus strengthening the evidence of a connection between climate change and phenology. Unexpected differences in phenology between strata of woody species were found as understory species advanced in spring more than canopy species.
This study adds to limited prior studies showing an acceleration of leaf development during spring stages. It confirms that the lengthening of the growing season is due more to autumn delays than spring advances. The importance of legacy events of the current year in predicting some future events is shown, as well as unique functional traits associated with a species' phenology. The study provides long‐term phenological data from a new geographic region in North America.
The study contributes data on the canopy duration in a mature deciduous forest, a measurement so vital to models of carbon sequestration, forest productivity, and other ecosystem processes (Weiskopf et al. 2020). More studies are needed now to quantify the relative contribution of changes in spring versus autumn phenology to carbon sequestration. Additional questions can be addressed with the current data set, for example, extent of variation among individual plants in their phenological response to climate change (Marchand et al. 2020), inter‐annual comparisons of date versus rate of spring green‐up (Klosterman et al. 2018), influence on species synchrony of green‐up with rapid temperature increase (Wang et al. 2016), relationships among stages and extent and mechanism by which legacy events predict future events long‐term (Ettinger et al. 2018), and relative changes among species with different latitudinal distributions (Morin et al. 2007). Finally, the complexities of phenological responses among species point out the need to better understand genetic and physiological mechanisms underpinning each species' phenology, thermal sensitivity, and integration of events within and between seasons (Wilczek et al. 2010).
Author Contributions
Carol K. Augspurger: conceptualization (lead), data curation (lead), investigation (lead), methodology (lead), project administration (lead), writing – original draft (equal), writing – review and editing (equal). David N. Zaya: data curation (supporting), formal analysis (lead), validation (lead), visualization (lead), writing – original draft (equal), writing – review and editing (equal).
Conflicts of Interest
The authors declare no conflicts of interest.
The reference list from the paper itself. Each links out to its DOI / PubMed record.
- 1Archetti, M. , A. D. Richardson , J. O'Keefe , and N. Delpierre . 2013. “Predicting Climate Change Impacts on the Amount and Duration of Autumn Colors in a New England Forest.” P Lo S One 8: e 57373.23520468 10.1371/journal.pone.0057373 PMC 3592872 · doi ↗ · pubmed ↗
- 2Augspurger, C. K. 2004. “Development Versus Environmental Control of Early Leaf Phenology in Juvenile Ohio Buckeye ( Aesculus glabra ).” Canadian Journal of Botany 82: 31–36.
- 3Augspurger, C. K. 2008. “Early Spring Leaf out Enhances Growth and Survival of Saplings in a Temperate Deciduous Forest.” Oecologia 156: 281–286.18347817 10.1007/s 00442-008-1000-7 · doi ↗ · pubmed ↗
- 4Augspurger, C. K. 2009. “Spring 2007 Warmth and Frost: Phenology, Damage and Refoliation in a Temperate Deciduous Forest.” Functional Ecology 23: 1031–1039.
- 5Augspurger, C. K. 2011. “Frost Damage and Its Cascading Negative Effects on Aesculus glabra .” Plant Ecology 212: 1193–1203.
- 6Augspurger, C. K. 2013. “Reconstructing Patterns of Temperature, Phenology, and Frost Damage Over 124 Years: Spring Damage Risk Is Increasing.” Ecology 94: 41–50.23600239 10.1890/12-0200.1 · doi ↗ · pubmed ↗
- 7Augspurger, C. K. , and E. A. Bartlett . 2003. “Differences in Leaf Phenology Between Juvenile and Adult Trees in a Temperature Deciduous Forest.” Tree Physiology 23: 517–525.12730043 10.1093/treephys/23.8.517 · doi ↗ · pubmed ↗
- 8Augspurger, C. K. , J. M. Cheeseman , and C. F. Salk . 2005. “Light Gains and Physiological Capacity of Understory Woody Plants During Phenological Avoidance of Canopy Shade.” Functional Ecology 19: 537–546.