Investigating the Trend of Mortality, Life Expectancy and Excessive Death with Emphasis on the Role of the COVID-19 Pandemic Period in the Isfahan Province: A Cross-sectional Study of Join Point Regression Analysis 2011–2021
Maziyar Mollaei Pardeh, Mohammad Hossein Yarmohammadian, Habibollah Azarbakhsh, Golrokh Atighechian, Afshin Ebrahimi, Andishe Hamedi, Mohamad Reza Maracy

TL;DR
This study examines how mortality rates and life expectancy changed in Isfahan from 2011 to 2021, highlighting the significant impact of the COVID-19 pandemic.
Contribution
The study applies joinpoint regression to analyze mortality trends and emphasizes the role of the COVID-19 period in altering these trends.
Findings
Mortality rates increased significantly for both men and women during the COVID-19 period (2019–2021).
Life expectancy for both genders declined from 2011 to 2021, with a notable drop after the onset of the pandemic.
A significant decreasing trend in mortality was observed from 2011 to 2018 for men, but not for women.
Abstract
Comparing the trends of mortality rates provides valuable insight for policy discussions and promotes awareness of health issues. This study aimed to investigate the changes in mortality rate and life expectancy from 2011 to 2021 and the effect of COVID-19 period on these indices. We investigated the data of all-cause deaths between 2011 and 2021 by age group, sex and year using Excel spreadsheets from the National Organization for Civil Registration (NOCR), via collected the census method. Joinpoint regression was used to calculate the trend of mortality rate during the study period. During the study period, there were 262,708 deaths, of which 148,919 were men (56.68%). The trend of mortality rate in both sexes has been increasing. Life expectancy in men and women decreased from 76.71 and 80.82 in 2011 to 74.43 and 77.53 in 2021, respectively. From 2018 to 2021, there was a…
Genes, proteins, chemicals, diseases, species, mutations and cell lines named across the full text — each resolved to its canonical identifier and authoritative record.
Click any figure to enlarge with its caption.
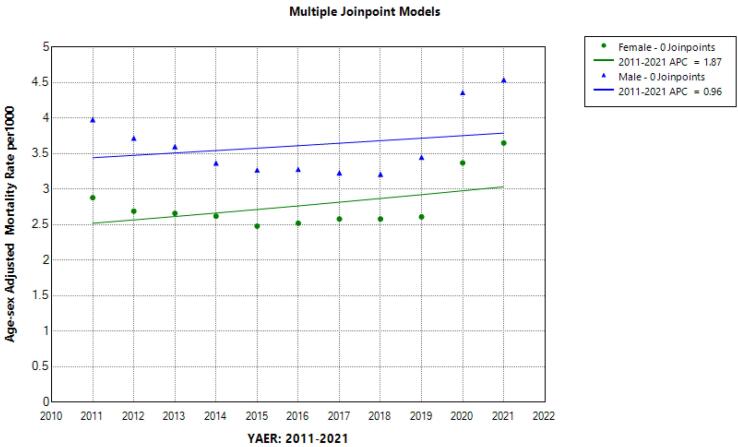 Figure 1
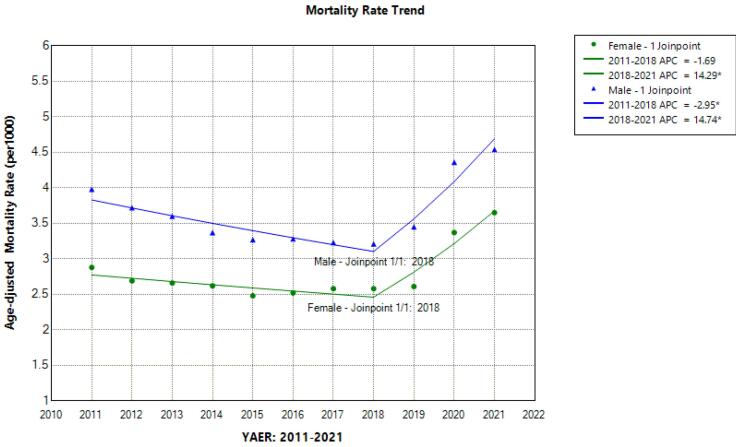 Figure 2
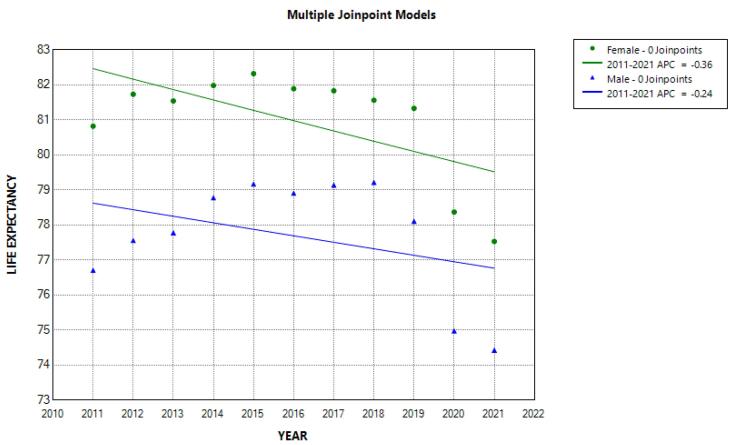 Figure 3
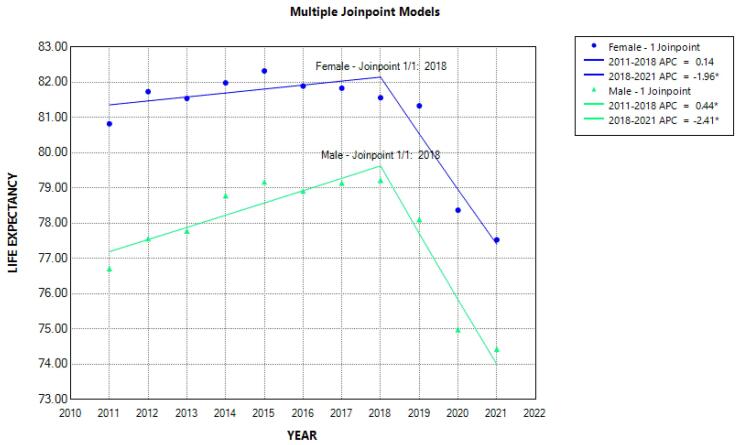 Figure 4
|
|
|
|
| |||||||||
|
|
| |||||||||||
|
|
|
|
|
|
|
|
|
|
|
|
| |
| 2011 | 2472023 | 2399685 | 4871708 | 12219 | 9217 | 21436 | 4.94 | 3.84 | 4.40 | 3.98 | 2.88 | 3.45 |
| 2012 | 2496770 | 2423306 | 4920076 | 11981 | 8785 | 20766 | 4.80 | 3.63 | 4.22 | 3.72 | 2.69 | 3.23 |
| 2013 | 2521582 | 2446999 | 4968581 | 12258 | 9143 | 21401 | 4.86 | 3.74 | 4.31 | 3.60 | 2.66 | 3.15 |
| 2014 | 2546259 | 2470561 | 5016820 | 11758 | 9054 | 20812 | 4.62 | 3.66 | 4.15 | 3.37 | 2.62 | 3.02 |
| 2015 | 2571070 | 2494251 | 5065321 | 11865 | 9017 | 20882 | 4.61 | 3.62 | 4.12 | 3.27 | 2.48 | 2.90 |
| 2016 | 2595818 | 2517879 | 5113697 | 12284 | 9431 | 21715 | 4.73 | 3.75 | 4.25 | 3.28 | 2.52 | 2.92 |
| 2017 | 2620629 | 2541570 | 5162199 | 12360 | 9675 | 22035 | 4.72 | 3.81 | 4.27 | 3.23 | 2.58 | 2.92 |
| 2018 | 2645309 | 2565129 | 5210438 | 12711 | 10070 | 22781 | 4.81 | 3.93 | 4.37 | 3.21 | 2.58 | 2.91 |
| 2019 | 2670122 | 2588819 | 5258941 | 13957 | 10470 | 24427 | 5.23 | 4.04 | 4.64 | 3.45 | 2.61 | 3.05 |
| 2020 | 2694863 | 2612446 | 5307309 | 18264 | 13863 | 32127 | 6.78 | 5.31 | 6.05 | 4.36 | 3.37 | 3.89 |
| 2021 | 2719677 | 2636139 | 5355816 | 19262 | 15064 | 34326 | 7.08 | 5.71 | 6.41 | 4.54 | 3.65 | 4.11 |
| Total | 28554122 | 27696784 | 56250906 | 148919 | 113789 | 262708 | 5.20 | 4.09 | 4.65 | 3.64 | 2.79 | 3.23 |
|
|
|
| ||||
|
|
|
|
|
|
| |
| Under 1 | 2801 | 3172 | 5973 | 4538 (3.65%) | 5809 (5.11%) | 11247 (4.28%) |
| 1-4 | 1217 | 1396 | 2613 | |||
| 5-9 | 743 | 717 | 1460 | |||
| 10-14 | 677 | 524 | 1201 | |||
| 15-19 | 2120 | 754 | 2874 | 16195 (10.88%) | 6239 (5.48%) | 22434 (8.54%) |
| 20-24 | 2760 | 923 | 3683 | |||
| 25-29 | 3407 | 1291 | 4698 | |||
| 30-34 | 3865 | 1567 | 5432 | |||
| 35-39 | 4043 | 1704 | 5747 | |||
| 40-44 | 4272 | 2032 | 6304 | 25396 (17.05%) | 12730 (11.19%) | 38126 (14.51%) |
| 45-49 | 5133 | 2615 | 7748 | |||
| 50-54 | 6920 | 3467 | 10387 | |||
| 55-59 | 9071 | 4616 | 13687 | |||
| 60-64 | 10950 | 6425 | 17375 | 101890 (68.42%) | 89011 (78.22%) | 190901 (72.67%) |
| 65-69 | 12278 | 8454 | 20732 | |||
| 70-74 | 13228 | 10916 | 24144 | |||
| 75-79 | 17423 | 14549 | 31972 | |||
| > 80 | 48011 | 48667 | 96678 | |||
| Total | 148919 (56.62%) | 113789 (43.32%) | 262708 | |||
|
|
|
|
|
| ||
|
|
|
|
|
| ||
| Adjusted mortality rate (all causes) | Male | 2011-2018 | -2.95 (-7.67, -0.84)* | 2018-2021 | 14.74 (5.73, 28.65)* | 2.05 (0.11, 3.34)* |
| Female | 2011-2018 | -1.69 (-8.61, 0.82) | 2018-2021 | 14.29 (4.67, 28.97)* | 2.85 (0.60, 4.43)* | |
| Crude mortality rate (all causes) | Male | 2011-2018 | -0.44 (-3.71,1.33) | 2018-2021 | 16.08 (8.61, 28.09)* | 4.25 (2.68, 5.39)* |
| Female | 2011-2018 | 0.23 (-2.35, 1.84) | 2018-2021 | 15.45 (9.11, 26.17)* | 4.57 (3.23,5.64)* | |
| Life expectancy | Male | 2011-2018 | 0.44 (0.11, 0.93)* | 2018-2021 | -2.41 (-4.22, -1.36)* | -0.42 (-0.73, -0.17)* |
| Female | 2011-2018 | 0.14 (-0.11, 0.52) | 2018-2021 | -1.96 (-3.31, -1.15)* | -0.5 (-0.73,-0.30)* | |
|
| |||
|
|
|
|
|
| 2011 | 76.71 | 80.82 | 78.69 |
| 2012 | 77.56 | 81.73 | 79.56 |
| 2013 | 77.78 | 81.54 | 79.58 |
| 2014 | 78.78 | 81.98 | 80.33 |
| 2015 | 79.17 | 82.32 | 80.69 |
| 2016 | 78.91 | 81.89 | 80.35 |
| 2017 | 79.14 | 81.83 | 80.45 |
| 2018 | 79.22 | 81.56 | 80.36 |
| 2019 | 78.11 | 81.33 | 79.71 |
| 2020 | 74.98 | 78.37 | 76.62 |
| 2021 | 74.43 | 77.53 | 75.94 |
Peer Reviews
No public reviews on file for this paper yet. If you reviewed it on a platform where reviews are public (OpenReview, ICLR, NeurIPS, ICML), you can paste yours below so the community can read it here.
Videos
No videos yet. Explain this paper in a talk, walkthrough, or lecture? Add one.
Taxonomy
TopicsHealthcare Systems and Reforms · Global Health Care Issues
Introduction
One of the key factors that needs to be taken into account in social planning is the size and traits of the population, as well as the way they have changed over time and are likely to change in the future.^1^
According to a World Health Organization report, the coronavirus was first reported in Wuhan, China, in December 2019, and quickly spread to all parts of the world, creating many economic, health, social and political problems.^2,3^ COVID-19 affects the respiratory, cardiovascular, neurological, and urinary systems. It can also cause long-term complications. Therefore, many post-infection deaths can be attributed to the infection. The COVID-19 pandemic has caused many deaths, leading to a decrease in life expectancy.^4,5^ The reported mortality rate from COVID-19 has ranged from less than one percent to 10%, which varied by underlying diseases, demographic differences, and testing strategy.^6^
Life expectancy at birth is the average number of years a newborn baby is expected to live if the current mortality rates continue. It is a useful indicator to reflect the overall mortality level of a population and summarizes the mortality pattern that exists across all age groups. Life expectancy is an important indicator reflecting various factors, including health programs, healthy and unhealthy behaviors of the general population, causes of death, literacy rates, and gross domestic product per capita. The World Bank calculates the Human Development Index on the basis of these three markers.^7^ In a study conducted in Brazil, based on the total number of deaths reported between 2019 and 2020, life expectancy in 2020 decreased by 1.31 years compared to 2019.^8^
Iran is currently in the third epidemiological transition,^9^ where the rate of death from infectious diseases is expected to decrease, while the rate of death from chronic diseases is expected to increase.^10^ A review of health and mortality indicators in Iran during the last half century shows that these indicators, including child and maternal mortality, as well as life expectancy at birth, have shown considerable improvement.^11^
Mortality reports reflect the leading causes of death and their risk factors. In addition, they are useful for determining the burden of disease in a community.^12^ Comparing the trend of mortality rates based on age, sex, and cause across different regions provides valuable insight for policy discussions and promotes awareness of health issues. The purpose of this study was to investigate the changes in mortality rate and life expectancy from 2011 to 2021 and the effect of COVID-19 pandemic on these indices in the Isfahan province.
Materials and Methods
Study Design and Setting
This population-based cross-sectional study analyzed all-cause mortality data from 2011 to 2021, categorized by age group, gender, year, and city of residence in Isfahan province, using a census approach. The National Organization for Civil Registration (NOCR), Ministry of Health and Medical Education (MOHME) and the statistical center of Iran (2) are reliable information sources for death statistics in Iran. In our study, the source of all-cause mortality data was Isfahan’s NOCR.
We calculated and reported the mid-year population, number of deaths, as well as the crude and age-sex standardized mortality rates (per 1000) during the study period. Additionally, trend analysis was performed using the Joinpoint regression program.
Data Collection
The statistical center of Iran provided the 2011 and 2016 census data used to gather demographic information categorized by sex and age groups. Population data was recorded using Excel 2016. Since only the 2011 and 2016 census data were available for estimating populations in other years, the Population Analysis Spreadsheets (PAS) software was employed. Additionally, the total number of deaths categorized by age group, sex, city of residence, and year (from 2011 to 2021) was obtained from the NOCR of the Isfahan Province via the census method.
Participants
The inclusion criteria involved all deaths from any cause that occurred in each calendar year within the Isfahan province, regardless of the registration date. Exclusion criteria were deaths with an unknown age group, deaths that occurred before 2011 but were registered after that year, and deaths of individuals who resided outside the Isfahan province.
Statistical Analysis
Descriptive analyses were conducted and the results were presented as numbers and percentages. Afterwards, crude and age-sex standardized mortality rates in the different years of the study as well as life expectancy were calculated.
We used the direct standardization method to account for the impact of age structure on mortality rates. Specifically, it employs the 2013 standard population from the International Network for the Demographic Evaluation of Populations and Their Health (INDEPTH). This method is important because it allows for a more accurate comparison of mortality rates across different populations by controlling for age-related variations, thereby providing insights that are not skewed by age distribution differences.
PAS was used for estimating life expectancy. This spreadsheet calculates a life table from deaths and population in term of age and has an option for using an independently calculated or estimated infant mortality rate that we calculated in this study. It also produces a life table based on age-specific central death rate (mx) values smoothed by a moving average of the logarithms. The formula for calculating life expectancy is as follows: ex = TX/lx, where ex is life expectancy at age x, Tx is the number of person-years lived after age x, and lx is the number of survivors at age x.
Joinpoint regression is a statistical method used to identify trends in mortality rates by partitioning an independent variable into intervals and fitting separate line segments to each interval. The points where the segments meet are referred to as joinpoints. To determine the optimal joinpoints, our analysis employed the Bayesian Information Criterion (BIC) and assessed significant changes in the linear slope of the trend. The analysis began with a minimum threshold of zero, representing a straightforward linear trend. Given the limited number of observed data points (0-11), the study restricted the maximum number of joinpoints for statistical testing to one. BIC was estimated to identify the best-fitting model for the data during the study period^13^ as:
where SSE is the sum of squared errors of the k-joinpoint regression model, n is the number of observations and 2(k + 1) is the number of parameters in the model.
Also, annual percentage changes (APC) and average annual percentage changes (AAPC) were applied to compare the decreasing /increasing trend of mortality rates. To estimate the APC and AAPC, the following regression model was used:
APCi = {exp (Bi)-1} × 100 and for AAPC = {exp ((∑WiBi)/(∑Wi)-1)} × 100
where Bi is the slope coefficient for the ith segment with i indexing the segments in the desired range of years, and Wi indicates the length of each segment in the range of years.^14^
The trend analysis was done using the joinpoint regression program version 5.0.2 (Statistical Research and Applications Branch, National Cancer Institute).
Results
During the study period, there were 262 708 deaths (all causes), of which 148 919 were men (56.68%) and 113 789 were women (43.32%). The average age-sex standardized mortality rate per 1000 was 3.23 for both sexes, 3.64 for men and 2.79 for women. The average crude mortality rate per 1000 was 4.65 for both sexes, 5.20 for men and 4.09 for women. The highest number of deaths and the age-sex standardized mortality rate, with a huge difference compared to other years, were related to 2021 with 34 326 deaths (4.11 per 1000) and 2020 with 32,127 deaths (3.65 per 1000) (Table 1). In terms of age, it is worth noting that 72.67% of all deaths were among individuals who were 60 years old and above. This percentage was higher for women (78.22%) than men (68.42%) (Table 2).
Mortality Trend
The trend of the mortality rate from 2011 to 2021 is shown in Figure 1. The results of the regression analysis of the age-sex standardized mortality rate showed a similar join point in men and women (year 2018) and there were two segments related to 2011-2018 (Segment 1) and 2018-2021 (Segment 2). Accordingly, the APC of the age-standardized mortality rate in both men and women in the first segment has been decreasing from 2011 to 2018; although this decrease was not statistically significant in women, the yearly 2.65% decreasing trend in men was statistically significant (APC male = -2.95, 95% CI = -7.67, -0.84). However, from 2018 to 2021, which is considered as the second segment, there was a sudden, sharp and significant increase in the age-sex standardized mortality rate in both men (APC = 14.74; 95% CI = 5.73; 28.65) and women (APC = 14.29; 95% CI = 4.67; 28.97) (Figure 2). This sharp increase in Segment 2, despite the decrease in the percentage of annual changes in the first segment, caused the AAPC of the age-standardized mortality rate from 2011 to 2021 in men (AAPC male = 2.05; 95% CI = 0.11; 3.34) and in women (AAPC female = 2.85; 95% CI = 0.60; 4.43) to be positive and significant (Table 3).
**
**
Life Expectancy
The trend of life expectancy of men and women from 2011 to 2021 is shown in Table 4 and Figure 3. Life expectancy in men and women decreased from 76.71 and 80.82 in 2011 to 74.43 and 77.53, respectively in 2021 (not significant). In order to further investigate the trend of life expectancy, using the join point regression analysis, one joint point was found, similar to the analysis of the mortality trend (year 2018), which caused the creation of two segments (2011-2018 and 2018-2021).
**
Join point regression analysis showed that from 2011 to 2018, the trend of APC of life expectancy in men was increasing and significant (APC male = 0.44; 95% CI = 0.11; 0.93). However, from 2018 to 2021, it was noticeably and significantly reduced in both men and women. Thus, the percentage of annual changes in life expectancy during these years decreased by 2.41 in men and 1.96 in women (Figure 4). For this reason, the AAPC in life expectancy from 2011 to 2021 was decreased in men (AAPC male = -0.42; 95% CI = -0.73; -0.17) and in women (AAPC female = -0.50; 95% CI = -0.73; -0.30) (Table 3).
**
Discussion
The study showed how the trend of mortality and life expectancy in Isfahan was affected by the COVID-19 pandemic between 2011-2021. The trend of mortality and life expectancy during 2018-2021 has deviated from the normal trend before COVID-19. The age-standardized mortality rates in both men and women declined from 2011 to 2018, but from 2018 to 2021, there was a sudden, sharp and significant increase in standardized age-sex mortality in both sexes. Also, from 2011 to 2018, the percentage of annual change in life expectancy (APC) in men increased significantly, but from 2018 to 2021, life expectancy decreased significantly in both men and women. The percentage of annual changes in life expectancy during these years decreased by 2.41 years in men and 1.96 years in women. A study conducted by Razeghi Nasrabad and Sasanipour found that deaths from COVID-19 reduced life expectancy by 1.4 years in 2020.^2^ A study conducted by Yayla Enfiyeci and Çavlin, titled “Trends in life inequality and life expectancy in Türkiye before and during the Corona period,” showed that during COVID-19, men experienced a greater decline in life expectancy than women in youth and adulthood. In contrast, women experienced a higher mortality rate in old age than men, which is consistent with our study.^15^ Also, in a study conducted by Cao et al in 2023, the results showed that global life expectancy at birth decreased from 72.8 years in 2019 to 71.0 years in 2021, reflecting an annual decline of 1.2% during the period of COVID-19 from 2019 to 2021. This decline occurred despite the overall increasing trend observed from 1990 to 2021.^16^ In a study examining the impacts of the COVID-19 pandemic on life expectancy at birth in Asia, the results showed that the pandemic shortened life expectancy at birth by 1.66 years from 2019 to 2021, slightly less than the global average of 1.74 years. Oman, Lebanon, India, Armenia, Azerbaijan, Indonesia, and the Philippines experienced losses of over 2.5 years in life expectancy at birth. The decline in Asia was primarily observed in the 60–79 age group like this study, followed by the 80 + and 45–59 age groups, while the younger age groups (0–4 and 5–14 years) contributed little to the overall decline. Men suffered more deaths than women during the pandemic. Asian countries experienced fewer losses in the second year of the pandemic (2020–2021) compared to the first year (2019–2020).^17^ A study examining the impact of COVID-19 on life expectancy by Marois et al in 2023 found that a 50% prevalence of COVID-19 infections would reduce life expectancy by 3 to 9 years in North America and Europe, 3 to 8 years in Latin America and the Caribbean, 2 to 7 years in Southeast Asia, and 1 to 4 years in sub-Saharan Africa.^18^ Other studies showed that the coronavirus pandemic reduced life expectancy by 1.13 years in the United States^19^ and by 1.94 years in Brazil.^20^ In Japan, life expectancy increased by 2020 and decreased by 0.15 from 2020 to 2021. The change suggests a possible negative impact of COVID-19 on life expectancy. The study also found that a relatively small increase in the COVID-19 pandemic resulted in a significant impact on mortality rates and that there was a negative correlation between changes in life expectancy and mortality rates.^9^ Changes in mortality and life expectancy trends in the post-COVID-19 era may be influenced not only by health factors but also by economic conditions. One study found that severe economic downturns caused by COVID-19 led to increased mortality and decreased life expectancy. Additionally, the unemployment shock resulting from COVID-19 had long-term effects on mortality rates and life expectancy. Unemployment stemming from the economic crisis can lead to increased mortality due to lack of access to preventive health care and changes in lifestyle.^21^ Considering that the age structure of populations is different and the age structure of Iran’s population is middle-aged, the results of the present study are not comparable with studies in other regions or countries. We also observed significant heterogeneities in mortality rates based on age and sex. According to this study, from 2011 to 2021, 262,708 deaths occurred (due to all causes). The mean age-sex mortality rate was 3.64 in men and 2.79 per 1000 for women. In terms of age, 72.67% of all deaths pertained to people aged 60 years and above. The highest number of deaths and standardized age-sex mortality rates by years were in 2020 and 2021 with a very large difference compared to other years. A study conducted by Ghafari under the prevailing additional deaths related to the COVID-19 epidemic in Iran showed an 8% increase in mortality rates at the beginning of the COVID-19 outbreak and the average of additional deaths across the country increased due to the fact that the epidemic was never fully controlled.^22^ Therefore, additional deaths during 2020 and 2021 can be linked to the COVID-19 epidemic. In a 2018 study conducted in Tehran, the prevalence of mortality in men and women before COVID-19 was reported at 56.7% and 43.3%, respectively. The prevalence of COVID-19 was 61.5% in men and 38.5% in women, respectively. Overall, mortality rates in men were higher than women in both pre- and post-pandemic periods, and the prevalence of mortality in age groups aged 50 and above showed a significant increase, which confirms the findings of the present study.^23^ While the crude mortality rate in Turkey remained stable from 2017 to 2019, a significant increase has been observed since 2020, attributed to the impact of the COVID-19 pandemic. Similar to our study, the result of this study showed that the crude mortality rate was higher among those aged 65 years and above.^24^ The pattern of infection and death rates during the COVID-19 pandemic has varied significantly across countries. Surprisingly, wealthier countries with more healthcare resources have experienced higher death rates than less affluent countries like India and other Southeast Asian nations. This may be attributed to better registration and follow-up care programs in these wealthier countries.^25^ The results of the 2016-2020 analysis using data on all deaths among Latinos in California found that in the first seven months of the pandemic, there were 10,316 more deaths among Californian Latinos compared to trends four years earlier: a relative increase of more than 31%. The results also showed that the effects of the pandemic on mortality were far worse for Latinos born in Mexico and Central American countries than for Latinos born in the United States. The difference was worse among those aged 55 to 74. This finding shows the impact of population age structure and vulnerability to death from COVID-19. Among foreign Latinos, men had more additional deaths than women.^26^ A study conducted in tFrance by Fouillet et al in 2020 found that 14 weeks after the onset of COVID-19, the estimated number of deaths was 60% higher than expected, and the estimated number of deaths was 16.6% above the baseline level for the whole of France. Also, the probability of death was significantly higher in men and in the group aged above 65 years.^27^ In Italy, a review of all-cause mortality data from 2015 to 2020 showed that the COVID-19 pandemic was linked to an increase in all-cause mortality rates. This phenomenon has also been observed in other European countries, such as Spain, Britain, Belgium, the Netherlands, and Sweden.^28,29^ Increasing mortality rates, especially in vulnerable groups such as the elderly, lead to major disruptions in human development in countries. On the other hand, the devastating social and economic effects of COVID-19 on human life further reduce life expectancy. Countries whose age structures are aging rapidly, including Iran, are among the most vulnerable to infectious epidemics such as COVID-19.
The main strength of this study is the availability of data from several years before the pandemic, which allows us to estimate trends in mortality and life expectancy during an epidemic and compare it to deaths during similar non-pandemic periods. It also provides an effective way to study the impact of individual and social factors on additional mortality. However, this study also has limitations. We examined death due to all causes, and changes in life expectancy based on the leading causes of death were not investigated. Socio-economic inequalities can also have a significant impact on the pattern of mortality and life expectancy which were not addressed in this study. The causes of an increase in mortality rates during 2018-2021, such as failure to comply with health protocols, reopening recreational, sports and educational venues, etc., were not investigated. Lack of access to death data from COVID-19 is the most important limitation of this study.
Conclusion
Based on the results from this study, from 2011 until before COVID-19, the trend of mortality was decreasing and life expectancy was increasing, but with the emergence of the COVID-19 epidemic in 2019, this trend changed completely with additional deaths as a result of decreasing life expectancy. Therefore, prevention, control and treatment of epidemic diseases should be a serious concern of policy makers.
The reference list from the paper itself. Each links out to its DOI / PubMed record.
- 1World Health Organization (WHO). Tobacco—Key Facts. Geneva: WHO; 2023. Available from: https://www.who.int/news-room/fact-sheets/detail/tobacco.
- 2Razeghi Nasrabad HB Sasanipour M Effect of COVID-19 epidemic on life expectancy and years of life lost in Iran: a secondary data analysis Iran J Med Sci 2022473210810.30476/ijms.2021.90269.211135634521 PMC 9126904 · doi ↗ · pubmed ↗
- 3Moftakhar L Piraee E Mohammadi Abnavi M Moftakhar P Azarbakhsh H Valipour A Epidemiological features and predictors of mortality in patients with COVID-19 with and without underlying hypertension Int J Hypertens 20212021742750010.1155/2021/742750034676114 PMC 8526257 · doi ↗ · pubmed ↗
- 4Schöley J Aburto JM Kashnitsky I Kniffka MS Zhang L Jaadla H Life expectancy changes since COVID-19Nat Hum Behav 202261216495910.1038/s 41562-022-01450-336253520 PMC 9755047 · doi ↗ · pubmed ↗
- 5Zakeri M Mirahmadizadeh A Azarbakhsh H Dehghani SS Janfada M Moradian MJ Excess deaths during the COVID-19 pandemic in southern Iran: estimating the absolute count and relative risk using ecological data J Prev Med Public Health 2024572120710.3961/jpmph.23.19838374708 PMC 10999301 · doi ↗ · pubmed ↗
- 6Banerjee A Pasea L Harris S Gonzalez-Izquierdo A Torralbo A Shallcross L Estimating excess 1-year mortality associated with the COVID-19 pandemic according to underlying conditions and age: a population-based cohort study Lancet 20203951023817152510.1016/s 0140-6736(20)30854-032405103 PMC 7217641 · doi ↗ · pubmed ↗
- 7Mahdian M Sehat M Fazel MR Rahimi H Mohammadzadeh M Life expectancy at birth in Aran-Bidgol region, Iran, 2012: a study based on corrected Health Houses data Int J Epidemiol Res 20163325967
- 8Castro MC Gurzenda S Turra CM Kim S Andrasfay T Goldman N Reduction in life expectancy in Brazil after COVID-19Nat Med 202127916293510.1038/s 41591-021-01437-z 34188224 PMC 8446334 · doi ↗ · pubmed ↗