Paired mutation calling and spatial transcriptomics identify cellular neighbourhoods dictating the neoplastic outcome of colitis
E. B. Moutin, L. Chang, G. Giavara, S. Mehmed, M. Colombé, F. C. Lourenço, M.N. Skoufou-Papoutsaki, R. Kemp, P. Gascard, T. Tlsty, D.S. Tourigny, D.J. Winton

TL;DR
This study explores how the cellular environment influences the development of cancer in colitis by combining various techniques in a mouse model.
Contribution
The study introduces a model linking tissue environment to tumor initiation through the selection of pro-oncogenic clones.
Findings
Epithelial- and immune-enriched neighborhoods were identified in colitis-associated tumorigenesis.
A reparative tissue environment promotes the selection and expansion of pro-oncogenic clones.
Inflammation-resistant neighborhoods containing non-oncogenic clones are reduced in this process.
Abstract
In the progression from Inflammatory Bowel Disease to associated cancer, the clonal mutational landscape shifts from selection of mutations in inflammatory genes to selection of cancer-driver mutations1–4. How prevalence and expansion of either type of mutated clones could be impacted by the cellular environment in which they arise, and how this affects the neoplastic outcome of colitis is unknown. Here, we combine in vivo lineage tracing, in-silico modelling, mutational profiling and spatial transcriptomics in a mouse model of colitis-associated tumorigenesis to capture clone fates associated with chronic inflammation. We identify epithelial- and immune-enriched neighbourhoods and propose a model in which establishment of a reparative tissue environment facilitates tumours initiation by promoting the selection and expansion of pro-oncogenic clones, reducing the span of…
Genes, proteins, chemicals, diseases, species, mutations and cell lines named across the full text — each resolved to its canonical identifier and authoritative record.
Click any figure to enlarge with its caption.
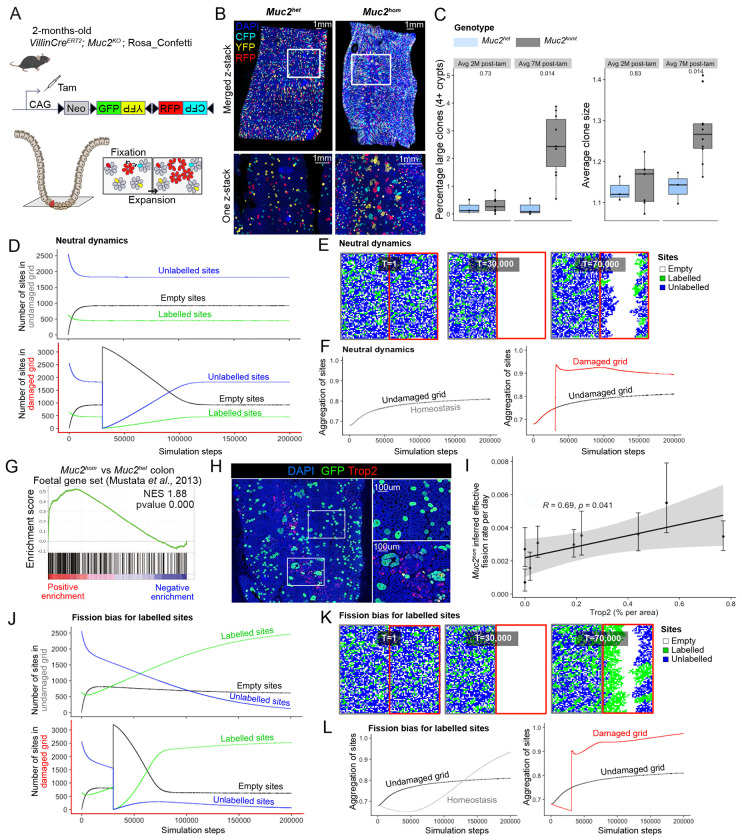 Figure 1
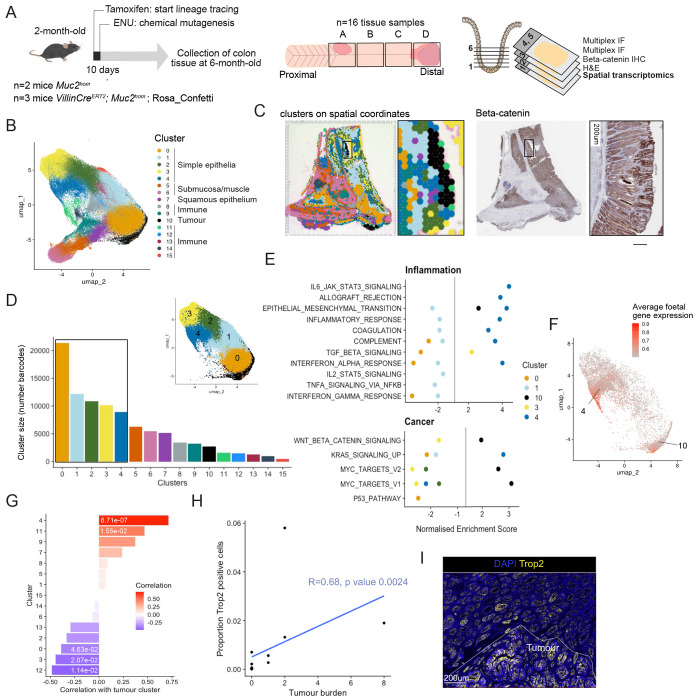 Figure 2
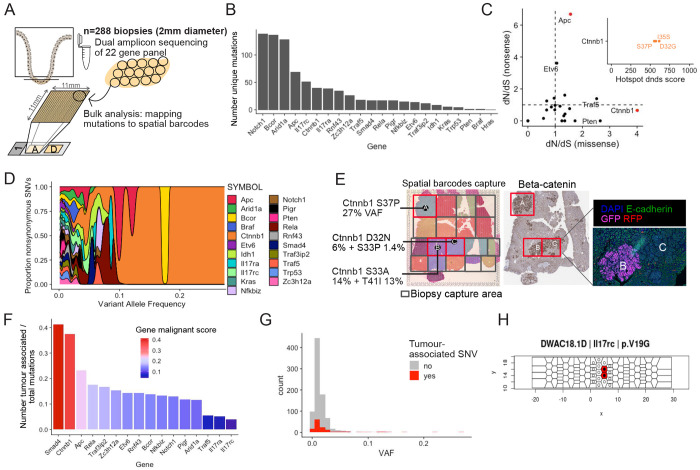 Figure 3
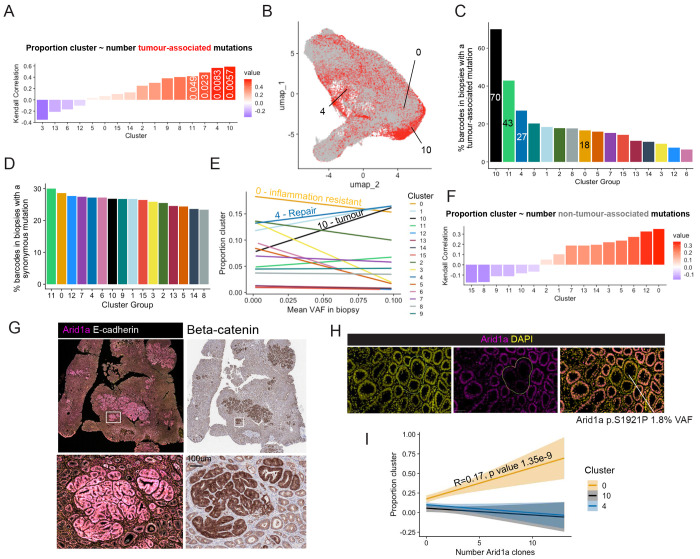 Figure 4
Peer Reviews
No public reviews on file for this paper yet. If you reviewed it on a platform where reviews are public (OpenReview, ICLR, NeurIPS, ICML), you can paste yours below so the community can read it here.
Videos
No videos yet. Explain this paper in a talk, walkthrough, or lecture? Add one.
Taxonomy
TopicsInflammatory Bowel Disease
INTRODUCTION
Inflammatory Bowel Disease (IBD) affects seven million people worldwide and is associated with many co-morbidities, including the development of colitis-associated-cancer (CAC)^5^. During the progression of IBD, mutations affecting genes implicated in mounting an inflammatory response – including those of the IL17 and NF-KB pathways – are under positive selection in the colonic epithelium^1–3^. Clones bearing such mutations exhibit an increased capacity to survive and expand in colonic tissue, which has been linked with resistance to inflammatory insult. In contrast, tumours arising in the context of IBD show reduced prevalence of inflammation-resistant mutations, suggesting a protective role against cancer that could explain why most patients are only diagnosed with colorectal neoplasia more than a decade after their initial IBD diagnosis^6,7^. How selection of inflammation-resistant clones is influenced by the environment in which they arise and how this affects the balance between IBD pathogenesis and neoplastic transformation has not yet been defined, in part due to a lack of model systems.
Using lineage tracing to profile clone dynamics in the well-characterised Muc2^KO^ model of colitis^8–10^, we observe discrete regions in which clonal expansion is favoured. In-silico modelling of clone dynamics and inference of effective fission rate identifies tissue repair as the process driving neutral clonal expansion through increased crypt fission. The impact of expansion of mutated clones in this context was studied using targeted amplicon sequencing after chemical mutagen treatment of Muc2^KO^ mice. Importantly, clones bearing mutations found in human IBD and associated cancer were captured. Paired spatial transcriptomics defined the function of such mutated clones in a chronically inflamed context and captured the information necessary to define cellular neighbourhoods within which these clones preferably expand, dictating the neoplastic outcome.
RESULTS
Lineage tracing captures increased clonal expansion in colitis
Depletion of the intestinal mucus barrier due to constitutive knockout of both alleles of the Muc2 gene leads to chronic inflammation restricted to the mouse colon^11^. As previously described by us and others, this model recapitulates the pathology seen in patients suffering from Inflammatory Bowel Disease (IBD) ^9,10^, including the development of epithelial dysplasia and emergence of invasive foci with age (Supplementary Fig.1). To observe clonal fates in the colonic epithelium accompanying disease progression in this model, Cre-mediated activation of the Confetti lineage-tracing cassette was performed by tamoxifen treatment of mice containing inter-crossed R26^Confetti^ and VillinCre^ERt2^ alleles^12^ on a Muc2^KO^ background (Fig. 1a). Large clones could be observed in discrete areas of the Muc2^hom^ mouse colon (Fig. 1b). Quantification of clone sizes at 7-months post tamoxifen injection revealed a significant increase in average clone size and number of large clones in the colonic epithelium of Muc2^hom^ mice compared to control Muc2^het^ mice, two phenotypes that were not apparent at 2 months post tamoxifen injection (Fig. 1c). This indicates a clear relationship between duration of inflammation and clonal expansion.
Increased crypt fission drives reparative neutral clonal expansion
An in-silico model was developed to explore how discrete neighbourhoods containing clonal expansions might arise due to inflammatory injury. A square lattice was created to represent a colon segment cut longitudinally. The lattice was randomly populated with 80% unlabelled and 20% labelled sites (representing crypts) and evolved forward in time in a sequence of steps allowing the transition of sites between three possible states: empty, unlabelled or labelled. Transitions are constrained by the probability of clone fixation, crypt fission, and crypt fusion (Methods and Supplementary Note), all neutral in homeostasis ^13,14^.
After an initial transient state, the number of empty sites reached a plateau, considered here as homeostasis (Fig. 1d). To replicate the effects of acute damage, the entire right-half of the lattice was emptied shortly after reaching homeostasis, and sites from the left-hand grid allowed to repopulate the damaged grid (Fig. 1e). Of note, the damaged grid may be repopulated from both sides as it is a 2D representation of the cylindric shape of the colon. To capture the clonal expansion seen in vivo, we derived a metric quantifying aggregation of either labelled or unlabelled sites (Methods). Increased aggregation was seen in the right-hand grid post-damage, and persisted after homeostasis was reached (Fig. 1f), supportingthat repair after damage is achieved by neutral expansion of clones in proximity to injury.
To identify markers associating with epithelial repair, transcriptional profiles of Muc2^hom^ mouse colons were derived. Previous observations in the Dextran Sulphate Sodium (DSS) colitis model have identified a foetal gene signature characteristic of the repairing epithelium^15^. Enrichment for this signature was confirmed in the Muc2^hom^ model by gene set enrichment analysis (GSEA) (Fig. 1g). Immunodetection revealed presence of large clones in regions where the foetal marker Trop2 (Tacstd2) is expressed (Fig. 1h). Estimates of effective crypt fission rates showed a significant positive correlation to extent of Trop2 expression within the region profiled (Fig. 1i). Together, these results establish repairing areas of the mouse colonic epithelium as environments where clonal expansion through crypt fission is favoured. Notably, the restriction of this response to the damaged area reflects the localised pathology observed in Ulcerative Colitis patients.
Tissue repair conditions favour fission-biased clones
Mutations in cancer-driving genes such as Kras have been shown to confer a large fission bias to mutant clones^16^. To study the potential impact of such biases on expansion in tissue repair conditions, in-silico simulations were adapted to give a fission advantage to labelled sites (fission probability = 0.95 for labelled sites versus 0.5 for unlabelled sites). This led to faster repair of the damaged right grid (T=80,000 simulation steps with fission advantage versus 115,315 without) (Fig. 1d, j), with fission-biased sites consistently outcompeting wild-type sites in both damaged and non-damaged grids (Fig. 1j, k). This was linked to a stable increase in aggregation of sites on both sides of the lattice, that was, importantly, more pronounced in the damaged side (Fig. 1l). This highlights how tissue repair conditions can accelerate and promote the accumulation and expansion of mutant clones in damaged tissue.
Approach for combined profiling of mutations and cellular context in colitis-associated-cancer
To model a context in which mutated clones expand in chronically inflamed tissue, Muc2^hom^ mice were treated with the chemical mutagen N-ethyl-N-nitrosourea (ENU). This alkylating agent has been shown by us and others to trigger tumour initiation in primed contexts^17,18^. Upon ENU treatment, tumours arise in the colon of Muc2^hom^, but not Muc2^het^ mice (Supplementary Fig.1b), resulting in reduced survival in the former (Supplementary Fig.1c). These tumours arise as flat dysplastic lesions, phenocopying colitis-associated-cancer (Supplementary Fig. 1d). Notably, tumours express Notum and Reg4, that have been documented as markers of Wnt pathway activation and colitis-associated-cancer, respectively^19,20^. To determine how expansion of specific mutated clones is influenced by the environment in which they arise, an experimental approach was designed that would allow spatially resolved molecular characterisation of cellular neighbourhood and of the selected gene specific mutations (Supplementary Fig. 2).
Identification of cellular neighbourhoods in colitis-associated neoplasia
First, to identify the cellular neighbourhoods present in chronic inflammation and associated neoplasia, we made use of the 10x Genomics Visium spatial transcriptomics protocol. Gene expression data was obtained from crypt-sized barcoded spots covering sixteen tissue samples from proximal and distal regions of the Muc2^hom^ mouse colon, which typically show the most advanced pathology^10^ (Fig. 2a). Gene expression data for all slides was integrated prior to unsupervised clustering and UMAP reduction (Supplementary Fig. 3a). Sixteen phenotypic clusters were identified and marker genes for each were found using differential gene expression analysis (Fig. 2b, Supplementary Fig. 3, Supplementary Table 1, Methods). Mapping spatial barcodes within each cluster to their spatial coordinates in tissue samples revealed that most clusters formed contiguous neighbourhoods (Supplementary Fig. 4a).
Several discrete clusters express immune cell markers, such as the B cell marker Cd19 ^21^ in cluster 14 or the neutrophil marker S100a9^22^ in cluster 11, indicating that they represent immune-enriched neighbourhoods (Supplementary Fig. 3b, c). Similarly, expression patterns of keratins were used to further inform the identity of intestinal epithelial neighbourhoods^23,24^ (Supplementary Fig. 3d). Widespread expression of keratin 8 indicates good epithelial representation across the dataset, with a gradient of keratin 20 suggesting higher colonocyte differentiation in clusters 2, 3 and 4 compared to clusters 0 and 1. Clusters 5 and 6 show abundant expression of tropomyosin, myopodin and actin, indicating that these neighbourhoods mainly comprise muscle cells. Keratin 14 is concentrated in cluster 7 and overlays squamous epithelium (Supplementary Fig. 3e). Cluster 10 shows high keratin 7 and low keratin 20 expression. Notably, keratin 7 is not expressed in healthy colonic epithelium but has been found elevated in IBD patients^25^, whilst low expression of keratin 20 indicates poor colonocyte differentiation. These observations, as well as β-catenin immunohistochemistry showing elevated nuclear β-catenin overlaying this cluster, identify it conclusively as the tumour cluster (Fig. 2c).
Biological processes defining epithelial neigbhourhoods
To explore the biologically pathways active in the largest epithelial clusters and the tumour cluster, we performed GSEA using MSigDB hallmark pathways (Fig. 2d). Of note, genes were ranked based on differential gene expression in each cluster compared to all other clusters. As expected, the tumour cluster (cluster 10) showed enrichment for the Wnt and Myc pathways, as well as epithelial to mesenchymal transition (Fig. 2e). Markers for this cluster include Mmp7 and Lyz1, two genes normally associated with Paneth cells in a Wnt-high location in small intestinal crypts^26,27^ (Supplementary Fig. 3f, g). Interestingly, many genes marking the tumour cluster are related to the extracellular matrix (Supplementary Table 1), which has been described as a feature of nascent tumours^28^, indicating that we may be capturing early stages of neoplasia.
The five non-tumour simple epithelial neighbourhoods show varied responses to inflammation. Cluster 3 shows positive enrichment for TGFβ signalling and cluster 4 shows enrichment for many inflammatory pathways including interferon alpha (IFNα) as compared to other clusters. Cluster 4 also shows enrichment for coagulation markers, suggesting it might correspond to repairing epithelium. Accordingly, the average expression of foetal genes is higher in spots for which spatial barcodes map to cluster 4 (Fig. 2f). These results define cluster 4 as the neighbourhood associated with epithelial repair, and as the epithelial neighbourhood most responsive to inflammatory cues.
Clusters 0 and 1 show a drastically different response, with negative enrichment for many inflammation-related pathways such as interferon signalling, suggesting that cells in this neighbourhood are less responsive to immune activation (Fig. 2d). Interestingly, loss of function mutations in the gene Nox1, one of the top markers of cluster 0, has been described in several cases of very early onset IBD. Upregulation of this gene in cluster 0 could reflect a mechanism to prevent excessive inflammation.
Evolution of cellular neighbourhoods with neoplasia
Cellular neighbourhoods evolve with the progression of disease, either shrinking or growing to occupy more of the tissue. To determine the dynamics of neighbourhoods that create an environment supporting tumour growth, we calculated the correlation between the proportion of spatial barcodes mapped to the tumour cluster within each tissue sample (coverage by the tumour cluster) and the coverage by each of the other clusters (Fig. 2g). The strongest positive correlation was seen between coverage with the tumour cluster and the tissue repair cluster 4 (R=0.71, p value 6.71e-05) (Fig. 2g), indicating a potential functional relationship between the establishment of a tissue repair environment and tumour formation. Accordingly, using immunofluorescence for the marker of tissue repair Trop2, we found a positive correlation between the proportion of Trop2 positive cells in a tissue sample and tumour burden (R=0.68, p value 0.0024) (Fig. 2h, i). Interestingly, both the tumour cluster 10 and tissue repair cluster 4 are co-occurring with the neutrophil cluster 11 (Cluster 10—11, R=0.47, p value 1.55e-02; Cluster 10—4, R=0.68 p value 2e-04) (Fig. 2g, Supplementary Fig. 4b). Neutrophil binding to ICAM-1 on epithelial cells was shown to trigger proliferation via Akt and β-catenin signalling^29^. In this context, it could enhance wound healing but could also drive Wnt-dependant neoplasia.
This analysis also revealed negative correlation between coverage of some clusters with the tumour cluster, indicating that those cellular neighbourhoods are shrinking with progression of neoplasia. This is the case for epithelial clusters 3 (Fig. 2g) (R=−0.45, p value 2.07e-02), which shows negative enrichment for the Myc pathway (Fig. 2e) and likely represents a healthy epithelial state. It is also the case for cluster 12 which is identified by the Iglc3 marker of plasma cells^30^ (R= 0.49, p value 1.14e-02). Infiltration with B and plasma cells has been associated with lower tumour stages and improved overall survival^31^. Interestingly, coverage by cluster 0 was also negatively correlated with coverage by the tumour cluster (Fig. 2g) (R=−0.39 p value 4.63e-02). This cluster corresponds to a cellular neighbourhood with dampened response to inflammation (Fig. 2e). Overall, this analysis revealed the dynamics of cellular neighbourhoods in the progression of disease, with response to inflammatory cues dictating association with neoplasia.
Detection of mutations in known IBD and CAC genes
To determine whether the accumulation and expansion of mutations found in human IBD and associated cancer is linked with specific epithelial neighbourhoods, we profiled the mutational landscape in the colonic epithelium of the same cohort of Muc2^KO^ mice treated with ENU. Colon tissue directly overlaying the sections used for spatial transcriptomics and immunofluorescence profiling was extensively sub-sampled in a series of 2mm diameter biopsies (Fig. 3a). Replicate targeted-amplicon sequencing for 22 genes commonly found mutated in IBD and/or CAC (Supplementary Table 2) was applied to each of the 288 biopsies. To correctly assign mutations as clonal events, spatial coordinates were used to detect adjacent biopsies with the same mutation (Supplementary Fig. 5 and Methods). Single Nucleotide Variants (SNVs) were detected in all genes covered, including known CAC drivers Trp53, Kras and Smad4^4^, but also several genes associated with the IL-17 pathway (Il17rc, Il17ra, Pigr) and chromatin remodellers Arid1a and Bcor commonly found mutated in the non-dysplastic colonic epithelium of IBD patients^1–3^ (Fig. 3b, Supplementary Table 3).
Analysis of dN/dS ratios identified Ctnnb1 and Apc as genes under significant positive selection for missense and nonsense mutations, respectively (Fig. 3c). This selection is also reflected in the variant allele frequencies (VAFs) reached by Ctnnb1 mutations, which dominate the SNV landscape above 10% VAF (fig. 3d). Such mutations could be mapped to tumours with elevated nuclear β-catenin staining, with VAFs reaching up to 27% in a single biopsy (Fig. 3e). Together, this suggests a dependence on Wnt signalling for tumour growth.
Paired transcriptional profiling and mutation calling identifies tumour-associated mutations
To define the potential for each mutation to drive malignant transformation in the model, we leveraged transcriptomic information obtained from the overlying tissue samples by extracting spatial barcodes corresponding to each biopsy to enable a pseudo-bulk analysis (Supplementary Fig. 2, Fig. 3a). The proportion of spatial barcodes mapping to each epithelial cluster was obtained for the 232 biopsies captured in the Visium experiment. Tumour-associated mutations were defined as any non-synonymous SNV detected in a biopsy containing at least 5 spatial barcodes mapping to the tumour cluster (Supplementary Fig. 6a, Supplementary Table 4).
The proportion of tumour-associated to total non-synonymous mutations was used to derive a malignancy score representing the malignant potential of each gene (Fig. 3f). This revealed Smad4 and Ctnnb1 as the genes most associated with malignancy (41% and 37% malignancy scores, respectively), as opposed to inflammatory genes (e.g. 13% and 4% for Nfkbiz and Il17rc, respectively). Consistent with the dN/dS analysis, amino-acid positions 32-41 were identified as a hotspot in the Ctnnb1 gene relating to oncogenic activity arising from stabilisation of the protein (Supplementary Fig. 6b). Although Ctnnb1 mutations are uncommon in human colon cancer, Smad4 mutations are associated with poor-prognosis, recurrence and resistance to treatment in colorectal cancer patients^32,33^ and found mutated in 13% of CACs^4^. The most mutated SMAD4 position in human colon cancer is 361, with substitution from an arginine to a histidine (p.R361H). Here, tumour-associated Smad4 mutations include 6 missense mutations at positions 160, 194, 294, 307, 360 and 376, and a nonsense mutation at position 194 (Supplementary Table 4).
Expansion capability of tumour- and non-tumour-associated mutations
To determine the capacity of tumour- and non-tumour-associated mutations to expand, the VAF was used as a surrogate of mutated clone size (Fig. 3g). As expected from the VAF distribution of Ctnnb1 mutations (Fig. 3d) and the high malignancy score of this gene (Fig. 3f), tumour-associated SNVs reached high VAFs corresponding to large tumours. In accordance, half of clones spanning more than one biopsy correspond to missense mutations in Ctnnb1, followed by a quarter of Apc truncating mutations (Supplementary Fig. 5), largely reflecting the size which can be reached by clones after malignant transformation. Only a single large expansion detected in Il17rc was not tumour-associated (Fig. 3h). Below 5% VAF however, the distribution of clone size for either tumour- or non-tumour-associated mutations is similar (Fig. 3g). Furthermore, clones bearing mutations that have not been linked with neoplasia can expand to reach more than 5% VAF in a single biopsy. This is the case for Arid1a p.Y473*, Il17ra p.I405V, Nfkbiz p. M414K and Rela p.Y66C (Supplementary Table 3). This indicates that prior to neoplastic transformation, clones bearing either tumour- or non-tumour-associated mutations have similar expansion capability.
Tissue repair promotes expansion of pro-oncogenic clones
To determine whether preferential selection of tumour-associated mutations could explain the relationship identified between the tissue repair neighbourhood defined by cluster 4 and the tumour cluster, we examined the correlation between the number of tumour-associated mutations and the proportion of tissue covered by each cluster (fig. 4a). This revealed a positive correlation for the tissue repair cluster 4 (Kendall-rank test correlation coefficient R = 0.56, p value 8.3e-03). This association was tested by mapping tumour-associated mutations to the UMAP space (Fig. 4b), revealing a 27% probability for a spatial barcode in a biopsy holding a tumour-associated mutation to fall within the epithelial repair cluster 4, second only to the tumour and neutrophil clusters (Fig 4c). In contrast and as expected, spatial barcodes in biopsies containing synonymous SNV have an equal chance to be part of any cluster (Fig. 4d). This suggests that compared to neutral events, pro-oncogenic clones preferentially appear in a tissue repair context. Furthermore, below 10%, VAFs for tumour-associated mutations increase with the proportion of the tissue sample covered by the epithelial repair neighbourhoods (Global linear model intercept = 0.13 p value = 1.59e-6) (Fig. 4e). The preferential emergence of tumour-associated mutations in the context of tissue repair provides a mechanistic link explaining why tumours are initiated in repairing epithelium in the context of chronic inflammation.
Non-oncogenic clones accumulate in immune resistant neighbourhoods
Importantly, the correlation between the number of non-tumour-associated mutations and proportion of the tissue sample covered by the immune resistant cluster 0 was the highest of all clusters (R= 0.35, p value 0.066) (Fig. 4f). Furthermore, the chance for a spatial barcode in a biopsy holding a tumour-associated mutation to fall in the inflammation resistant epithelial cluster 0 is the lowest out of all epithelial cluster except for the healthy cluster 3 (Fig. 4c), To determine whether the inflammation-resistant environment of cluster 0 could promote expansion of non-oncogenic clones, we used immunostaining to detect variation in expression of the Arid1a gene. Deletion of this gene is usually presented as a driver of colorectal cancer, however this gene is also highly mutated in non-dysplastic IBD epithelium^1–3^. Here, despite a high mutation burden, the malignant score of Arid1a is only 12%, suggesting that most mutations in this gene do not drive tumorigenesis. Immune exclusion has recently been observed in Arid1a-mutant clones in normal human colon epithelium^34^ and could explain why mutations in this chromatin remodeller shows a similar profile to mutations in inflammatory genes. Using immunostaining, we could detect Arid1a upregulation at the protein level in tumours (Fig, 4g), suggesting that non-mutational stabilisation of Arid1a could be required in cancer cells. Such processes have been described in liver tumorigenesis, another inflammation-driver cancer^35^. The same antibody allowed the detection of loss or downregulated expression of Arid1a in mutant clones (Fig. 4h). We find that the number of Arid1a-deficient clones detected through immunostaining increases with the proportion of the biopsy covered by the immune resistant cluster 0 (Global linear model intercept = 0.17 p value = 1.35e-9) (Fig. 4i), confirming a strong association between presence of mutations in genes that have low malignancy score and the establishment of environments where response to inflammatory cues is dampened.
DISCUSSION
Mutant clones selected in IBD may impact pathogenesis and development of colitis associated cancer. Detailed cataloguing of mutations, assessment of their location and function in patients is made complicated by the rarity of such events, sampling methods and confounding effects of treatment. Here, a mouse model of colitis at early stages of tumour initiation was leveraged to profile the mutations selected and the environment they arise in, which together shape the conditions favouring different phenotypic outcomes, including neoplasia. Importantly, a framework for combined detection of somatic mutations and profiling of associated changes in gene expression is provided.
Tissue repair and the associated remodelling of the extracellular matrix has been described as cancer promoting^36–38^. Here, we find a positive correlation between establishment of a repairing epithelial environment, accumulation and expansion of pro-oncogenic mutations, and eventual malignant transformation. Therefore, altough tissue repair is a wanted outcome in chronic inflammatory diseases, the risk of neoplastic transformation in such contexts must be considered. Here, the process by which epithelial repair promotes clonal expansion by crypt fission is outlined. This process is neutral, but mutations conferring an increased fission capacity gain a significant advantage. Arid1a-mutated clones have been shown to display fission bias^34^, which may explain their presence in CAC samples despite the low malignant score found for this gene in our study.
In contrast, the establishment of an inflammation-resistant environment was associated with accumulation of non-oncogenic clones previously found in the non-dysplastic epithelium of IBD patients^1–3^. The extent of expansion of such mutations in normal tissue both in this study and previous work in patients samples suggests they may be contributing to the maintainance of such inflammation-resistant environment. Despite evidence from previous studies pointing to a role in worsening the activity of Ulcerative Colitis, an implication of our work is that establishement of an inflammation-resistant environment may act to prevent expansion of pro-oncogenic mutations, thereby delaying malignant transformation. Notch1 clonal expansion has been described as anti-oncogenic in the context of the oesophagus, where such clones compete with cancer-drivers to prevent their transformation^39,40^. Further studies will need to address the functional link between expansion of mutations in inflammatory and chromatin remodelling genes and competition with pro-oncogenic mutations. Promoting tissue repair whilst controlling malignant transformation is of upmost importance for long-term management of IBD, and particularly revelant considering recent epidemiology studies showing rising incidence of IBD in children, with a decrease of the childhood age of onset^41^.
METHODS
Mice
Mice were of C57BL/6 background. The Muc2^KO^ line used was described by Velcich et al.^11.^ Mice containing inter-crossed R26^Confetti^ and VillinCre^ERt2^ alleles^12^ were bred to Muc2^KO^ mice to generate VillinCreERt2; Muc2^KO^; R26^Confetti^ mice. Genotyping was outsourced to Transnetyx (Cordova, TN, USA).
Animal husbandry
Animal care and procedures were performed at the Cancer Research UK Cambridge Institute Biological Resource Unit according to the UK Home Office under the authority of a Home Office project licence (PD5F099BE) approved by the Animal Welfare and Ethical Review Body at the CRUK Cambridge Institute, University of Cambridge. Mice were housed under controlled conditions (temperature (21 ± 2°C), humidity (55 ± 10%), 12h light/dark cycle) in a specific-pathogen-free (SPF) facility (tested according to the recommendations for health monitoring by the Federation of European Laboratory Animal Science Associations). Animals had unrestricted access to food and water. None of the mice had been involved in any procedure prior to the study
3D imaging and clone counting
The whole colon of VillinCreERt2; Muc2^KO^; R26^Confetti^ mice was dissected, flushed with cold PBS, cut longitudinally, and whole-mounted. Following fixation in 4% paraformaldehyde overnight at 4 °C, the tissue was washed in PBS and selected colon segments were excised. Optical clearing was performed using the CUBIC protocol^42^. In brief, excised segments were incubated with CUBIC-1a solution (10% urea, 5% N,N,N′,N′-tetrakis(2-hydroxypropyl) ethyl-enediamine, 10% Triton X-100 and 25 mM NaCl in distilled water) at 37 °C for 7–10 days with alternate day solution changes. DAPI was used for nuclear counterstaining at a dilution of 1:1,000. The cleared tissue was then washed in PBS for 24 h. Additional clearing and refractive index matching were performed with Rapiclear 1.52 (152002, SunJin Labs) for 24 h. Samples were mounted in a 0.25 mm i-Spacer (Sunjin Labs) for confocal imaging on a Leica SP5 TCS confocal microscope (LAS software v2.8.0, Leica Biosystems) with a 10× objective, 1.4–1.7 optical zoom and 8–12 μm z-steps throughout the whole thickness of the tissue. Clone counting was performed using the cell counter tool in the ImageJ software.
Immunohistochemistry
Mouse colons were opened longitudinally and cut in approximately 15mm^2^ sections placed in cassettes and fixed overnight at 4 °C in 4% paraformaldehyde. Haematoxylin and eosin (H&E) staining was performed using an automated ST5020 Multistainer (Leica Biosystems). Staining for β-catenin was performed on Leica’s automated Bond-III platform in conjunction with the Polymer Refine Detection System (DS9800, Leica Biosystems). In brief, epitope retrieval was performed using Leica Epitope Retrieval Solution 1 (AR9961, Leica Biosystems) at 100 °C. Blocking was performed with Protein Block Buffer (X090930-2, Dako). Following incubation with primary antibody against β-catenin (0.25 μg ml^−1^, mouse, 610154, BD Biosciences), sections were incubated with secondary antibody (1:1,500, rabbit anti-mouse IgG1, ab125913, Abcam) before development and mounting. For β-catenin staining, an additional mouse-on-mouse blocking step was performed.
Immunofluorescence
Heat-mediated epitope retrieval was performed on rehydrated 3-μm-thick paraffin sections in 10 mM sodium citrate (pH 6.0). The sections were then incubated in blocking solution (10% donkey serum and 0.05% Tween-20 in PBS) at room temperature for 30 min. Primary antibodies against RFP (1:100, rabbit, R10367, Thermo Fisher), GFP (1:100, chicken, ab13970, Abcam), E-cadherin (1:200, mouse, 610182, BD Biosciences), Trop2 (1:100, goat, AF1122, R&D systems) and Arid1a (1:100, rabbit, 12354S, Cell Signalling) were diluted in blocking solution, in which sections were then incubated in the dark overnight at 4 °C. Sections were washed and incubated with fluorophore-conjugated secondary antibodies (donkey anti-rabbit A31572, donkey anti-goat A21447 and/or donkey anti-chicken 703-6-5-155, Thermofisher and/or donkey anti-mouse ab150109, Abcam) diluted 1:200 in 0.05% Tween-20 in PBS for 45 min at room temperature. DAPI (1:1,000) was used for nuclear counterstaining. After washing, the stained sections were mounted using ProLong Gold Antifade Mountant (P36930, Thermo Fisher,).
RNAscope
Simultaneous detection of Notum and Reg4 was performed on paraffin embedded sections using Advanced Cell Diagnostics (ACD) RNAscope 2.5 LS Duplex Reagent Kit (322440), RNAscope 2.5 LS Probe- Mm- Notum C1 (428988), and RNAscope 2.5 LS Probe-Mm-Reg4-C2 (409608). Three-micrometre-thick sections were baked for 1 h at 60 °C before loading onto a Bond RX instrument (Leica Biosystems). Slides were deparaffinized and rehydrated on board before pre-treatments using Epitope Retrieval Solution 2 (AR9640, Leica Biosystems) at 95 °C for 15 min, and ACD Enzyme from the Duplex Reagent kit at 40 °C for 15 min. Probe hybridization and signal amplification were performed according to manufacturer’s instructions. Fast red detection of C2 was performed on the Bond Rx using the Bond Polymer Refine Red Detection Kit (DS9390, Leica Biosystems) according to ACD protocol. Slides were then removed from the Bond Rx and detection of the C1 signal was performed using the RNAscope 2.5 LS Green Accessory Pack (322550, ACD) according to kit instructions. Slides were heated at 60 °C for 1 h, dipped in Xylene and mounted using VectaMount Permanent Mounting Medium (H-5000, Vector Laboratories). The slides were imaged on the Aperio AT2 (Leica Biosystems) to create whole slide images. Images were captured at 40× magnification, with a resolution of 0.25 μm per pixel.
Inference of effective fission rate from lineage tracing data
The statistical model for crypt fission described in Nicholson et al., 2018 and implemented in the R package RHClones (https://github.com/ElEd2/RHClones) was adapted to infer effective fission rates using manual counts of clone sizes from tissue regions in Muc2^het^ and Muc2^hom^ mice with different average Trop2 expression levels. In brief, each tissue region was assigned a local fission rate (units 1/days) that is sampled from a hierarchical Student’s T prior
with population-level parameters
The vector of observed clone sizes, , for region is then distributed according to
where
is the solution of the Yule-Furry pure birth process, and is the time (in days) since clone induction in region .
The model for fission inference in this study differs from the model for fission after continuous clone induction described in Nicholson et al., 2018 where this solution is integrated over the age of the individual. However, as in the aforementioned study, a correction was applied to and to correct for the chance occurrence of neighbouring, non-clonally related crypts. This model does not incorporate crypt fusion, nor does it account for tissue re-modelling that may partly explain clone sizes in tissue regions associated with repair following inflammation. In this respect, inferred fission rates should be interpreted as “effective” in the sense that they only capture the value of that is required to explain clone sizes using the Yule-Furry pure birth process introduced in Nicholson et al., 2018.
Simulations of crypt dynamics
Crypt dynamics were simulated using an on-lattice, voter-type model. The square lattice is of shape . For a site on the lattice, the neighbouring sites are defined to be the set:
resembling a configuration equivalent to a hexagonal lattice in two dimensions with periodic boundary conditions. The state of a lattice site , denoted by , is defined as for unlabelled (UL) sites, for empty sites and for labelled (L) sites. Assuming a labelling efficiency of 20%, the initial population on the lattice consists of 80% of UL and 20% of L sites randomly assigned to each site. The parameters governing the simulations are the fission , fusion and fixation probabilities of the state . All are assumed to be neutral and equal for and UL crypts as the baseline scenario ( for , undefined otherwise). To determine the impact of fission bias in tissue repair, the fission probability of L sites was increased to , with all other parameters remaining the same.
The simulation rules are that, at each time step, we choose a random site and update the lattice state according to:
If is an empty site :
-
and all neighbours are empty sites ( ), do nothing;
-
otherwise, choose a non-empty neighbour site at random to undergo fission by setting with probability (Supplementary Fig. 2a). If is non-empty , then choose a neighbour at random and:
-
if ( ) is empty then ( ) undergoes fission by setting with probability
-
otherwise, fusion occurs with probability by choosing with equal probability and setting . The outcome of monoclonal fixation following fusion is then determined to be the state according to the fixation probabilities and as outlined in Supplementary Fig. 2b and 2c and then setting where .
We note that our definition of homeostasis in in silico models is not equivalent to an equilibrium since, while the average numbers of labelled and unlabelled crypts remain constant, their spatial distribution across the lattice undergoes domain coarsening as captured by a “site aggregation” metric that slowly increases across the course of simulations (Methods and Figure 1f, l). Furthermore, fission biased conditions lead to a non-homeostatic system even in the absence of damage, since higher expansion rates generally outpace the creation of empty space by crypt fusion. This is reminiscent of a regime where additional mechanisms, such as diffusion (not considered here), may be required to spatially accommodate mutant crypts with higher rates of fission (Olpe et al., 2021).
Calculation of site aggregation
The number of distinct neighbour pairs (DNPs) was quantified to represent aggregation of labelled and unlabelled sites in the lattice. The number of the DNPs for a on the lattice is defined to be the cardinality of the set:
The neighbour pairs (NPs) of a site is the set:
To obtain a measure of DNPs independent of grid size, we consider the concentration of DNPs, defined as:
where and are the total number of DNPs and NPs over the whole lattice, respectively. Importantly, we considered aggregation of labelled and unlabelled sites, excluding empty sites, and plotted site aggregation as , so that increasing values denote a decreasing concentration of DNPs.
Bulk RNA sequencing
RNA was collected from n=3 Muc2^hom^ and 3 Muc2^het^ mouse colons from 10-months-old littermates. mRNA extraction was performed following instructions from the extraction kit (180244, Qiagen). Library prep was performed by the CRUK Cambridge Institute Genomics Core using the Illumina Stranded mRNA Prep kit (20040532, Illumina) according to manufacturer’s instructions. Samples were sequenced using the Illumina Novaseq platform with 50 bp paired end reads. Differential expression analysis was performed using DESeq2. Expressed genes were ranked by descending log2 fold change for use in gene set enrichment analysis (Subramanian et al., 2005).
Setup for paired Spatial Transcriptomic and DNA sequencing
A cohort of five Muc2^hom^ mice were treated with ENU 8 weeks post birth and aged for 16 more weeks before collection. Whole-mounted colons were fixed, and 6 serial tissue sections of 3-5μm thickness were cut at the crypt base, for at least three areas per colon representing varied levels of pathology. Levels were used for 1. Spatial transcriptomics profiling, 2. Pathology assessment with H&E, 3. Tumour counting with Beta-catenin immunohistochemistry, 4. Clone counting with GFP, RFP + DAPI and E-cadherin counterstain), 5. Arid1a-mutated clone counting with Arid1a + DAPI counterstain.
Spatial Transcriptomics
Slide processing and library preparation were performed according to the 10X Visium Cytassist FFPE protocol. Briefly, 5μm sections of tissue were transferred to fit each of the two 11m2 oligo-barcoded capture areas on Visium 10x Genomics slides. Libraries were processed by the CRUK Cambridge Institute Genomics Core according to the manufacturer’s instructions and sequenced on Illumina’s NovaSeqX Plus to an average depth of 8 million mapped reads per sample. Fastq files were processed using the Spaceranger command line tool (10x Genomics v3.0.1) and mapped to the pre-built mm10 reference genome. Processed gene expression matrices for each slide were converted to a Seurat object. After normalisation by variance stabilising transformation using SCTransform, objects corresponding to each slide were integrated into a merged Seurat object using Harmony^43^. Clusters were identified using FindNeighbors using integration anchors at a UMAP dimension of 0.5. Genes differentially expressed in each cluster were derived using FindMarkers. Top markers for each cluster indicated in Supplementary Fig. 2b were selected based on log2 fold change showing high expression in the cluster, high pct.1 showing good representation in spatial barcodes mapped to the cluster and low pct.2 showing poor representation in spatial barcodes mapped to other clusters. For pseudo-bulk analysis, LoupeBrowser was used to extract spatial barcodes assigned to each of the 2mm-diameter biopsies from which DNA was sequenced.
NGS library preparation with Targeted DNA sequencing library assays
Genes of interest were imported in the Fluidigm D3 Assay design platform and dual coverage primers were designed (Supplementary Table 5). 8 amplicons pools were prepared and used in the LP 8.8.6 integrated fluidic circuit (IFC) (101-7663) according to manufacturer’s instructions. Samples were sequenced in 2 separate runs by the CRUK Cambridge Institute Genomics Core on Illumina NovaSeqX Plus for 150bp paired end reads.
Mutation calling
RePlow was used for mutation calling based on dual replicate amplicon coverage^44^ using combinatorial pooling of amplicons. In brief, RePlow exploits replicate library preparations to separate the contribution of background errors occurring in library preparation from sequencing errors occurring in sequencing. This is done with a statistical model that calculates the total log ratio of probabilities for variant candidates compared to background errors across all replicates simultaneously. In doing so, adjusted variant allele frequencies (VAFs) are constructed by subtracting the contribution from sequencing errors, while background error profiles for the error model are calculated independently for the six base pair substitution types (A>C, A>G, A>T, C>A, C>G, C>T) across the targeted regions. An additional stringent filtering step was applied whereby only variants with a positive log ratio of probabilities in both replicates individually were retained, to exclude false positive calls at low VAF values. Orthogonal validation of mutation calls was done using the Ampliconseq pipeline (https://github.com/crukci-bioinformatics/ampliconseq). Briefly, variants are called using Vardict from sequence reads aligned to the reference genome (GRCm39). The pipeline models the background substitution noise at each amplicon position to identify and filter SNV calls with an allele fraction indistinguishable from noise. A minimum of 0.01% VAF was set as the lower detection threshold. Outliers in the VAF/noise threshold plane, corresponding to remaining artefacts and germline SNVs were removed post-hoc.
Tessellation algorithm for clone calling
To parsimoniously assign multiple calls of the same mutation made from the same piece of colon tissue to individual clones, as well as resolve the spatial context of the colon that was opened longitudinally prior to biopsy sampling, a Voronoi tessellation with periodic boundary conditions along the radial axis of each tissue section was calculated using the spatial coordinates of the corresponding biopsies. A depth-first-search algorithm was then employed to call single clones by enumerating all connected components of the graph with edges defined by adjacent Voronoi tiles (or those found within 2mm from one another) containing the given mutation.
Quantifying selection using dN/dS
The latest version of the maximum likelihood implementation of dN/dS, as origionally described in Martincorena et al.^45^ and available in the R package dNdScv (https://github.com/im3sanger/dndscv), was applied to identify genes under positive selection. A custom reference object was built from the assembly GRCm39 by sub-setting the trinucleotide context-dependent substitution consequence matrix to the set of possible mutations based on the region of the genome selected for targeted sequencing in this study. Counts of mutations fed into the algorithm were those based on individual clones, as defined above.
Statistical analyses and reproducibility
Visualization and statistical analysis of data were performed in the R statistical computing environment (version 2024.04.0+735). All experiments were performed on at least three independent biological replicates (three different mice). Micrographs depict representative data derived from at least three independent biological replicates. Normality was assessed using Shapiro-Wilk’s tests and relevant statistical tests applied. Tests and corresponding P values are indicated in the figure legends and figures, respectively. Box plots display the distribution of data using the following components: lower whisker show the smallest observation greater than or equal to lower hinge minus 1.5× IQR; lower hinge shows the 25% quantile; the centre line shows the median, 50% quantile; the upper hinge shows the 75% quantile; the upper whisker shows the largest observation less than or equal to upper hinge plus 1.5× IQR.
Supplementary Material
1
The reference list from the paper itself. Each links out to its DOI / PubMed record.
- 1Olafsson S. Somatic Evolution in Non-neoplastic IBD-A Jected Colon. Cell 182, 672–684.e 11 (2020).32697969 10.1016/j.cell.2020.06.036PMC 7427325 · doi ↗ · pubmed ↗
- 2Nanki K. Somatic inflammatory gene mutations in human ulcerative colitis epithelium. Nature 577, 254–259 (2020).31853059 10.1038/s 41586-019-1844-5 · doi ↗ · pubmed ↗
- 3Kakiuchi N. Frequent mutations that converge on the NFKBIZ pathway in ulcerative colitis. Nature 577, 260–265 (2020).31853061 10.1038/s 41586-019-1856-1 · doi ↗ · pubmed ↗
- 4Chatila W. K. Integrated clinical and genomic analysis identifies driver events and molecular evolution of colitis-associated cancers. Nat Commun 14, 1–13 (2023).36611031 10.1038/s 41467-022-35592-9PMC 9825391 · doi ↗ · pubmed ↗
- 5Jairath V. & Feagan B. G. Global burden of inflammatory bowel disease. The Lancet Gastroenterology and Hepatology vol. 5 2–3 Preprint at 10.1016/S 2468-1253(19)30358-9 (2020).31648974 · doi ↗ · pubmed ↗
- 6Shah S. C. & Itzkowitz S. H. Colorectal Cancer in Inflammatory Bowel Disease: Mechanisms and Management. Gastroenterology vol. 162 715–730.e 3 Preprint at 10.1053/j.gastro.2021.10.035 (2022).34757143 PMC 9003896 · doi ↗ · pubmed ↗
- 7Zhou R. W., Harpaz N., Itzkowitz S. H. & Parsons R. E. Molecular mechanisms in colitis-associated colorectal cancer. Oncogenesis vol. 12 Preprint at 10.1038/s 41389-023-00492-0 (2023).PMC 1060314037884500 · doi ↗ · pubmed ↗
- 8Wenzel U. A. Spontaneous colitis in Muc 2-deficient mice reflects clinical and cellular features of active ulcerative colitis. P Lo S One 9, 1–12 (2014).10.1371/journal.pone.0100217 PMC 406376224945909 · doi ↗ · pubmed ↗